
Study on Characteristics of Seismic Sequence Types and Early Aftershock Prediction Method in Hebei and Its Surrounding Regions
-
摘要: 本文梳理了河北及邻区(京津冀地区)1970年至2022年MS≥3.5地震目录,对MS≥3.5主震进行地震类型判定。研究发现,在该地震目录中,主余型地震66次,多震型地震24次,孤立型地震58次。本文对研究区内地震类型及其空间分布特征进行分析,并利用震级均值特性计算地震序列的最大余震震级,结果表明:(1)研究区域内的地震类型以主余型为主(45%),孤立型次之(39%),多震型最少(16%)。9次MS≥5.0主震中,主余型3次,孤立型6次。随着震级增大,主余型地震所占比例也随之增加。(2)主余型地震序列和多震型地震序列中,最大余震在震后1 d内发生的占比最大。(3)地震类型的空间分布显示,3种类型的地震,沿着张家口—渤海地震带和河北平原地震带分布。孤立型地震在这2个条带上分布比较均匀;主余型地震主要分布在张家口、唐山、邢台一带;多震型地震与主余型地震分布情况基本相同。(4)利用震级均值特性,计算该区MS≥5.0主震(主余型)的最大余震震级,发现3个研究震例计算得到的最大余震震级与实际记录比较相近,可以用此方法预估河北地区未来中强震的最大余震,为震后强余震的判断提供参考方法。Abstract: This study reorganizes the earthquake catalog of MS≥3.5 events from 1970 to 2022 in Hebei and its surrounding regions (Beijing-Tianjin-Hebei) and classifies the earthquake types of MS≥3.5 main earthquakes. The analysis identifies 66 mainshock-aftershock earthquakes, 24 multiple-mainshock earthquakes, and 58 isolated earthquakes. The study examines the types and spatial distribution of earthquakes and estimates the maximum aftershock magnitude of earthquake sequences using the average magnitudes of aftershock sequences. The key findings are as follows: (1) Mainshock-aftershock earthquakes are the most prevalent (45%), followed by isolated earthquakes (39%) and multiple-mainshock earthquakes (16%). Among the MS≥5.0 earthquakes (nine in total), three are mainshock-aftershock events, while six are isolated earthquakes. Additionally, the proportion of mainshock-aftershock earthquakes increases with earthquake magnitude. (2) In both mainshock-aftershock and multiple-mainshock sequences, the largest aftershocks predominantly occur within one day after the main event. (3) The spatial distribution of earthquake sequences reveals that all three earthquake types are concentrated along the Zhangjiakou-Bohai and Hebei Plain seismic belts. Isolated earthquakes are evenly distributed across these belts, while mainshock-aftershock and multiple-mainshock earthquakes are mainly concentrated in Zhangjiakou, Tangshan, and Xingtai. (4) The maximum aftershock magnitude for MS≥5.0 mainshock-aftershock earthquakes is estimated using the average magnitudes of aftershock sequences. The calculated values closely match observed data, indicating that this method can serve as a predictive tool for assessing the maximum aftershock magnitude of moderate to strong earthquakes in Hebei. This approach provides a valuable reference for evaluating the likelihood of strong aftershocks following seismic events.
-
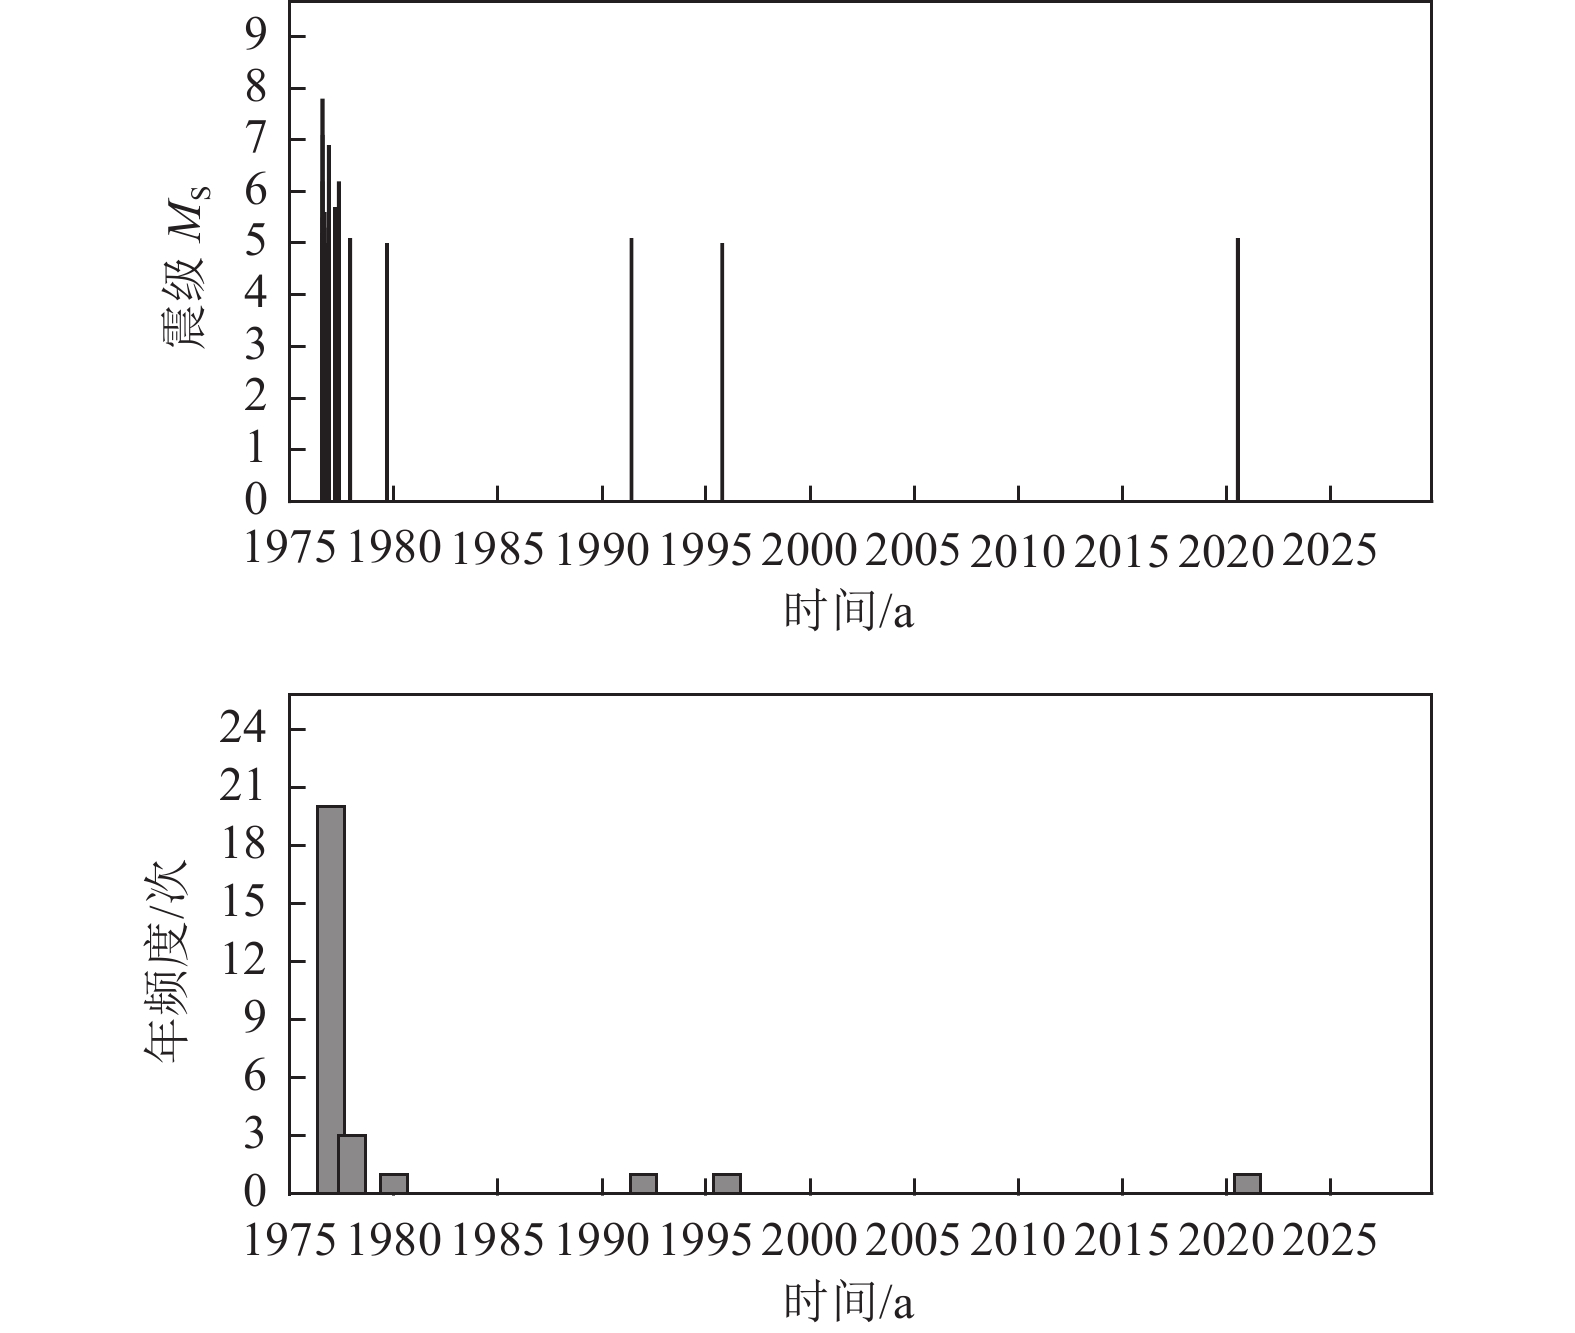
图 2 唐山MS7.8地震后MS≥5.0地震的M-T和N-T图(1976-07-28—2023-12-31)
Figure 2. The M-T and N-T plots of earthquakes with MS≥5.0 after the Tangshan MS7.8 earthquake
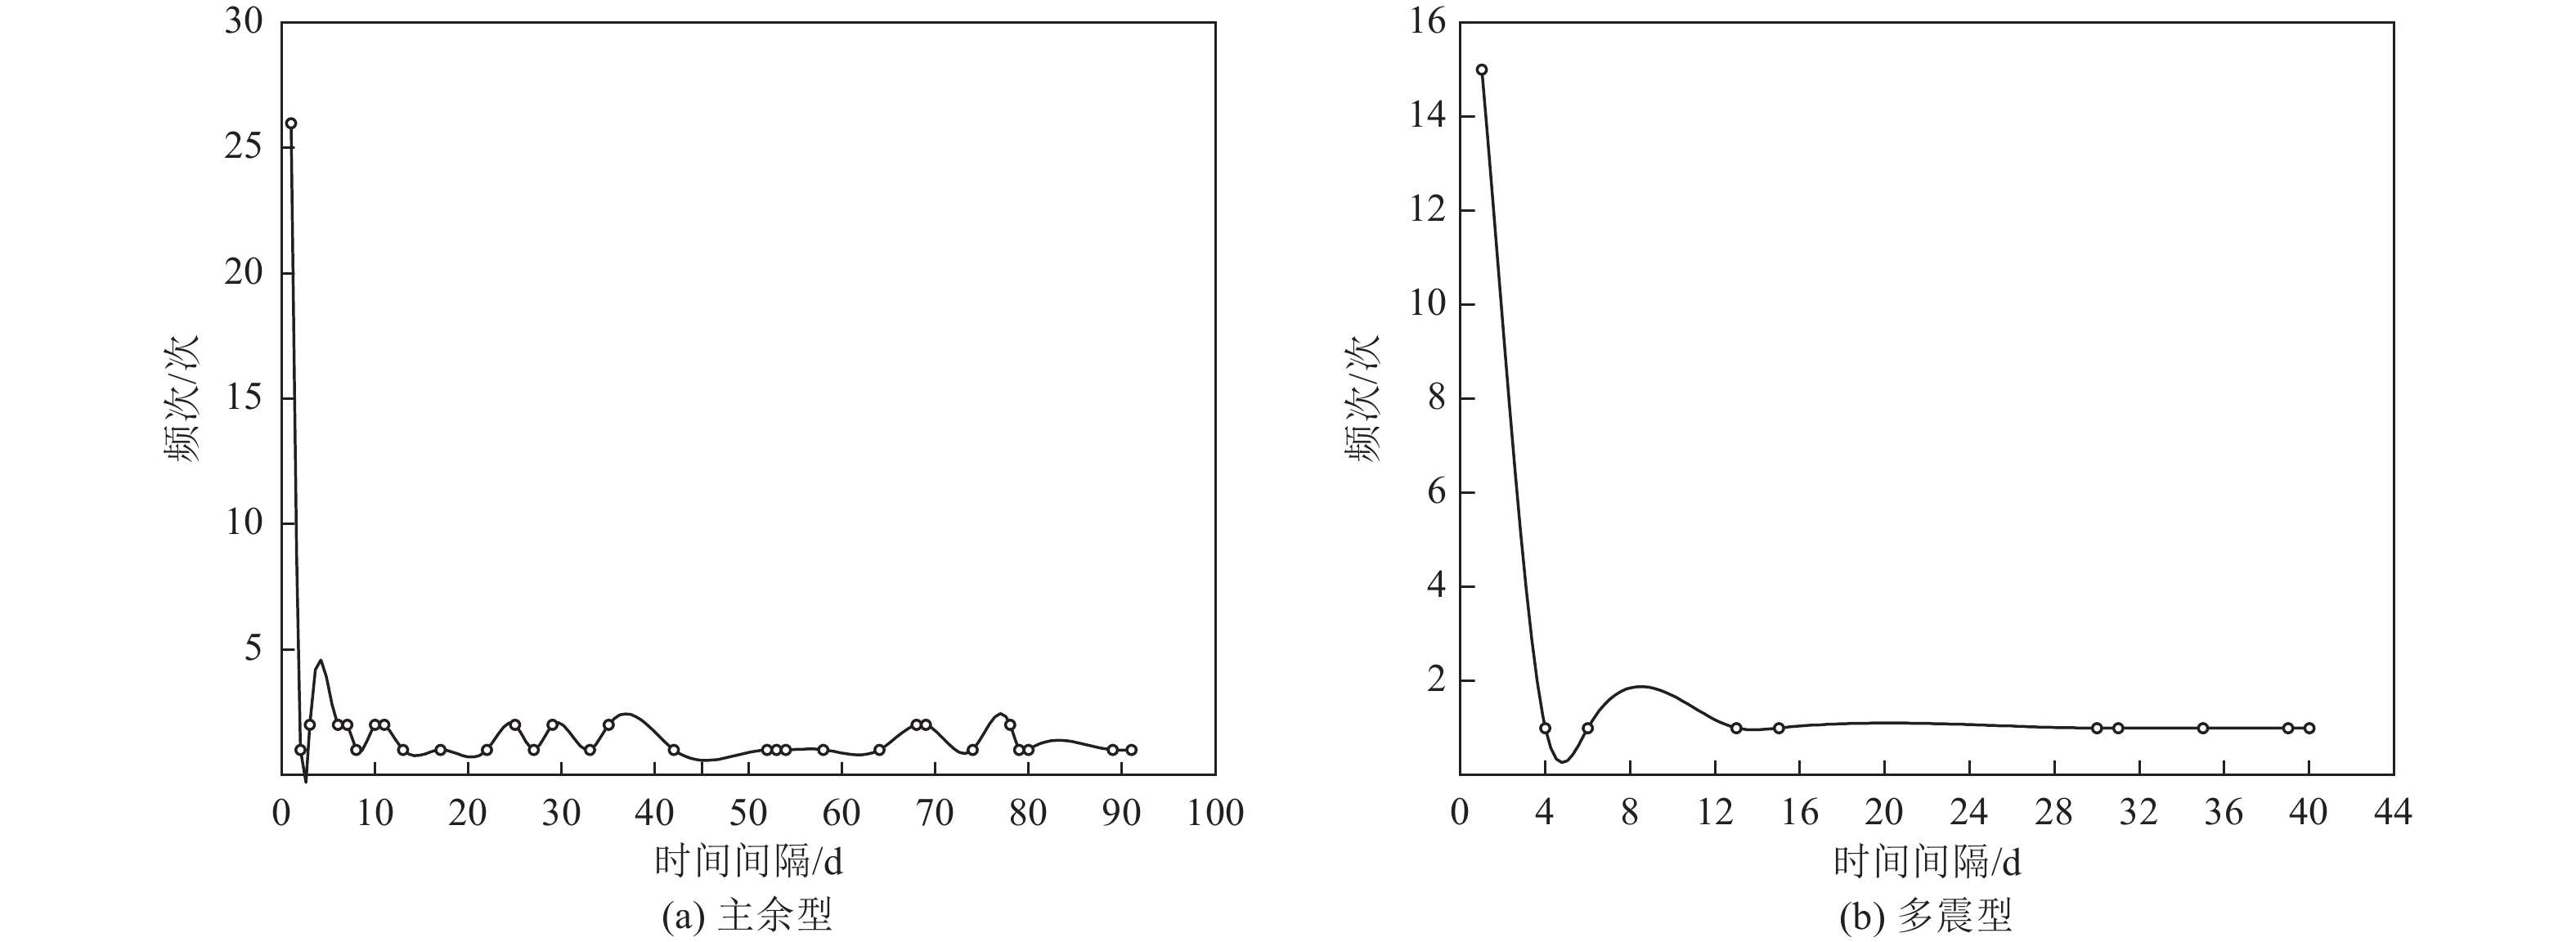
图 3 最大余震与主震时间间隔-频次图
Figure 3. Time frequency plot of the interval time between the maximum aftershock and the main shock
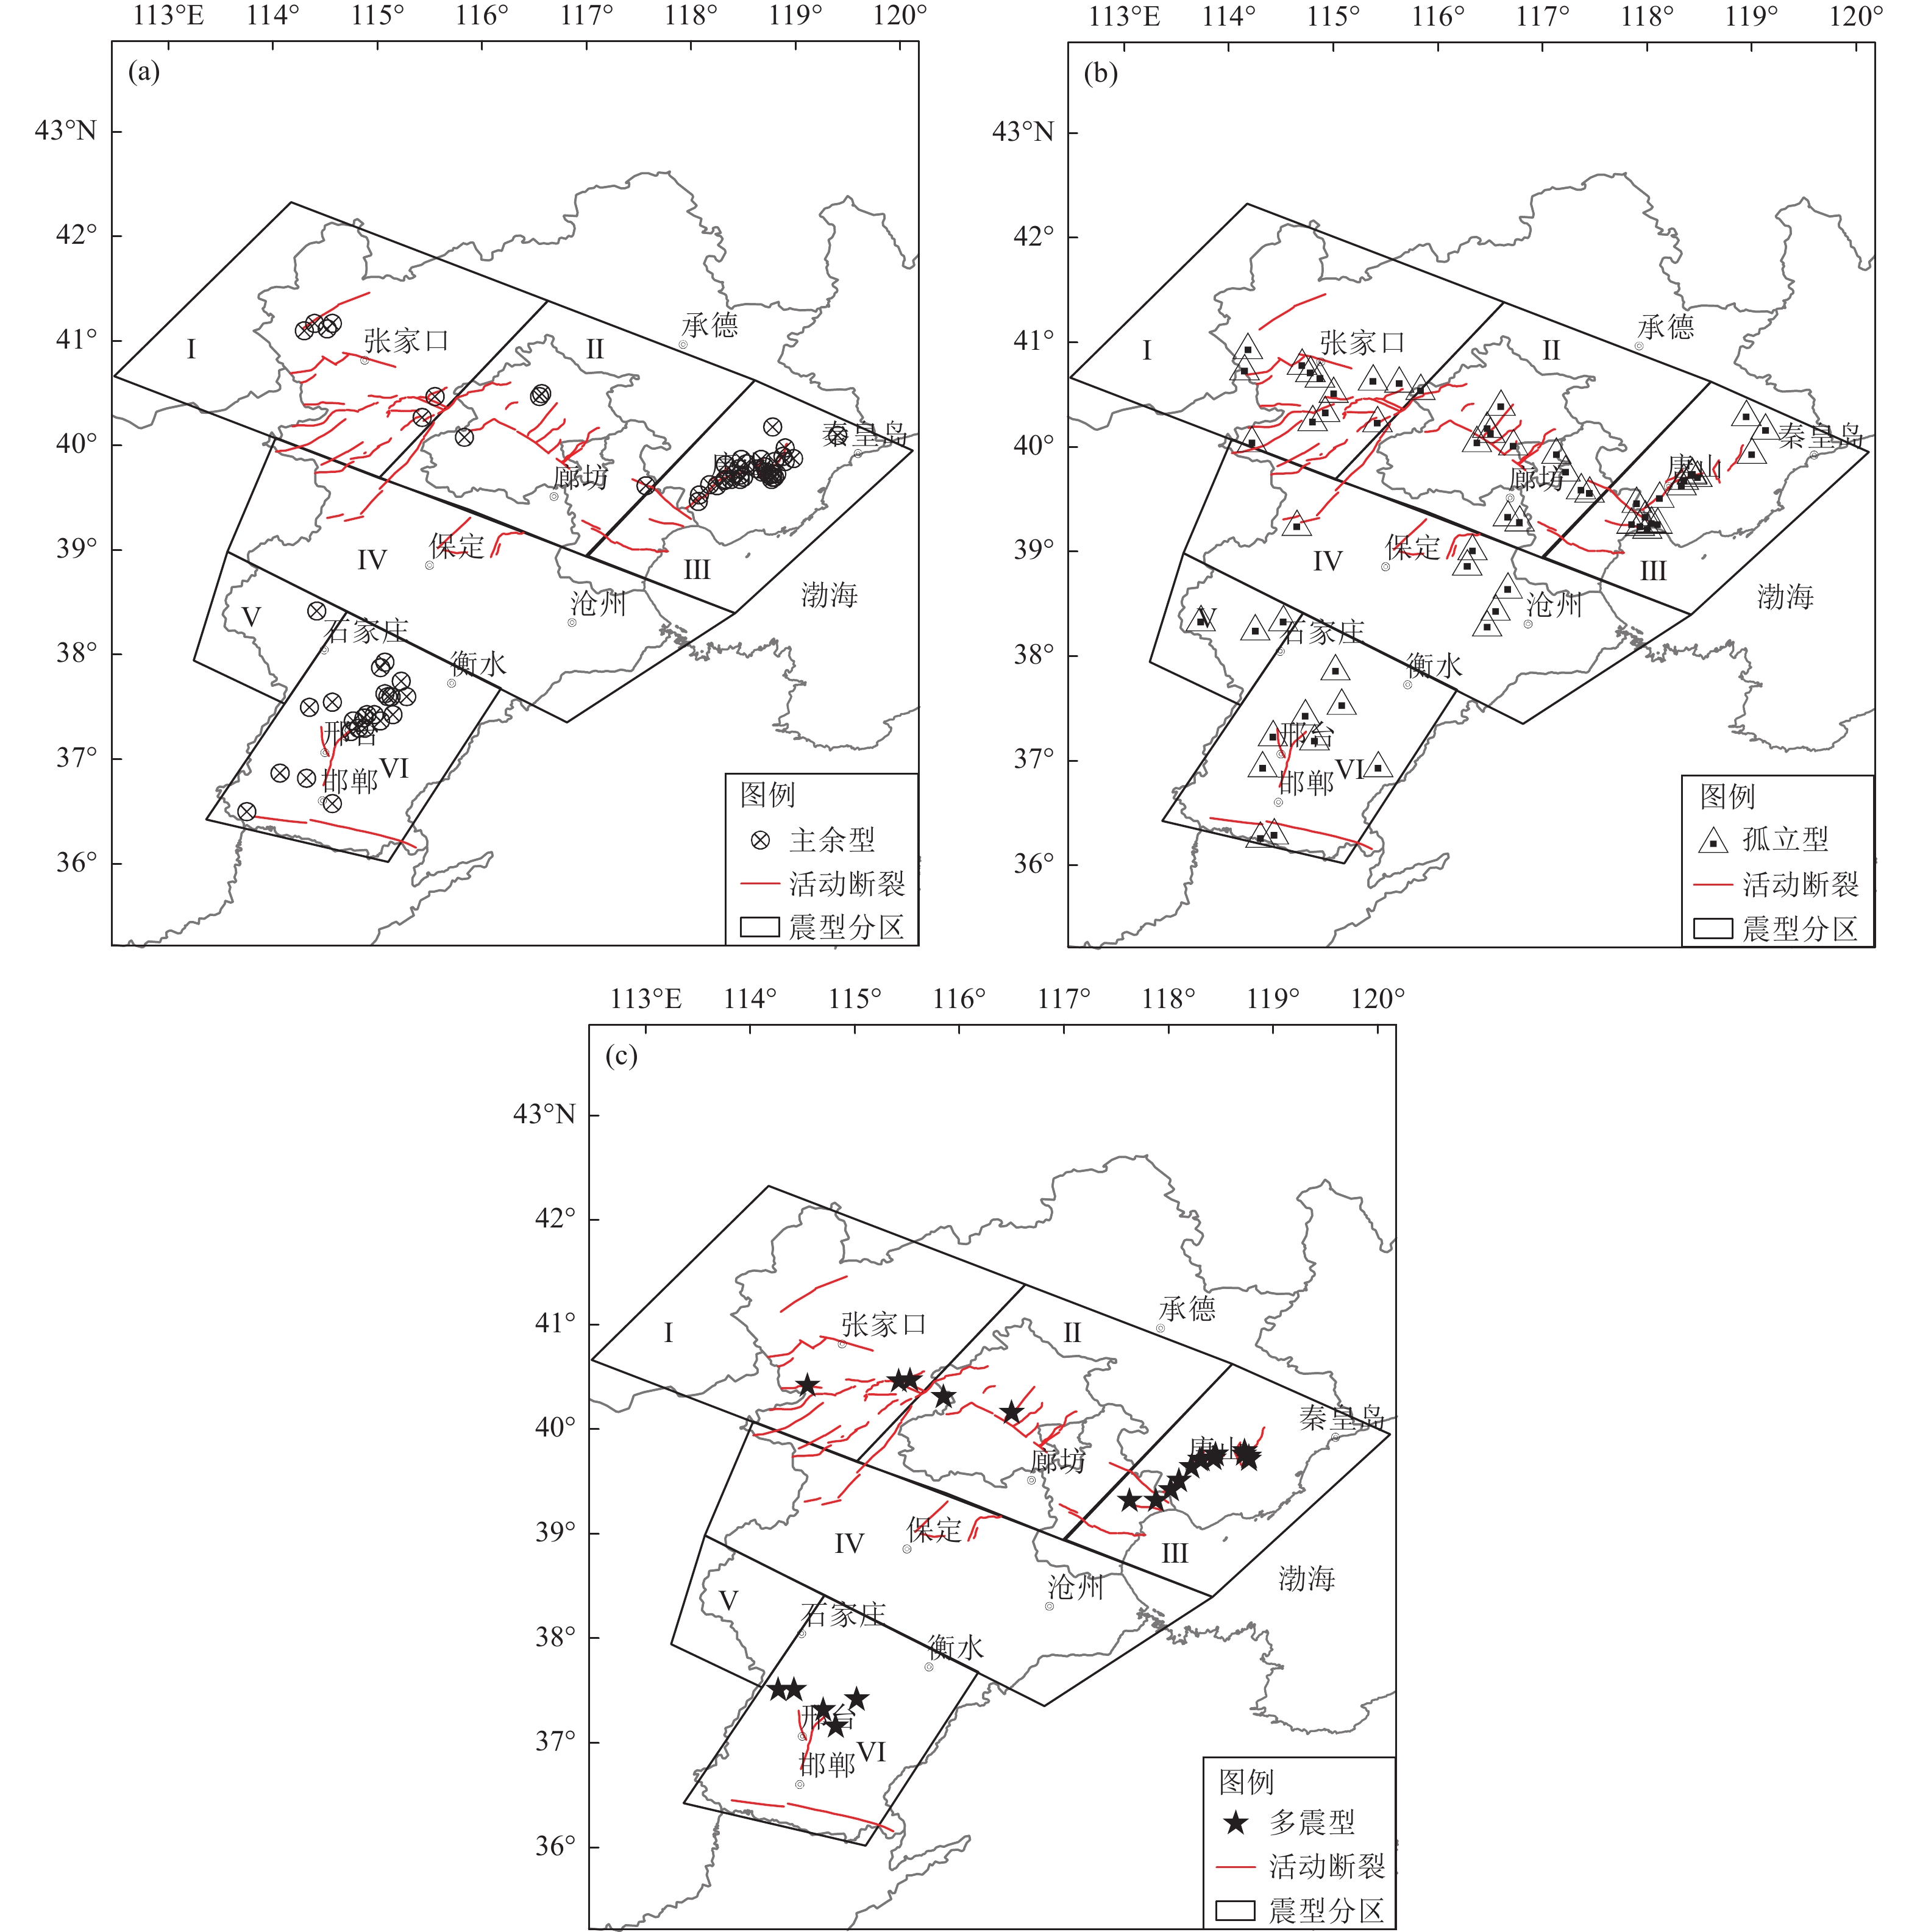
图 4 河北及邻区地震类型分区及震中分布图
Figure 4. Division of sub-regions and epicenters of earthquake types in Hebei and its surrounding regions
表 1 河北及邻区MS≥3.5主余型地震(1970—2022)
Table 1. Mainshock-aftershock earthquakes of MS≥3.5 in Hebei and its surrounding regions (1970—2022)
序号 发震时间
(年-月-日)纬度/(°N) 经度/(°E) 震级MS 最大余震
震级MS最大余震与主震
时间间隔/d主震与最大
余震震级差主震与最大
余震的震中距/km震中位置 1 1970-01-14 37.30 114.88 3.6 3.2 54.0 0.4 3.3 河北隆尧 2 1970-06-05 37.55 114.57 3.6 2.1 0.1 1.5 0.9 河北临城 3 1971-02-15 37.63 115.07 3.6 3.1 29.0 0.5 24.7 河北宁晋 4 1971-02-22 36.50 113.75 3.6 2.3 1.0 1.3 25.4 河北涉县 5 1971-12-27 38.42 114.42 4.6 2.7 0.0 1.9 0.0 河北行唐 6 1972-09-07 37.30 114.82 4.1 3.2 91.0 0.9 24.4 河北隆尧 7 1974-06-06 37.60 115.13 4.4 3.8 42.0 0.6 19.0 河北宁晋 8 1974-07-18 37.43 115.15 3.8 2.0 6.0 1.8 26.6 河北新河 9 1974-10-03 39.68 118.77 3.8 2.2 0.0 1.6 0.0 河北滦县 10 1976-07-28 39.63 118.18 7.8 7.1 0.6 0.7 46.9 河北唐山 11 1977-10-14 36.82 114.32 3.7 2.2 11.0 1.5 9.7 河北武安 12 1978-05-19 40.50 116.57 4.0 2.6 6.0 1.4 4.8 北京怀柔 13 1980-03-28 40.10 119.40 4.0 3.8 7.0 0.2 14.6 河北青龙满族自治县 14 1981-02-08 39.70 118.78 4.2 3.9 35.0 0.3 51.5 河北昌黎 15 1981-11-09 37.43 114.97 5.8 4.3 78.0 1.5 9.5 河北隆尧 16 1981-12-06 36.87 114.07 4.1 3.0 27.0 1.1 21.6 河北武安 17 1982-01-26 37.40 114.87 4.3 2.7 52.0 1.6 14.9 河北隆尧 18 1982-03-08 39.87 118.67 4.4 3.7 22.0 0.7 16.4 河北迁安 19 1982-05-29 36.58 114.57 4.3 2.7 3.0 1.6 22.3 河北邯郸 20 1982-10-19 39.88 118.98 4.9 2.6 0.0 2.3 1.1 河北卢龙 21 1982-12-10 40.47 116.55 4.4 3.1 0.0 1.3 2.1 北京怀柔 22 1983-10-05 39.85 118.90 4.2 2.7 10.0 1.5 18.9 河北卢龙 23 1984-01-07 39.72 118.75 4.8 3.4 64.0 1.4 34.1 河北滦县 24 1985-01-26 37.37 114.77 3.7 2.9 89.0 0.8 11.1 河北隆尧 25 1985-05-22 39.83 118.53 4.2 2.6 0.2 1.6 6.7 河北滦县 26 1985-10-05 39.78 118.45 4.6 2.7 8.0 1.9 55.4 河北唐山 27 1985-11-21 40.08 115.83 4.2 2.9 0.0 1.3 2.8 北京门头沟 28 1986-01-11 37.43 114.90 3.6 2.4 29.0 1.2 35.9 河北隆尧 29 1986-02-15 37.75 115.23 4.3 4.0 3.0 0.3 7.1 河北辛集 30 1986-12-16 37.27 114.75 3.7 2.6 7.0 1.1 3.7 河北隆尧 31 1987-06-07 39.53 118.08 4.0 3.2 33.0 0.6 48.2 河北丰南 32 1987-07-16 39.78 118.63 4.0 3.1 13.0 0.9 26.8 河北滦县 33 1988-10-26 39.87 118.48 3.8 3.0 78.0 0.8 25.7 河北迁安 34 1989-06-18 39.67 118.32 3.8 2.3 1.0 1.5 0.8 河北唐山 35 1989-07-23 37.37 115.03 3.8 2.9 80.0 0.9 5.3 河北巨鹿 36 1989-10-05 39.62 118.25 3.7 2.0 1.0 1.7 2.1 河北唐山 37 1989-12-14 37.60 115.28 4.3 2.7 68.0 1.6 32.1 河北冀县 38 1990-08-03 37.88 115.03 3.7 2.3 58.0 1.4 41.3 河北晋县 39 1991-05-07 39.80 118.70 3.8 2.9 0.0 0.9 5.9 河北滦县 40 1991-07-11 39.68 118.38 3.8 2.6 2.0 1.2 3.3 河北唐山 41 1991-07-27 39.85 118.80 3.9 2.3 10.0 1.6 14.9 河北滦县 42 1991-10-07 37.93 115.07 3.6 2.4 1.0 1.2 3.7 河北晋县 43 1991-10-17 39.73 118.42 3.8 3.3 79.0 0.5 5.6 河北唐山 44 1994-12-23 40.47 115.55 3.8 1.9 0.0 1.9 0.0 河北怀来 45 1995-07-20 40.27 115.43 3.6 2.9 1.0 0.7 3.5 河北涿鹿 46 1998-01-10 41.10 114.30 6.2 4.1 0.1 2.1 17.1 河北张北 47 1998-04-14 39.68 118.47 4.6 3.9 0.0 0.7 0.0 河北滦县 48 1999-05-12 40.18 118.78 3.7 3.1 74.0 0.6 50.5 河北迁安 49 1999-11-29 41.17 114.57 3.6 2.7 7.0 0.9 0.8 河北张北 50 2000-04-10 41.12 114.52 3.8 2.7 68.0 1.1 7.4 河北张北 51 2000-06-25 39.82 118.33 3.9 2.9 11.0 1.0 14.2 河北滦县 52 2001-12-28 39.75 118.68 3.7 2.0 17.0 1.7 16.9 河北滦县 53 2002-12-25 37.60 115.10 3.7 3.3 25.0 0.4 3.5 河北宁晋 54 2003-11-15 39.70 118.80 3.6 2.2 35.0 1.4 8.2 河北昌黎 55 2004-01-20 39.73 118.78 4.6 3.3 53.0 1.3 38.6 河北昌黎 56 2008-03-11 39.98 118.90 3.9 2.0 0.0 1.9 1.6 河北卢龙 57 2010-03-06 39.70 118.50 4.3 3.0 0.3 1.3 0.0 河北滦县 58 2010-04-09 39.47 118.07 4.1 2.4 0.1 1.7 1.1 河北丰南 59 2012-05-28 39.72 118.47 4.7 3.1 0.3 1.6 6.8 河北唐山 60 2012-06-18 39.62 117.57 4.0 3.4 69.0 1.6 11.9 天津宝坻 61 2015-09-14 39.73 118.82 4.2 3.3 0.0 0.9 1.8 河北昌黎 62 2016-09-10 39.68 118.33 4.1 2.8 25.0 1.3 2.8 河北开平 63 2017-09-04 37.50 114.35 3.8 2.0 0.0 1.8 6.6 河北临城 64 2021-04-16 39.75 118.72 4.3 2.9 69.0 1.4 9.2 河北滦州 65 2021-06-22 41.17 114.40 3.9 2.4 0.3 1.5 0.0 河北张北 66 2022-12-04 39.90 118.88 3.7 2.2 0.4 1.5 2.2 河北卢龙  下载: 导出CSV
表 2 河北及邻区MS≥3.5多震型地震(1970—2022)
Table 2. Multiple mainshock earthquakes of MS≥3.5 in Hebei and its surrounding regions (1970—2022)
序号 发震时间
(年-月-日)纬度/(°N) 经度/(°E) 震级MS 最大余震
震级MS最大余震与
主震时间间隔/d主震与最大
余震震级差主震与最大余震的
震中距/km震中位置 1 1970-06-25 37.17 114.82 3.6 3.6 0.04 0 0 河北任县 2 1972-08-24 40.47 115.42 3.6 3.1 39.0 0.5 15.1 河北怀来 3 1980-08-07 37.52 114.42 3.8 3.6 0.04 0.2 7.9 河北赞皇 4 1981-09-06 40.32 115.85 3.9 3.3 1.0 0.6 3.4 河北怀来 5 1981-09-19 39.80 118.73 3.6 3.3 15.0 0.3 45.4 河北滦县 6 1982-01-27 39.75 118.77 3.9 4.4 40.0 0.5 15.6 河北昌黎 7 1983-01-31 37.43 115.02 3.6 4.0 6.0 0.4 11.5 河北宁晋 8 1983-08-21 39.72 118.32 3.6 3.0 0.42 0.6 4.2 河北唐山 9 1983-09-15 37.52 114.27 3.6 3.1 1.0 0.5 25.5 河北赞皇 10 1984-02-27 39.43 118.02 3.8 3.4 13.0 0.4 37.3 河北丰南 11 1984-12-13 39.65 118.22 3.6 3.3 31.0 0.3 21.0 河北唐山 12 1985-04-22 39.72 118.77 4.6 4.2 0.3 0.4 3.4 河北昌黎 13 1987-08-08 39.33 117.88 4.2 3.6 0.4 0.6 1.7 天津宁河 14 1988-07-25 39.52 118.10 3.9 4.4 1.0 0.5 5.5 河北丰南 15 1988-07-30 39.77 118.72 3.8 4.1 4.0 0.3 19.8 河北滦县 16 1990-03-16 39.77 118.45 3.7 3.2 35.0 0.5 7.8 河北唐山 17 1991-05-29 39.72 118.30 4.8 5.2 1.0 0.4 5.1 河北唐山 18 1991-08-21 37.33 114.70 3.8 3.6 1.0 0.2 15.8 河北隆尧 19 1996-12-16 40.17 116.50 4.0 3.4 0.2 0.6 10.3 北京顺义 20 2002-08-03 40.48 115.53 3.9 3.3 0.3 0.6 1.4 河北沙城 21 2003-04-23 39.33 117.63 3.6 3.8 0.2 0.2 2.9 天津宁河 22 2003-05-22 39.73 118.43 3.6 3.2 30.0 0.4 8.6 河北唐山 23 2006-05-03 39.77 118.45 3.6 3.8 0.01 0.2 0 河北唐山 24 2019-12-03 40.43 114.55 3.6 3.1 0.01 0.5 0 河北怀安
下载: 导出CSV
表 3 河北及邻区MS≥3.5孤立型地震(1970—2022)
Table 3. Isolated earthquakes of MS≥3.5 in Hebei and its surrounding regions (1970—2022)
序号 发震时间(年-月-日) 纬度/(°N) 经度/(°E) 震级MS 震中位置 1 1970-05-25 39.55 118.12 4.2 河北丰南 2 1971-08-05 38.37 114.52 4.3 河北行唐 3 1972-03-25 40.43 116.60 4.5 北京怀柔 4 1972-10-12 36.97 114.32 4.8 河北沙河 5 1973-05-13 39.63 117.37 3.8 天津宝坻 6 1973-09-21 39.05 116.33 4.5 河北霸州 7 1973-12-31 38.47 116.55 5.3 河北河间 8 1975-12-01 39.25 118.00 3.7 天津滨海新区 9 1976-04-22 38.68 116.67 4.3 河北大城 10 1977-02-04 39.97 117.13 4.0 河北三河 11 1977-03-10 36.30 114.30 4.0 河北磁县 12 1978-10-03 40.17 116.50 4.0 北京顺义 13 1979-05-31 40.20 119.13 3.7 河北青龙满族自治县 14 1980-11-05 39.32 116.78 3.6 河北廊坊 15 1980-11-10 40.65 115.63 3.7 河北赤城 16 1981-07-24 39.72 118.35 4.0 河北唐山 17 1981-08-03 39.50 117.90 3.8 天津宁河 18 1981-08-25 40.55 115.00 4.2 河北宣化 19 1981-10-16 39.30 117.85 3.6 天津滨海新区 20 1983-04-03 40.75 114.78 4.7 河北万全 21 1983-07-21 40.82 114.70 3.9 河北万全 22 1983-08-08 40.67 115.38 3.6 河北张家口 23 1983-08-26 39.80 117.22 3.8 天津宝坻 24 1985-10-17 39.28 114.65 3.6 河北涞源 25 1985-11-30 37.23 114.82 5.2 河北任县 26 1986-11-10 40.05 116.72 4.2 北京顺义 27 1987-03-21 38.28 114.25 4.0 河北平山 28 1987-11-11 40.28 114.80 4.2 河北宣化 29 1988-05-09 39.30 118.10 3.7 河北丰南 30 1988-07-23 40.08 114.22 4.6 河北阳原 31 1989-12-25 40.33 118.95 4.2 河北青龙 32 1990-05-23 40.22 116.47 3.8 北京昌平 33 1990-07-21 40.58 115.83 4.6 北京延庆 34 1990-07-23 39.75 118.48 4.5 河北唐山 35 1990-09-22 40.08 116.37 4.0 北京昌平 36 1990-12-24 37.90 115.02 3.6 河北晋县 37 1991-08-22 37.47 114.73 3.6 河北柏乡 38 1992-02-14 39.77 118.43 3.9 河北唐山 39 1992-07-22 39.28 117.93 4.5 天津滨海新区 40 1993-11-18 39.60 117.45 3.9 天津宝坻 41 1995-10-06 39.67 118.33 5.0 河北唐山 42 1997-05-25 40.70 114.87 4.2 河北宣化 43 2001-03-02 40.37 114.92 4.2 河北宣化 44 2001-07-16 38.32 116.47 3.8 河北沧县 45 2002-04-22 37.27 114.42 5.0 河北隆尧 46 2002-05-19 39.37 117.98 4.2 河北丰南 47 2006-07-04 38.90 116.28 5.1 河北文安 48 2014-09-06 40.27 115.42 4.3 河北涿鹿 49 2016-06-23 40.97 114.18 4.0 河北尚义 50 2017-01-02 40.77 114.15 3.6 河北怀安 51 2018-02-12 39.37 116.67 4.2 河北永清 52 2019-04-21 36.33 114.43 3.7 河北临漳 53 2019-12-5 39.31 118.04 4.5 河北丰南 54 2020-07-12 39.78 118.43 5.1 河北古冶 55 2021-07-15 37.57 115.08 3.6 河北宁晋 56 2022-02-06 36.97 115.43 3.6 河北威县 57 2022-05-21 39.97 119.00 3.6 河北卢龙 58 2022-10-03 38.37 113.73 4.3 河北平山
下载: 导出CSV
表 4 河北及邻区不同类型地震统计结果(1970—2022)
Table 4. Statistical results of different sequence types of earthquakes in Hebei and its surrounding regions (1970—2022)
序号 震级分档MS 主余型地震次数(占比) 多震型地震次数(占比) 孤立型地震次数(占比) 总次数 1 3.5~3.9 33(44%) 20(26%) 23(30%) 76 2 4.0~4.9 30(48%) 4(6%) 29(46%) 63 3 5.0~5.9 1(14%) 0(0) 6(86%) 7 4 6.0~6.9 1(100%) 0(0) 0(0) 1 5 7.0~7.9 1(100%) 0(0) 0(0) 1
下载: 导出CSV
表 5 河北及邻区各分区地震类型统计结果
Table 5. Statistical results of different sequence types of earthquakes in each partition of Hebei and its surrounding regions
区域 震级分档MS 主余型次数(占比) 多震型次数(占比) 孤立型次数(占比) 总次数 张家口区(Ⅰ) 3.5~4.9 5(42%) 3(25%) 4(33%) 12 4.0~4.9 0(0) 0(0) 9(100%) 9 5.0~5.9 0(0) 0(0) 0(0) 0(0) 6.0~6.9 1(100%) 0(0) 0(0) 1 7.0~7.9 0(0) 0(0) 0(0) 0(0) 北京区(Ⅱ) 3.5~4.9 0(0) 1(17%) 5(83%) 6 4.0~4.9 4(36%) 1(9%) 6(55%) 11 5.0~5.9 0(0) 0(0) 0(0) 0(0) 6.0~6.9 0(0) 0(0) 0(0) 0(0) 7.0~7.9 0(0) 0(0) 0(0) 0(0) 津唐区(Ⅲ) 3.5~4.9 14(44%) 11(34%) 7(22%) 32 4.0~4.9 18(64%) 3(11%) 7(25%) 28 5.0~5.9 0(0) 0(0) 2(100%) 2 6.0~6.9 0(0) 0(0) 0(0) 0(0) 7.0~7.9 1(100%) 0(0) 0(0) 1 冀中区(Ⅳ) 3.5~4.9 0(0) 0(0) 2(100%) 2 4.0~4.9 0(0) 0(0) 2(100%) 2 5.0~5.9 0(0) 0(0) 2(100%) 2 6.0~6.9 0(0) 0(0) 0(0) 0(0) 7.0~7.9 0(0) 0(0) 0(0) 0(0) 冀西区(Ⅴ) 3.5~4.9 0(0) 0(0) 0(0) 0(0) 4.0~4.9 1(25%) 0(0) 3(75%) 4 5.0~5.9 0(0) 0(0) 0(0) 0(0) 6.0~6.9 0(0) 0(0) 0(0) 0(0) 7.0~7.9 0(0) 0(0) 0(0) 0(0) 冀南区(Ⅵ) 3.5~4.9 14(58%) 5(21%) 5(21%) 24 4.0~4.9 7(78%) 0(0) 2(22%) 9 5.0~5.9 1(33%) 0(0) 2(67%) 3 6.0~6.9 0(0) 0(0) 0(0) 0(0) 7.0~7.9 0(0) 0(0) 0(0) 0(0)
下载: 导出CSV
表 6 河北及邻区MS≥5.0主余型地震(1970—2022)
Table 6. Mainshock-aftershock earthquake types of MS≥5.0 in Hebei and its surrounding regions (1970—2022)
序号 发震时间(年-月-日) 纬度/(°N) 经度/(°E) 震级MS 发震位置 最大余震震级MS 1 1976-07-28 39.63 118.18 7.8 河北唐山 7.1 2 1981-11-09 37.43 114.97 5.8 河北隆尧 4.3 3 1998-01-10 41.10 114.30 6.2 河北张北 4.1
下载: 导出CSV
表 7 研究震例的最大余震震级计算参数及结果
Table 7. Aftershock magnitude calculation parameters and results of studied earthquakes
序号 发震时间(年-月-日) 震级MS 发震位置 c q k MS(63%) MS(10%) MS(2%) 实际最大余震MS 1 1976-07-28 7.8 河北唐山 0.5833 0.0694 7.6556 5.6 6.3 6.8 7.1 2 1981-11-09 5.8 河北隆尧 1.1550 0.1750 8.46 3.9 4.4 4.8 4.3 3 1998-01-10 6.2 河北张北 2.6972 0.4026 9.8089 3.6 4.1 4.4 4.1
下载: 导出CSV
-
毕金孟,蒋长胜,曹付阳,2023. 震后早期阶段余震预测研究进展. 地球与行星物理论评(中英文),54(5):498−511.Bi J. M., Jiang C. S., Cao F. Y., 2023. Research progress of aftershock forecasting in the early stage after the mainshock. Reviews of Geophysics and Planetary Physics, 54(5): 498−511. (in Chinese) 崔效锋,谢富仁,李瑞莎等,2010. 华北地区构造应力场非均匀特征与煤田深部应力状态. 岩石力学与工程学报,29(S1):2755−2761.Cui X. F., Xie F. R., Li R. S., et al., 2010. Heterogeneous features of state of tectonic stress filed in North China and deep stress in coal mine. Chinese Journal of Rock Mechanics and Engineering, 29(S1): 2755−2761. (in Chinese) 国家地震局预测预防司,1997. 测震学分析预报方法. 北京:地震出版社,152−153. 郭蕾,孙丽娜,周依等,2021. 唐山地区近十年地震的重定位研究. 地震学报,43(6):706−715.Guo L., Sun L. N., Zhou Y., et al., 2021. Relocation of earthquakes in Tangshan area in the recent decade. Acta Seismologica Sinica, 43(6): 706−715. (in Chinese) 蒋海昆,李永莉,曲延军等,2006. 中国大陆中强地震序列类型的空间分布特征. 地震学报,28(4):389−398. doi: 10.3321/j.issn:0253-3782.2006.04.006Jiang H. K., Li Y. L., Qu Y. J., et al., 2006. Spatial distribution features of sequence types of moderate and strong earthquakes in Chinese mainland. Acta Seismologica Sinica, 28(4): 389−398. (in Chinese) doi: 10.3321/j.issn:0253-3782.2006.04.006 蒋海昆,王锦红,2023. 适用于机器学习的地震序列类型判定特征重要性讨论. 地震研究,46(2):155−172.Jiang H. K., Wang J. H., 2023. Discussion on the importance of the features for the judgement of earthquake sequence types applicable to machine learning. Journal of Seismological Research, 46(2): 155−172. (in Chinese) 宋美琴,李斌,吕芳等,2011. 山西及周边地区地震类型分区特征. 地震学报,33(5):691−696. doi: 10.3969/j.issn.0253-3782.2011.05.013Song M. Q., Li B., Lü F., et al., 2011. A study on sub-region division of earthquake types in Shanxi and its surrounding regions. Acta Seismologica Sinica, 33(5): 691−696. (in Chinese) doi: 10.3969/j.issn.0253-3782.2011.05.013 王华林,周翠英,耿杰,1997. 中国大陆及邻区地震序列类型的分区特征和震源环境讨论. 地震,17(1):34−42.Wang H. L., Zhou C. Y., Geng J., 1997. Discussion on zoning features of earthquake sequence type and source environment in Chinese mainland and its adjacent area. Earthquake, 17(1): 34−42. (in Chinese) 吴开统,1971. 地震序列的基本类型及其在地震预报中的应用. 地震站线,7(11):45−51. 许晓庆,盛菊琴,马禾青,2016. 中国西北地区东部地震序列参数与预测余震发生的关系分析. 地震工程学报,38(4):598−605. doi: 10.3969/j.issn.1000-0844.2016.04.0598Xu X. Q., Sheng J. Q., Ma H. Q., 2016. Relation between earthquake sequence parameters and the prediction of aftershocks in the eastern part of northwest China. China Earthquake Engineering Journal, 38(4): 598−605. (in Chinese) doi: 10.3969/j.issn.1000-0844.2016.04.0598 叶友清,苏金蓉,易桂喜等,2019. 利用震级均值特性建立有上限震级概率模型对2017年九寨沟7.0级地震的余震概率预测. 地球物理学进展,34(2):489−499. doi: 10.6038/pg2019CC0089Ye Y. Q., Su J. R., Yi G. X., et al., 2019. Probabilistic prediction for the earthquake sequence of 2017 Jiuzhaigou, Sichuan, M S7.0 by using limited-magnitude probability distribution based on the average magnitudes of aftershock sequence. Progress in Geophysics, 34(2): 489−499. (in Chinese) doi: 10.6038/pg2019CC0089 周翠英,侯海峰,华爱军等,2001. 山东及其近海区地震序列类型地理分布特征. 华北地震科学,19(3):15−27. doi: 10.3969/j.issn.1003-1375.2001.03.002Zhou C. Y., Hou H. F., Hua A. J., et al., 2001. The geographic distribution feature of earthquake sequence type in Shandong and its offshore area. North China Earthquake Sciences, 19(3): 15−27. (in Chinese) doi: 10.3969/j.issn.1003-1375.2001.03.002 Ogata Y., 1989. Statistical model for standard seismicity and detection of anomalies by residual analysis. Tectonophysics, 169(1-3): 159−174. doi: 10.1016/0040-1951(89)90191-1 Page M. T., van der Elst N., Hardebeck J., et al., 2016. Three ingredients for improved global aftershock forecasts: tectonic region, time-dependent catalog incompleteness, and intersequence variability. Bulletin of the Seismological Society of America, 106(5): 2290−2301. doi: 10.1785/0120160073 Reasenberg P. A., Jones L. M., 1989. Earthquake hazard after a mainshock in California. Science, 243(4895): 1173−1176. doi: 10.1126/science.243.4895.1173 -

 点击查看大图

计量
- 文章访问数: 394
- HTML全文浏览量: 158
- PDF下载量: 44
- 被引次数: 0
