Applicability of VS30 Estimation Models for the Beijing Plain Area
-
摘要: 本文使用基于钻孔测井数据的3类模型,即常速度外推模型、速度梯度模型、双深度参数外推模型,通过对北京地区460个深度超过30m的钻孔剪切波速资料进行分析,详细探究了VS30估算模型在本研究区的适用性。研究结果表明双深度参数外推模型在估算VS30上准确度很高,其不需要大量的数据进行回归分析,且不具有区域独立性,可以为全球包括北京地区场地类别划分提供依据,进而在震害快速评估中用于确定场地影响,是一种值得推广的估算模型。Abstract: Using three models i.e. bottom-layer constant velocity model, velocity gradient model and the extrapolation model with the travel-time averaged shear-wave velocities at two different depths, we investigated the data from 460 boreholes in Beijing plain area in which the shear-wave velocity profile reaches over 30m. Through the detailed research, we found that the last method can estimate VS30 with high accuracy, which does not need any regression analysis to derive empirical relations from a large number of data. Meanwhile, this method is not regionally dependent, and has a remarkable improvement in the accuracy. Therefore, it is potentially useful for many parts of the world including Beijing. It provides a basis for site classification, and then can extend the application to evaluation of site effect in a rapid assessment of earthquake damage, thus being worth to be extensively applied.
-
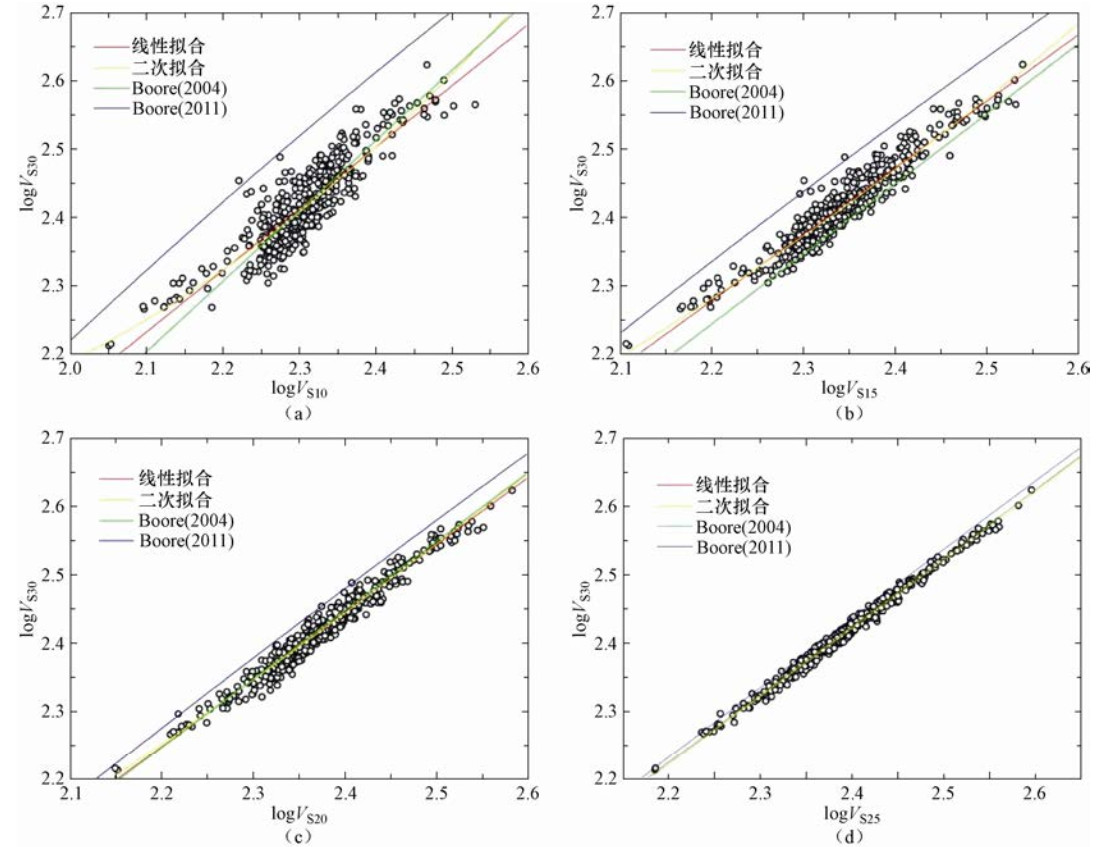
图 5 不同深度下北京平原及Boore(2004)加州和Boore等(2011)日本地区数据回归分析图
Figure 5. Regression analysis based on the data of Beijing plain area, California (Boore, 2004) and Japan (Boore et al., 2011) at different depths
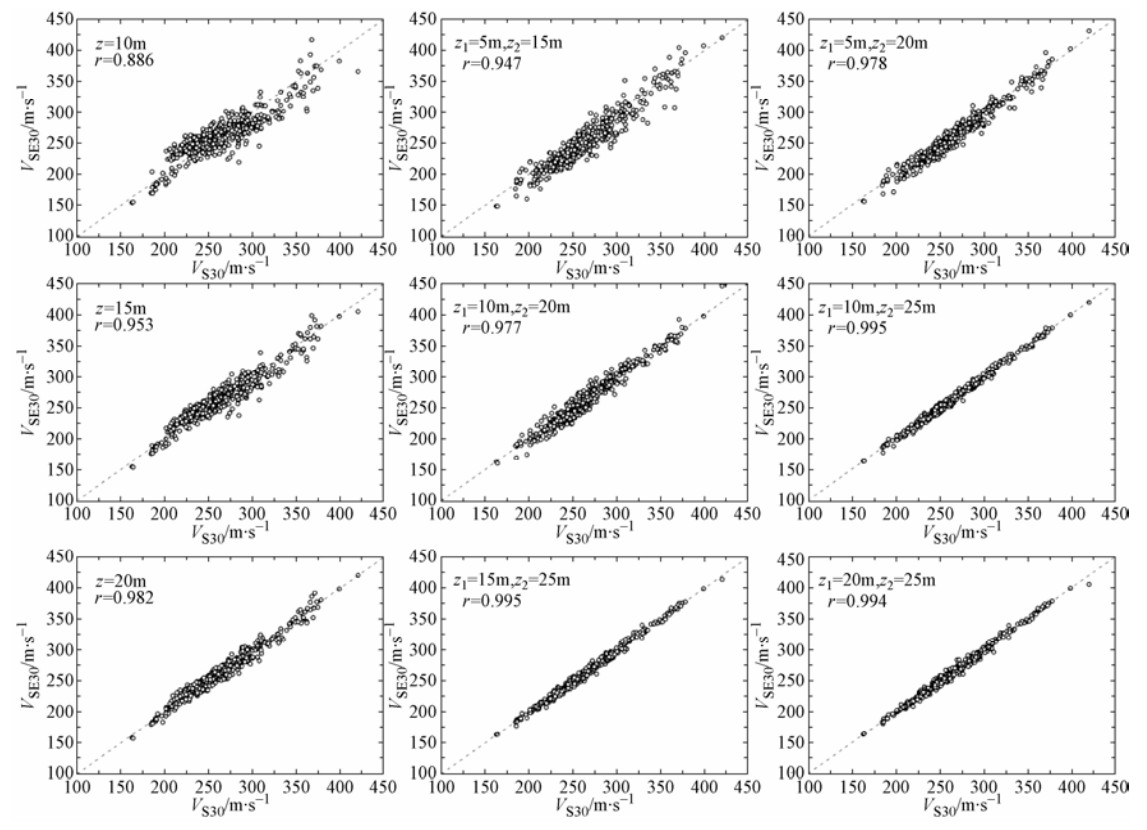
图 6 速度梯度模型线性回归分析(左图)及Wang等(2015)模型(中及右图)得出的VS30和VSE30对比图
Figure 6. Correlations between VS30 and VSE30 using method of velocity gradient linear regression model (left column) and Wang et al. (2015) method (middle and right column), respectively
表 1 BCV法VSE30与VS30的相关系数及残差标准差
Table 1. List of parameters (and defective standard deviation r and σRES) of VSE30 and VS30 for BCV
深度/m r σRES 6 0.830 0.104 7 0.860 0.089 8 0.877 0.080 9 0.901 0.069 10 0.903 0.064 11 0.920 0.053 12 0.917 0.046 13 0.924 0.039 14 0.931 0.035 15 0.945 0.029 16 0.950 0.027 17 0.957 0.025 18 0.963 0.022 19 0.972 0.020 20 0.978 0.018 21 0.982 0.016 22 0.986 0.014 23 0.991 0.011 24 0.994 0.009 25 0.996 0.006 26 0.998 0.005 27 0.999 0.003 28 1.000 0.002 29 1.000 0.001 表 2 基于公式(4)的线性回归模型的回归系数
Table 2. List of coefficients a0, a1, r and σRES of equation (4) based on Linear Regression Model
深度/m a0 a1 r σRES 5 0.847 0.696 0.728 0.045 6 0.680 0.766 0.776 0.041 7 0.562 0.814 0.812 0.038 8 0.478 0.847 0.840 0.035 9 0.399 0.878 0.867 0.033 10 0.340 0.901 0.886 0.030 11 0.290 0.919 0.904 0.028 12 0.242 0.937 0.919 0.026 13 0.196 0.954 0.931 0.024 14 0.161 0.966 0.943 0.022 15 0.133 0.975 0.953 0.020 16 0.118 0.978 0.960 0.018 17 0.108 0.980 0.967 0.017 18 0.100 0.981 0.973 0.015 19 0.089 0.983 0.977 0.014 20 0.074 0.988 0.982 0.012 21 0.060 0.991 0.985 0.011 22 0.050 0.994 0.988 0.010 23 0.042 0.995 0.991 0.009 24 0.034 0.997 0.993 0.008 25 0.028 0.998 0.995 0.006 26 0.023 0.998 0.997 0.005 27 0.017 0.998 0.998 0.004 28 0.011 0.999 0.999 0.003 29 0.005 1.000 1.000 0.001 表 3 基于公式(5)的二次回归模型的回归系数
Table 3. List of coefficients b0, b1, b2, r and σRES of equation (5) based on Quadratic Regression Model
深度/m b0 b1 b2 r σRES 5 3.487 -1.672 0.530 0.734 0.044 6 4.280 -2.442 0.714 0.783 0.041 7 4.603 -2.763 0.791 0.820 0.037 8 4.344 -2.553 0.747 0.846 0.035 9 3.876 -2.162 0.664 0.871 0.032 10 3.357 -1.724 0.570 0.890 0.030 11 2.850 -1.297 0.479 0.906 0.028 12 2.403 -0.926 0.401 0.920 0.026 13 2.079 -0.663 0.347 0.932 0.024 14 1.868 -0.496 0.312 0.943 0.022 15 1.768 -0.420 0.297 0.953 0.020 16 1.682 -0.352 0.283 0.961 0.018 17 1.567 -0.258 0.262 0.967 0.017 18 1.451 -0.162 0.241 0.973 0.015 19 1.246 0.007 0.206 0.978 0.014 20 0.949 0.251 0.155 0.982 0.012 21 0.670 0.480 0.107 0.985 0.011 22 0.477 0.636 0.075 0.988 0.010 23 0.338 0.747 0.052 0.991 0.009 24 0.191 0.866 0.027 0.993 0.008 25 0.081 0.953 0.009 0.995 0.006 26 -0.013 1.027 -0.006 0.997 0.005 27 -0.031 1.038 -0.008 0.998 0.004 28 -0.032 1.035 -0.007 0.999 0.003 29 -0.003 1.006 -0.001 1.000 0.001 表 4 Wang等(2015)计算的VSE30和VS30相关性及残差标准差
Table 4. List of coefficients and defective standard deviation r and σRES of VSE30 and VS30 from Wang et al. (2015)
(z1,z2) r σRES (5,10) 0.876 0.052 (5,15) 0.947 0.03 (5,20) 0.978 0.018 (5,25) 0.995 0.009 (10,15) 0.943 0.025 (10,20) 0.977 0.016 (10,25) 0.995 0.008 (15,20) 0.975 0.016 (15,25) 0.995 0.007 (20,25) 0.994 0.008 -
薄景山, 李秀领, 李山有, 2003a. 场地条件对地震动影响研究的若干进展. 世界地震工程, 19(2): 11-15. http://d.wanfangdata.com.cn/Periodical_sjdzgc200302002.aspx 薄景山, 李秀领, 刘德东等, 2003b.土层结构对反应谱特征周期的影响.地震工程与工程振动, 23(5):42-45. http://industry.wanfangdata.com.cn/dl/Detail/Periodical?id=Periodical_dzgcygczd200305007 陈鲲, 俞言祥, 高孟潭, 2010.考虑场地效应的ShakeMap系统研究.中国地震, 26(1):92-102. http://www.cnki.com.cn/Article/CJFDTotal-ZGZD201001010.htm 胡聿贤, 孙平善, 章在墉等, 1980.场地条件对震害和地震动的影响.地震工程与工程振动, (试刊):34-41. http://kns.cnki.net/KCMS/detail/detail.aspx?filename=dggc198000005&dbname=CJFD&dbcode=CJFQ 黄雅虹, 吕悦军, 彭艳菊, 2009.国内外不同抗震设计规范中场地分类方法的内在关系研究.震灾防御技术, 4(1):80-90. doi: 10.11899/zzfy20090108 李小军, 彭青, 2001.不同类别场地地震动参数的计算分析.地震工程与工程振动, 21(1):29-36. http://www.cqvip.com/Main/Detail.aspx?id=4983229 李小军, 2006.工程场地地震安全性评价工作及相关技术问题.震灾防御技术, 1(1):15-24. doi: 10.11899/zzfy20060103 吕悦军, 彭艳菊, 兰景岩等, 2008.场地条件对地震动参数影响的关键问题.震灾防御技术, 3(2):126-135. doi: 10.11899/zzfy20080203 彭艳菊, 吕悦军, 黄雅虹等, 2009.工程地震中的场地分类方法及适用性评述.地震地质, 31(2):349-362. http://www.docin.com/p-726119991.html 喻畑, 李小军, 2015.四川、甘肃地区VS30经验估计研究.地震工程学报, 37(2):525-533. http://www.wanfangdata.com.cn/details/detail.do?_type=perio&id=xbdzxb201502042 中华人民共和国住房和城乡建设部, 中华人民共和国国家质量监督检验检疫总局, 2010. GB50011-2010建筑抗震设计规范. 北京: 中国建筑工业出版社. Abrahamson N., Silva W., 2008. Summary of the abrahamson & silva NGA ground-motion relations. Earthquake Spectra, 24(1):67-98. doi: 10.1193/1.2924360 American Society of Civil Engineers (ASCE), 2010. Standards ASCE/SEI 7-10 Minimum design loads for buildings and other structures. Reston, Virginia:ASCE, 650. Boore D. M., 2004. Estimating VS (30) (or NEHRP site classes) from shallow velocity models (Depth < 30 m). Bulletin of the Seismological Society of America, 94(2):591-597. doi: 10.1785/0120030105 Boore D. M., Atkinson G. M., 2008. Ground-motion prediction equations for the average horizontal component of PGA, PGV, and 5%-Damped PSA at spectral periods between 0.01 s and 10.0 s. Earthquake Spectra, 24(1):99-138. doi: 10.1193/1.2830434 Boore D. M., Thompson E. M., Cadet H., 2011. Regional correlations of VS30 and Velocities averaged over depths less than and greater than 30 meters. Bulletin of the Seismological Society of America, 101(6):3046-3059. doi: 10.1785/0120110071 Borcherdt R. D., 1994. Estimates of site-dependent response spectra for design (methodology and justification). Earthquake Spectra, 10(4):617-653. doi: 10.1193/1.1585791 Building Seismic Safety Council, 2003. Recommended provisions for seismic regulations for new buildings and other structures, Part 1: Provisions. Report No. FEMA-450, Federal Emergency Management Agency, Washington, D. C., 303pp. Campbell K. W., Bozorgnia Y., 2008. NGA ground motion model for the geometric mean horizontal component of PGA, PGV, PGD and 5% damped linear elastic response spectra for periods ranging from 0.01 to 10 s. Earthquake Spectra, 24(1):139-171. doi: 10.1193/1.2857546 Chiou B. S. J., Youngs R. R., 2008. An NGA model for the average horizontal component of peak ground motion and response spectra. Earthquake Spectra, 24(1):173-215. doi: 10.1193/1.2894832 Eurocode 8, 2004. Design of structures for earthquake resistance, part 1: General rules, seismic actions and rules for buildings, EN 1998-1, European Committee for Standardization (CEN), http://www.cen.eu/cenorm/homepage.htm (last accessed July 2011). Idriss I. M., 2008. An NGA empirical model for estimating the horizontal spectral values generated by shallow crustal earthquakes. Earthquake Spectra, 24(1):217-242. doi: 10.1193/1.2924362 Kuo C. H., Wen K. L., Hsieh H. H., et al., 2011. Evaluating empirical regression equations for VS and estimating VS30 in northeastern Taiwan. Soil Dynamics and Earthquake Engineering, 31(3):431-439. doi: 10.1016/j.soildyn.2010.09.012 Wald D. J., Allen T. I., 2007. Topographic Slope as a proxy for seismic site conditions and amplification. Bulletin of the Seismological Society of America, 97(5):1379-1395. doi: 10.1785/0120060267 Wang H. Y., Wang S. Y., 2015. A new method for estimating VS(30) from a shallow shear-wave velocity profile (depth < 30 m). Bulletin of the Seismological Society of America, 105(3):1359-1370. doi: 10.1785/0120140103 Xie J. J., Zimmaro P., Li X. J., et al., 2016. VS30 empirical prediction relationships based on a new soil-profile database for the Beijing plain area, China. Bulletin of the Seismological Society of America, 106(6):2843-2854. doi: 10.1785/0120160053 -


 下载:
下载:
