
Characteristics and Site Influencing Factors of Strong Ground Motion in the Minxian-Zhangxian Earthquake
-
摘要: 岷漳地震强地震动加速度峰值较小,然而震害却相对严重,局部黄土场地震害及地震动放大效应显著。基于岷漳地震强地震动记录,开展幅值、频谱和持时三要素特征分析,探讨震中距、场地类别、土层条件等对地震动特征参数的影响规律,从地震动特征角度分析此次地震震害相对较重的原因及对震害的潜在影响。结果表明:(1)III类场地与I类场地相比,峰值加速度放大2.1~4.6倍,持时延长10~43 s,反应谱在周期0.18~0.86 s时,谱值较大;(2)黄土场地与非黄土场地相比,峰值加速度及峰值速度分别放大1.5~3.7倍和1.55~1.8倍,持时延长8~35 s,反应谱在周期大于0.32 s时,谱值明显较大,存在显著的黄土场地地震动放大效应;(3)设计地震分组为第二组的II类黄土场地,加速度反应谱的平均曲线、拟合曲线在周期0.8~3.0 s时与规范设计谱的谱值差大于20%。Abstract: Field investigations of the Minxian–Zhangxian Earthquake (MZE) indicated that the amplification effects of site conditions and topography on ground motion were highly pronounced in loess regions. A common question is why the relatively small peak ground acceleration (PGA) during the MZE caused comparatively severe damage in loess areas. Based on the strong-motion records of the MZE, this paper analyzes the amplitude, spectral, and duration characteristics of ground motion, and discusses the influence of propagation distance and site conditions on its characteristic parameters. From the perspective of ground-motion characteristics, the reasons for the relatively severe earthquake damage and their potential implications are examined. The results show that: (1) compared with Class I sites, the PGA at Class III sites increases by 2.1~4.6 times, the duration is prolonged by 10~43 s, and the response spectrum values are larger in the period range of 0.18~0.86 s; (2) compared with non-loess sites, the PGA at loess sites increases by 1.5~3.7 times, the peak ground velocity increases by 1.55~1.8 times, the duration is prolonged by 8~35 s, and the response spectrum values are significantly larger when the period exceeds 0.32 s, indicating a pronounced amplification effect of loess sites on ground motion; and (3) the pseudo-acceleration spectrum for design earthquake Group 2 and Site Class II is significantly larger than the Chinese design spectrum in the period range of 0.3~0.8 s.
-

图 1 岷漳6.6级地震烈度分布及死亡人员分布图
Figure 1. Distribution of seismic intensity and death casualty in the Minxian-Zhangxian MS6.6 earthquake
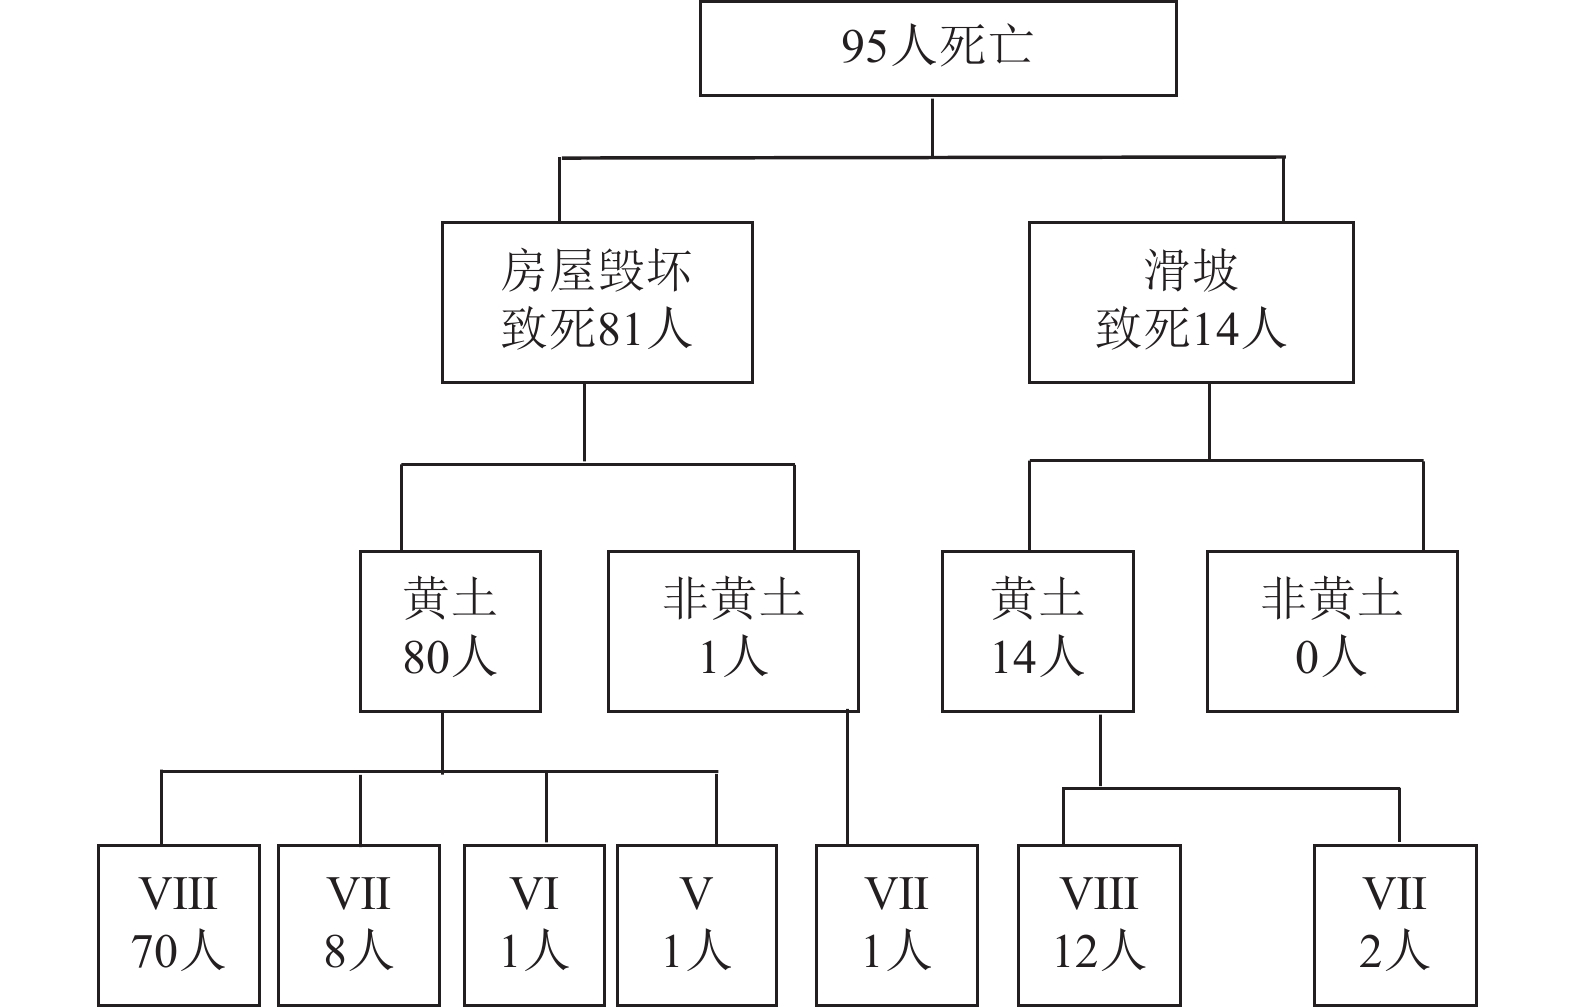
图 2 人员死亡原因及分布地区
Figure 2. Distribution of earthquake intensity and stations in Minxian-Zhangxian earthquake

图 3 选取的强地震动记录台站地理分布
Figure 3. Geographical distribution of strong motion recording stations
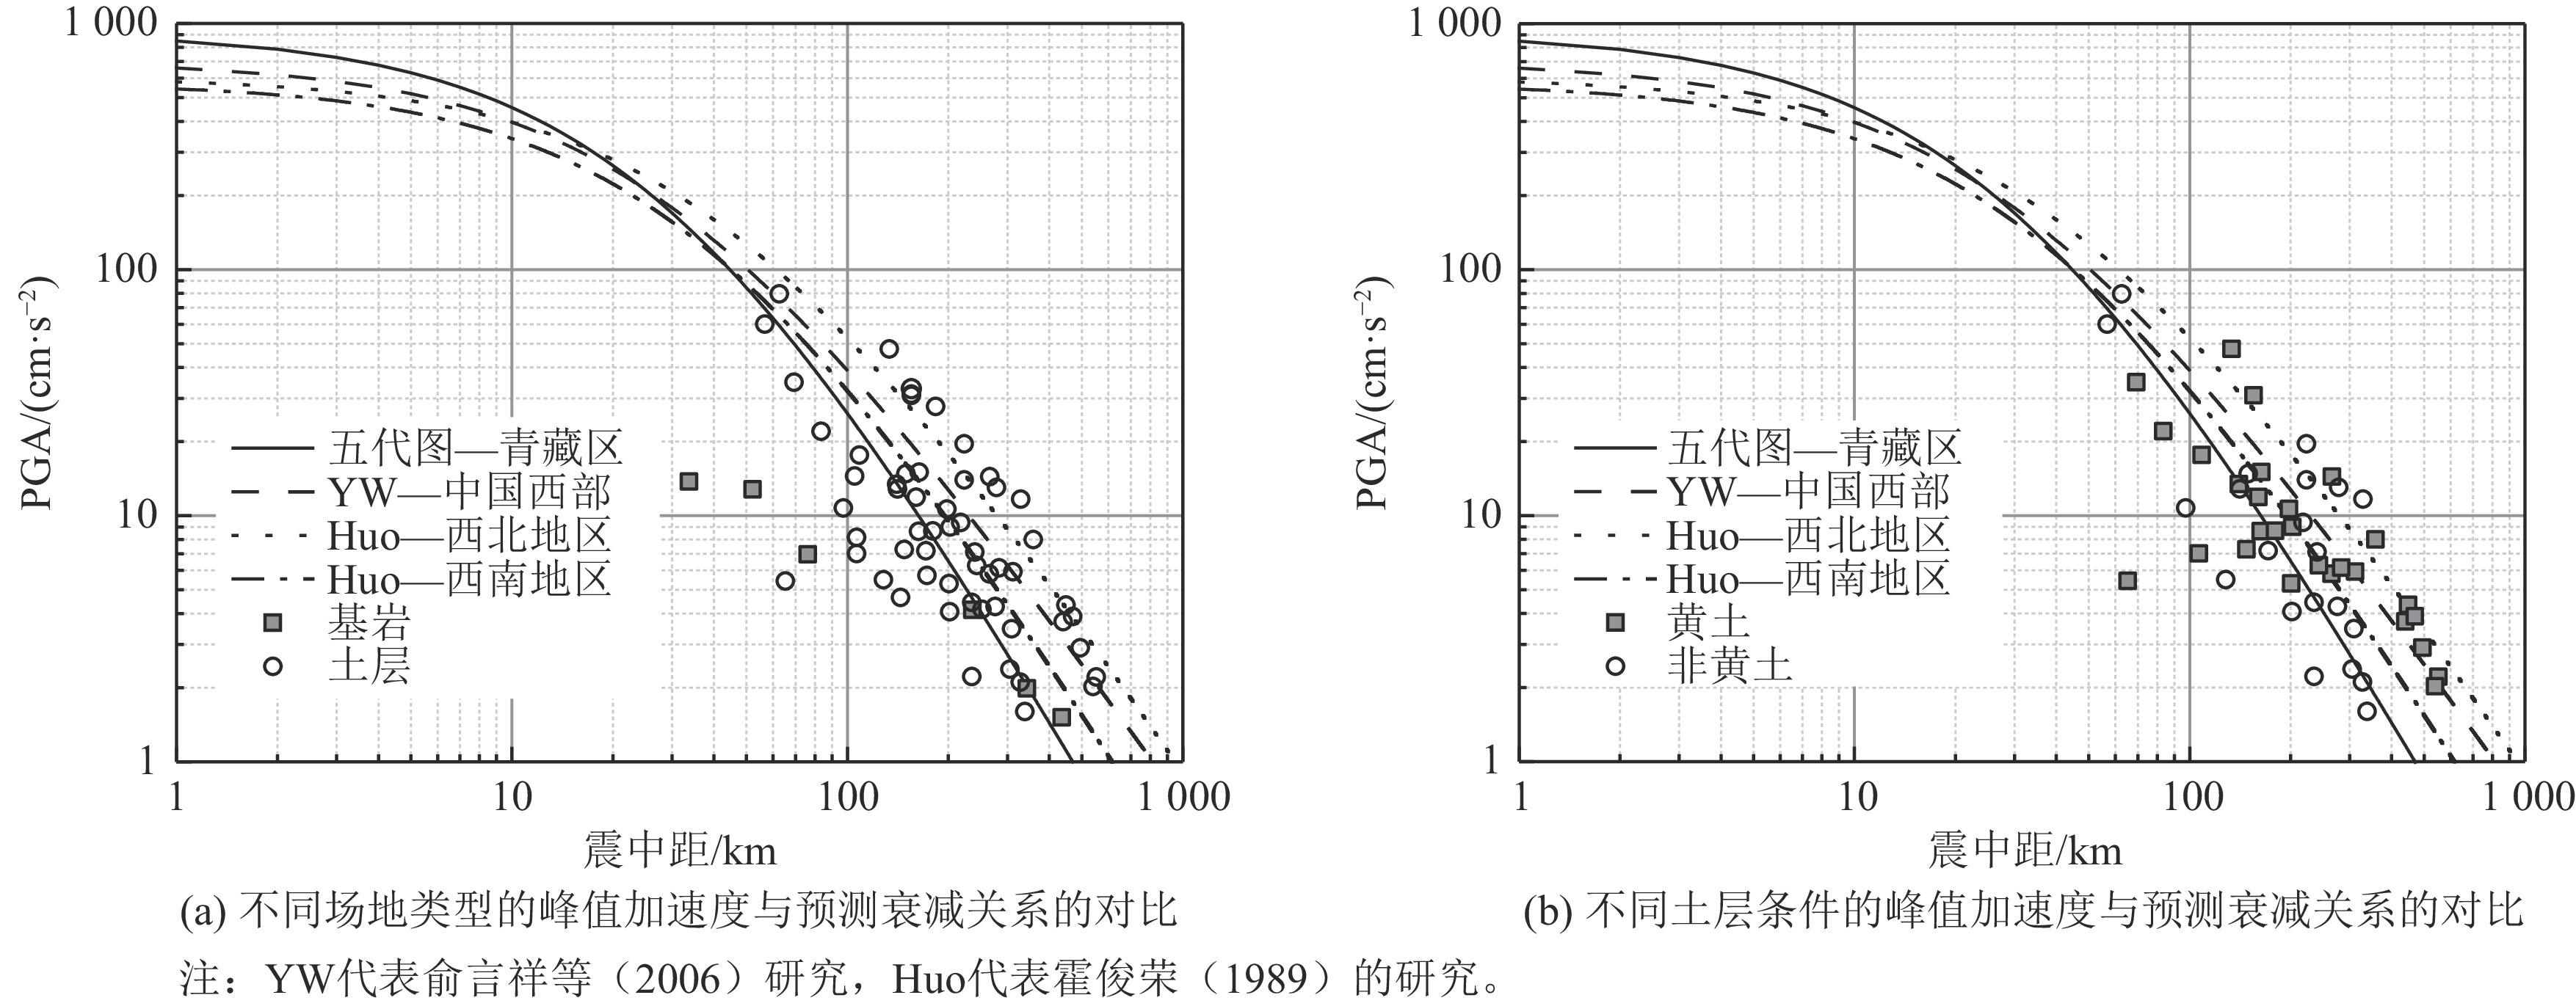
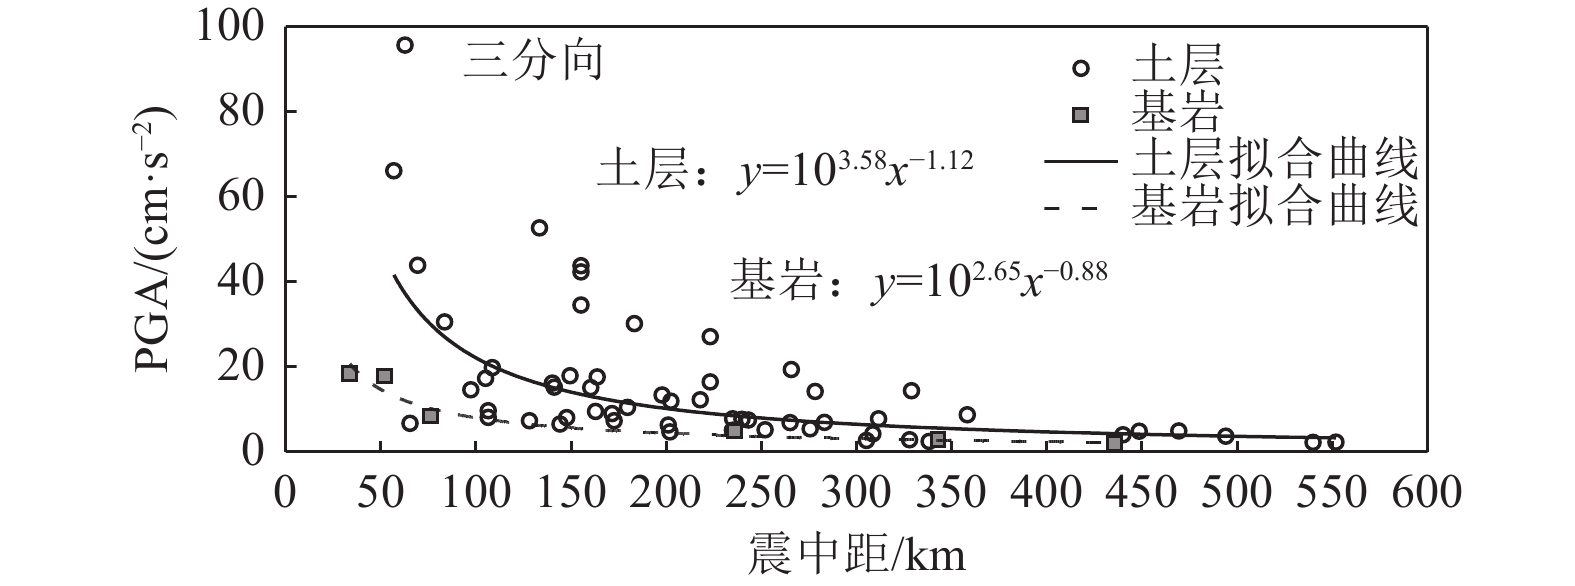
图 4 地震动峰值加速度与预测衰减关系的对比
Figure 4. Comparison of PGA and predicted attenuation relationship
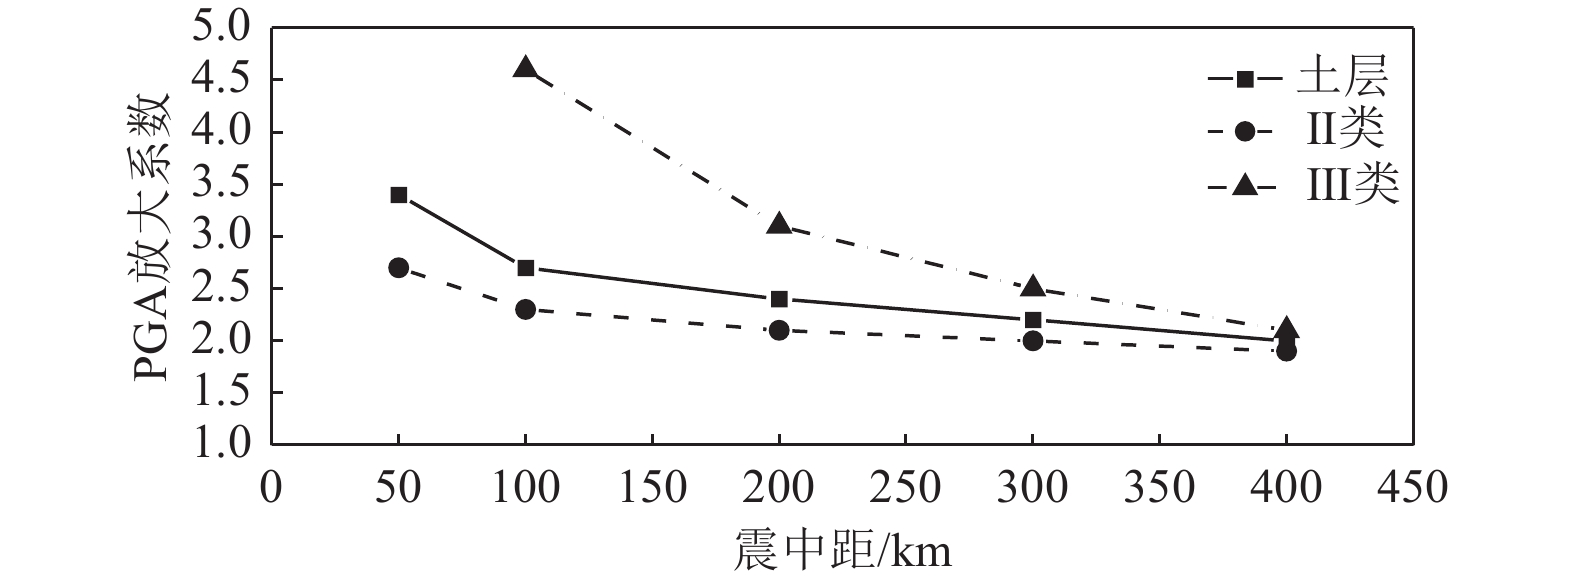
图 6 峰值加速度放大系数随震中距的变化
Figure 6. PGA amplification factor changes with the epicenter distance
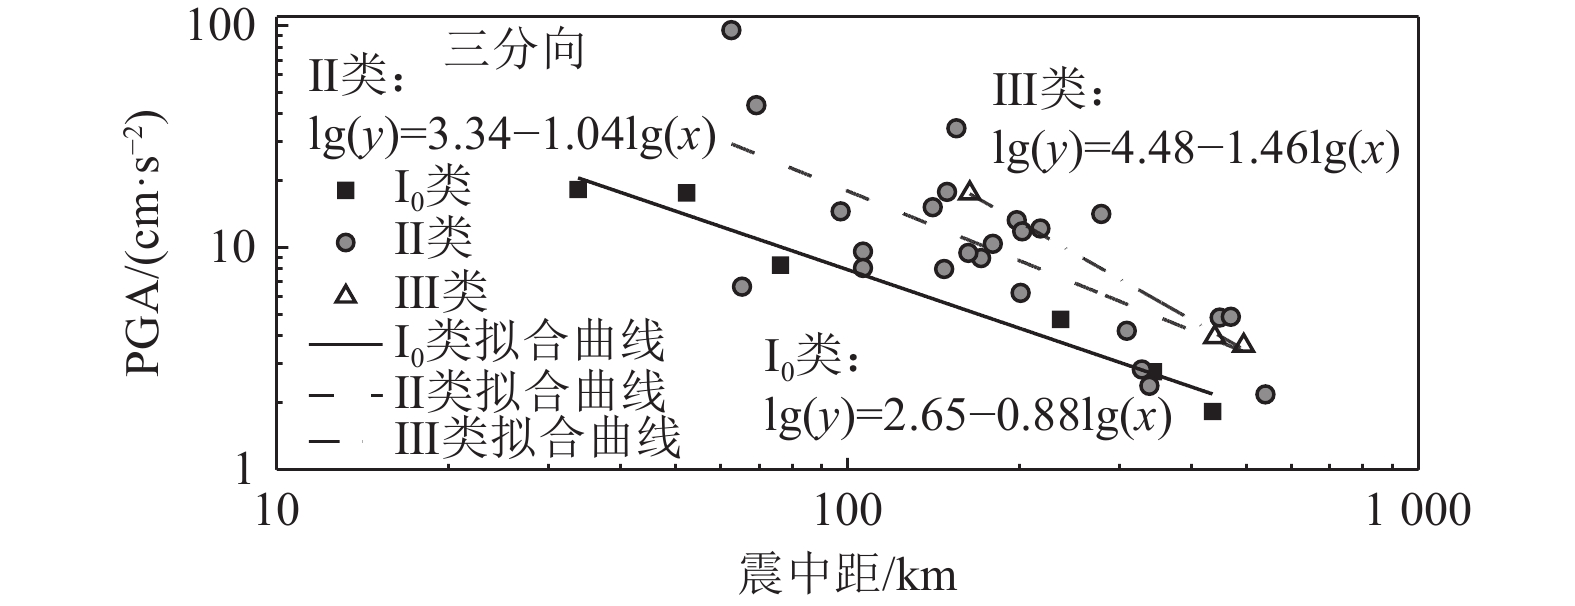
图 7 不同类别场地的峰值加速度随震中距的变化
Figure 7. The variation of PGA with epicentral distance for different categories of sites
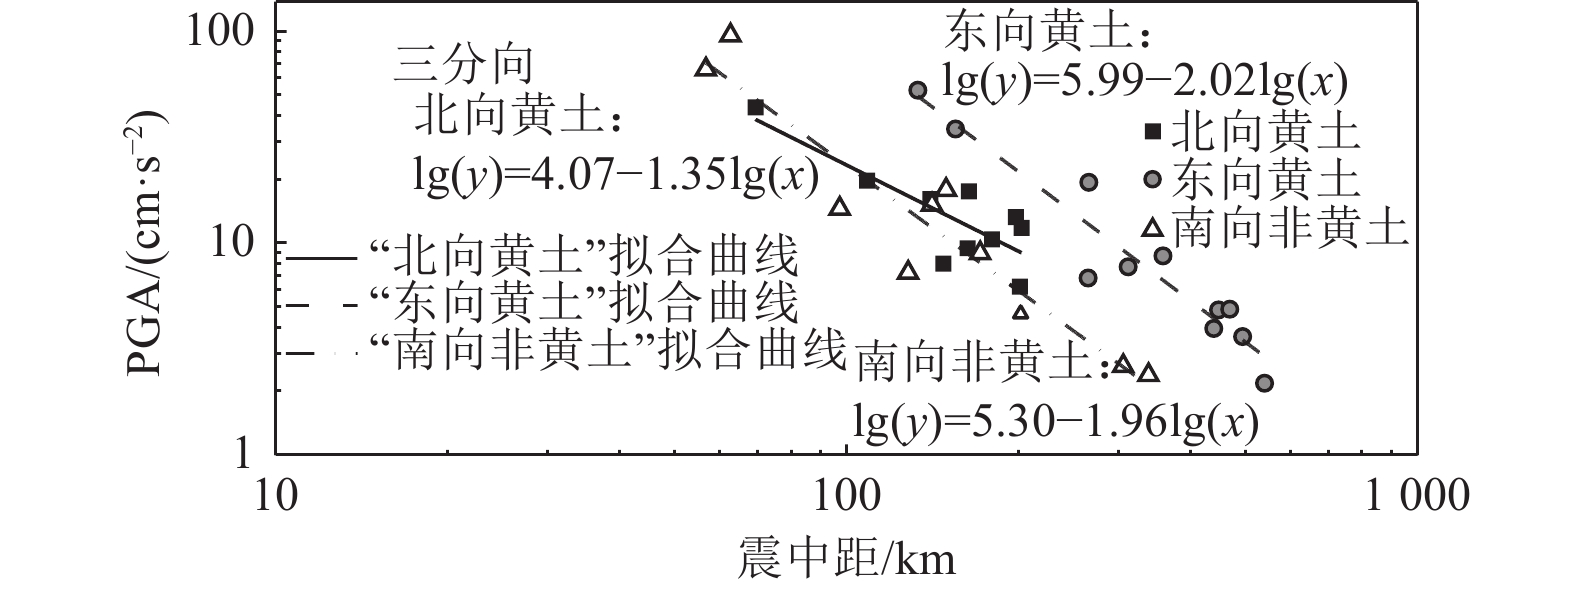
图 8 不同土层场地峰值加速度随震中距的变化
Figure 8. The PGA of the soil site varies with the epicenter distance
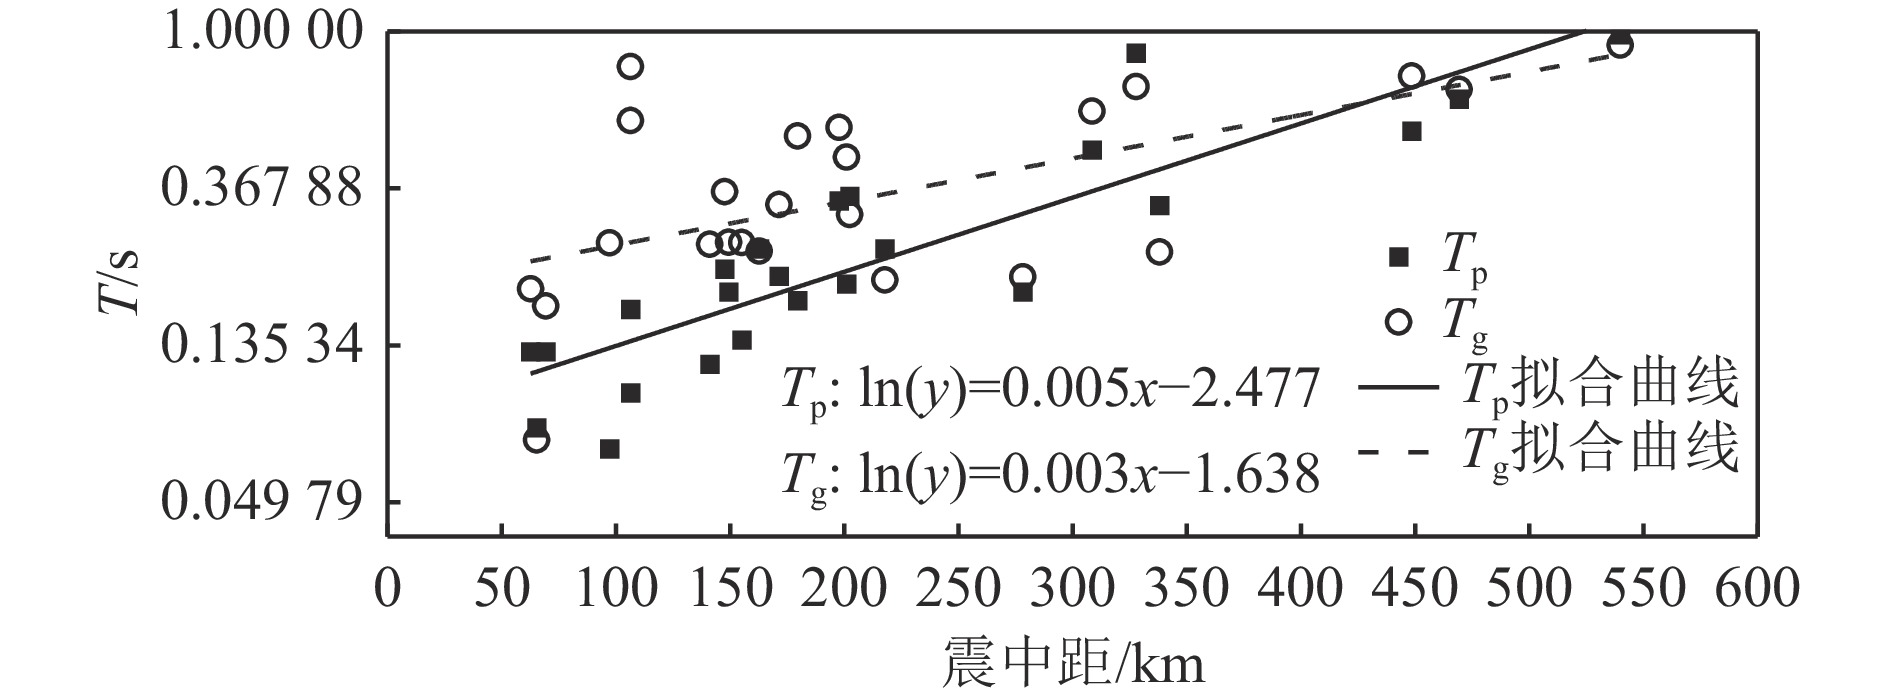
图 10 卓越周期及特征周期随震中距的变化关系
Figure 10. The variation of predominant period and characteristic period with epicentral distance
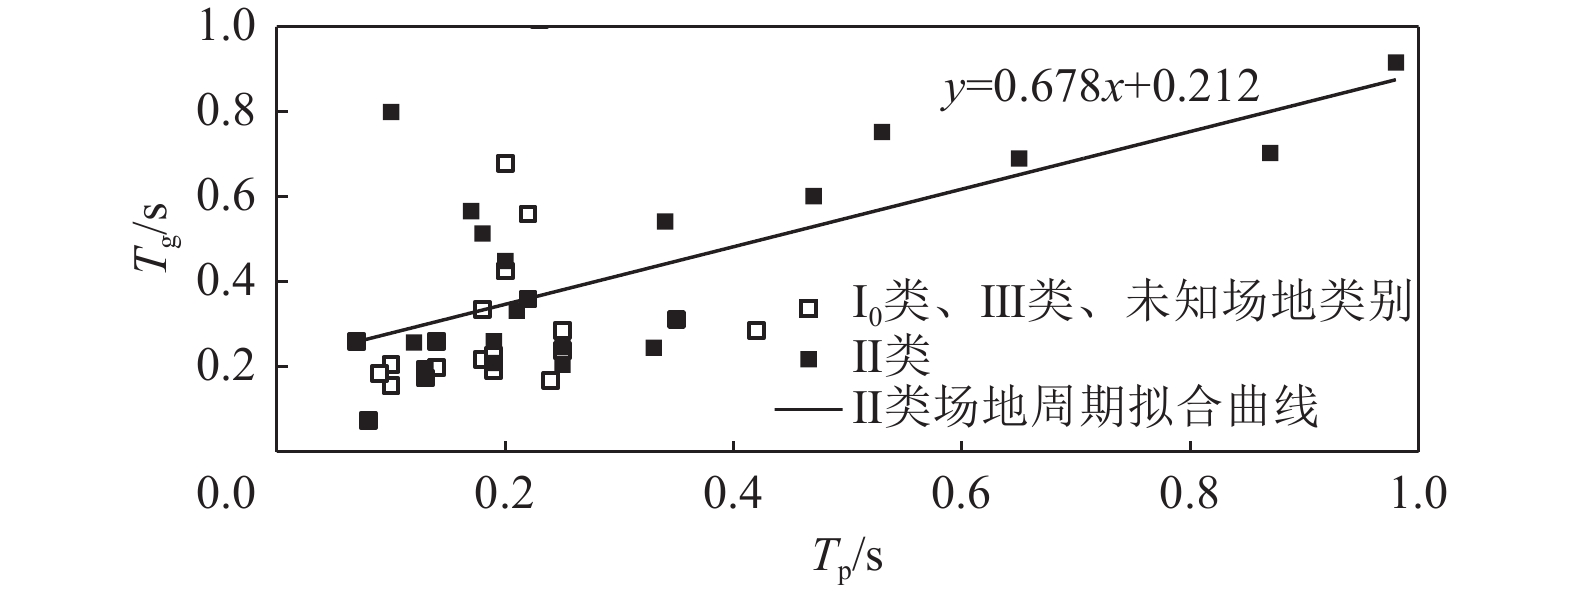
图 11 卓越周期与特征周期的对应关系
Figure 11. The corresponding relationship between the predominant period and the characteristic period
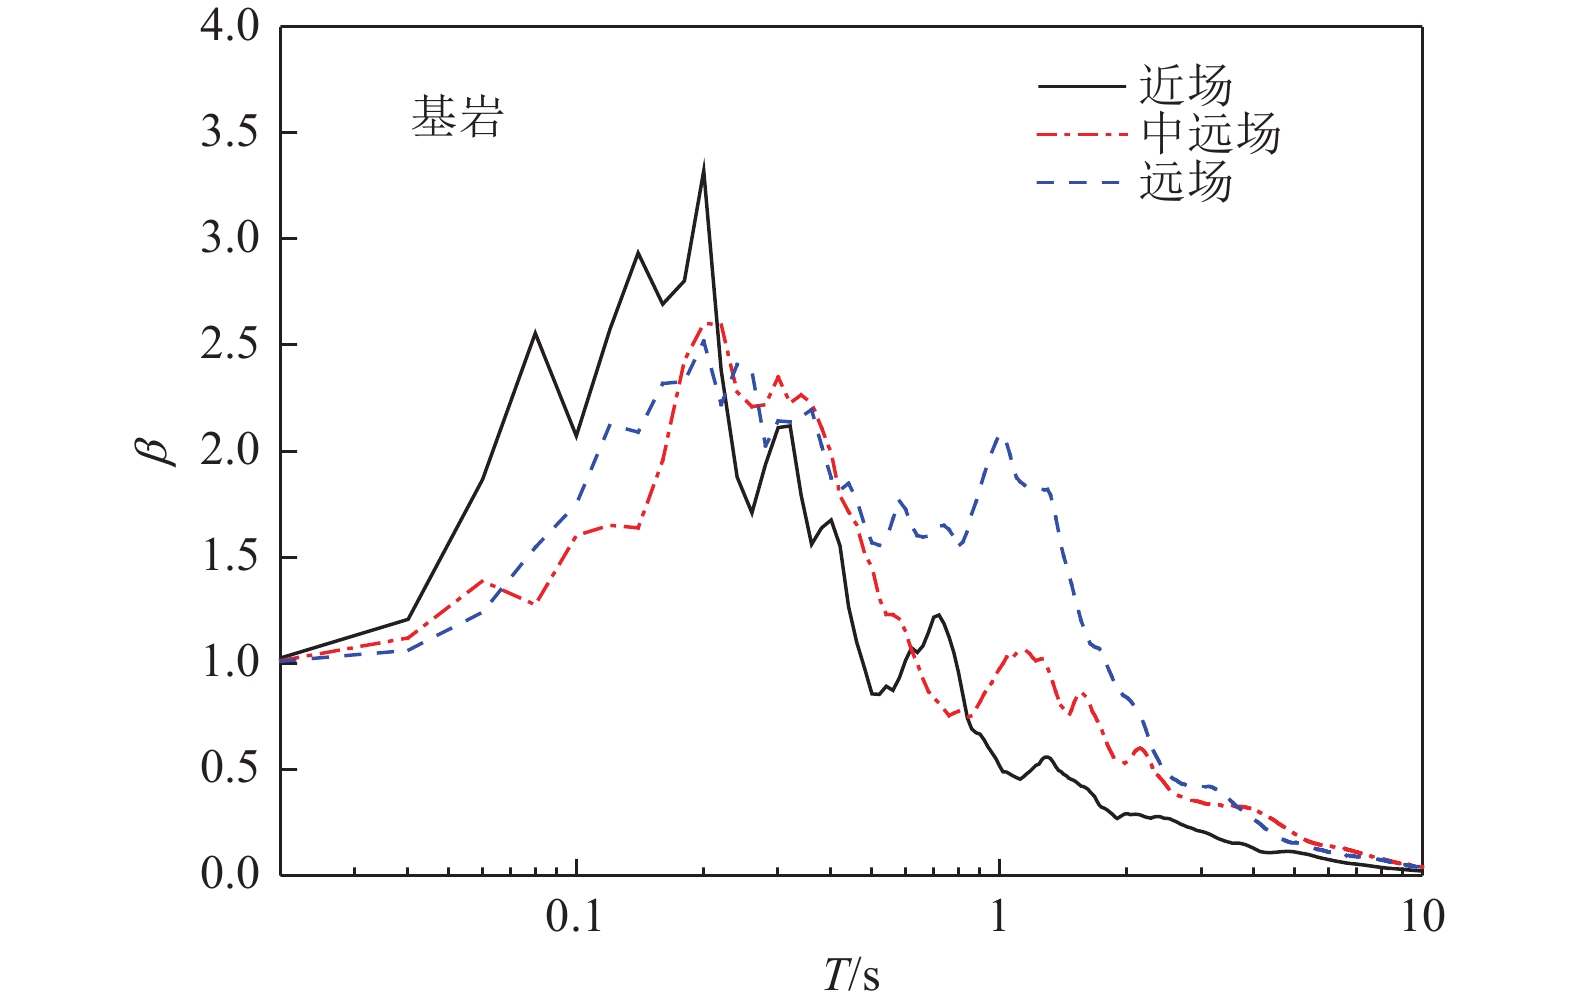
图 12 基岩场地的平均放大系数谱曲线(0.05阻尼比)
Figure 12. Average amplification factor spectrum curve of bedrock site ($ \xi =0.05 $)
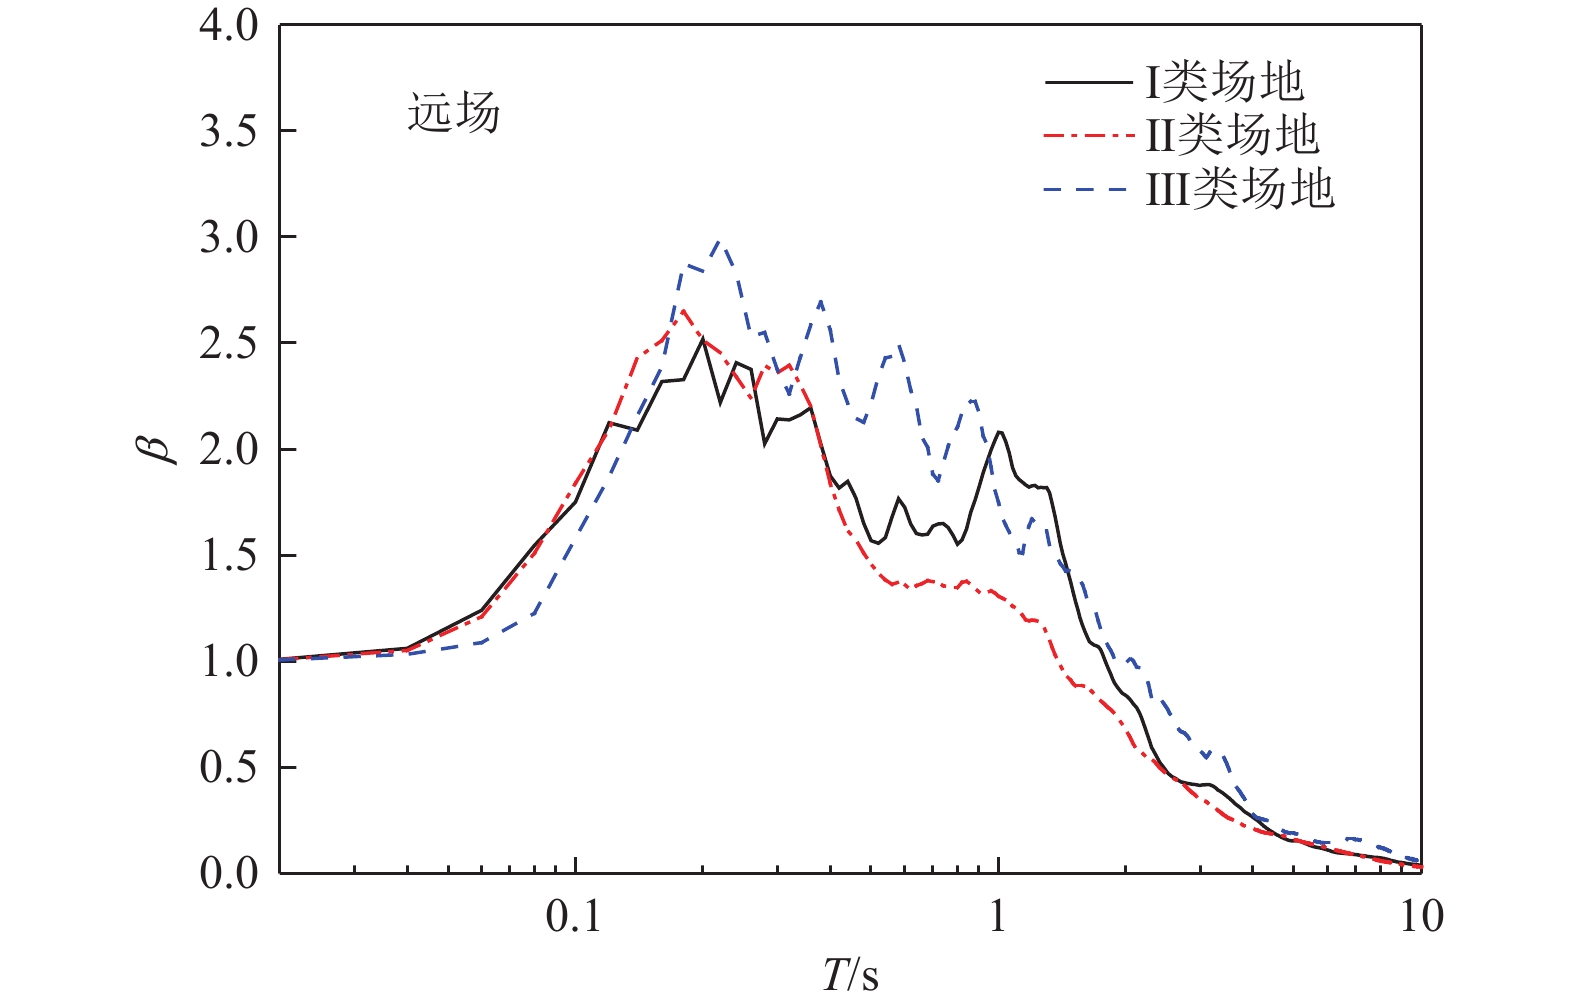
图 13 各类别场地的平均放大系数谱曲线(0.05阻尼比)
Figure 13. Average amplification factor curves of the far field of different sites ($ \xi =0.05 $)
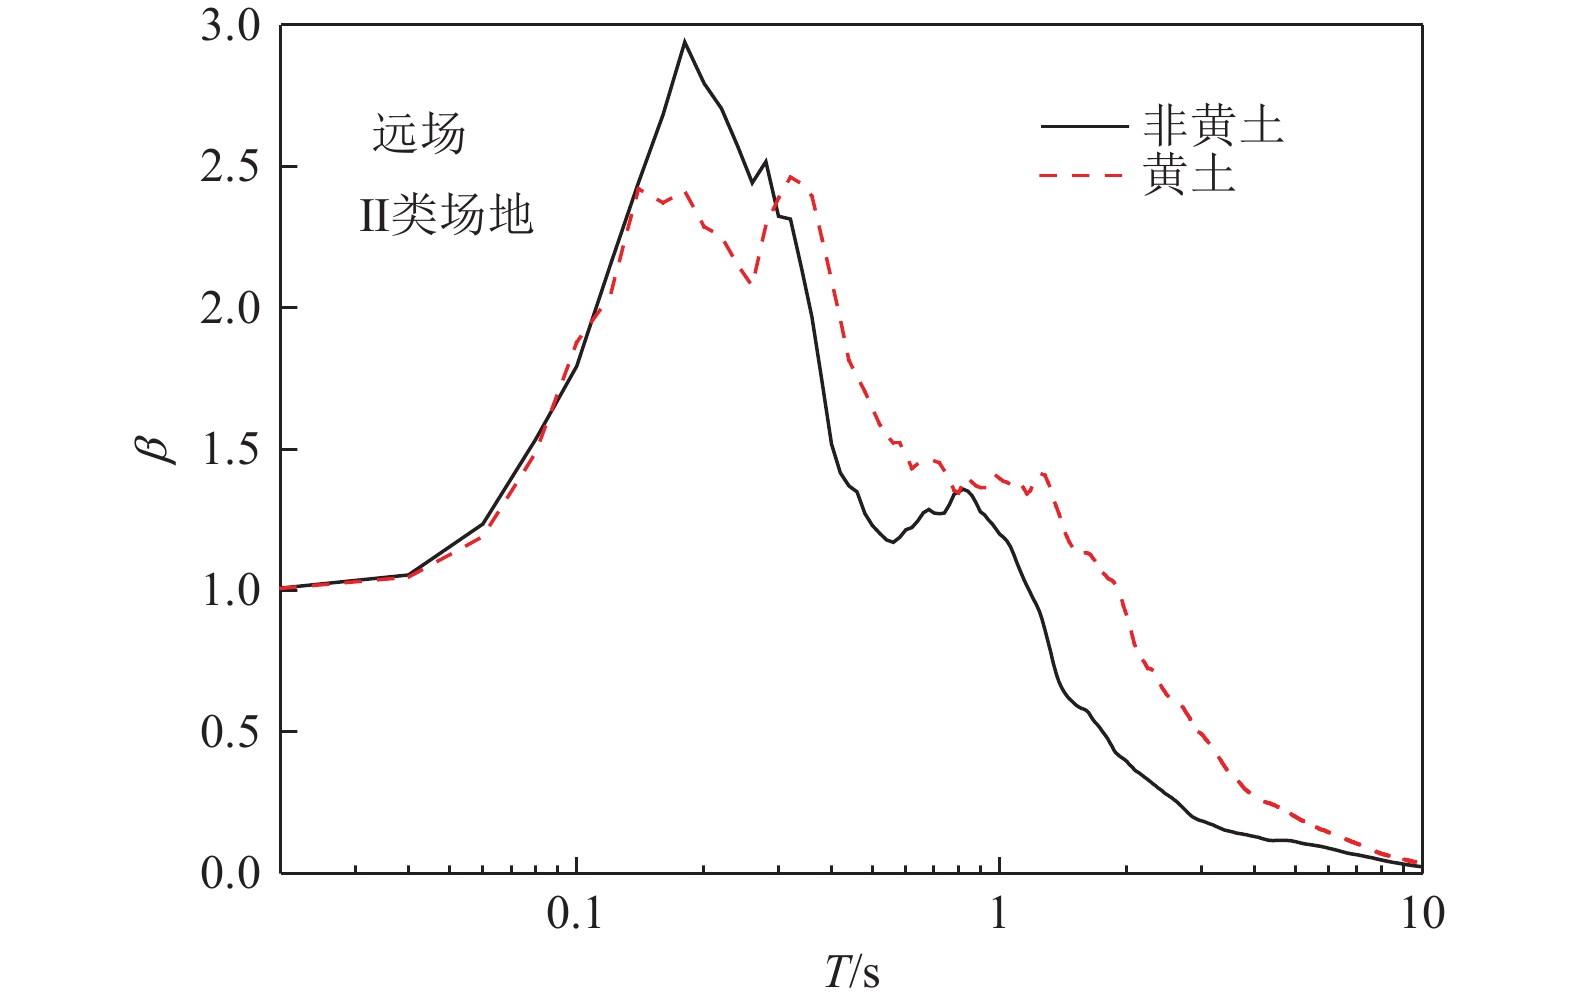
图 14 黄土与非黄土场地的平均放大系数谱曲线(0.05阻尼比)
Figure 14. Average amplification factor curves of loess and non-loess sites ($ \xi =0.05 $)
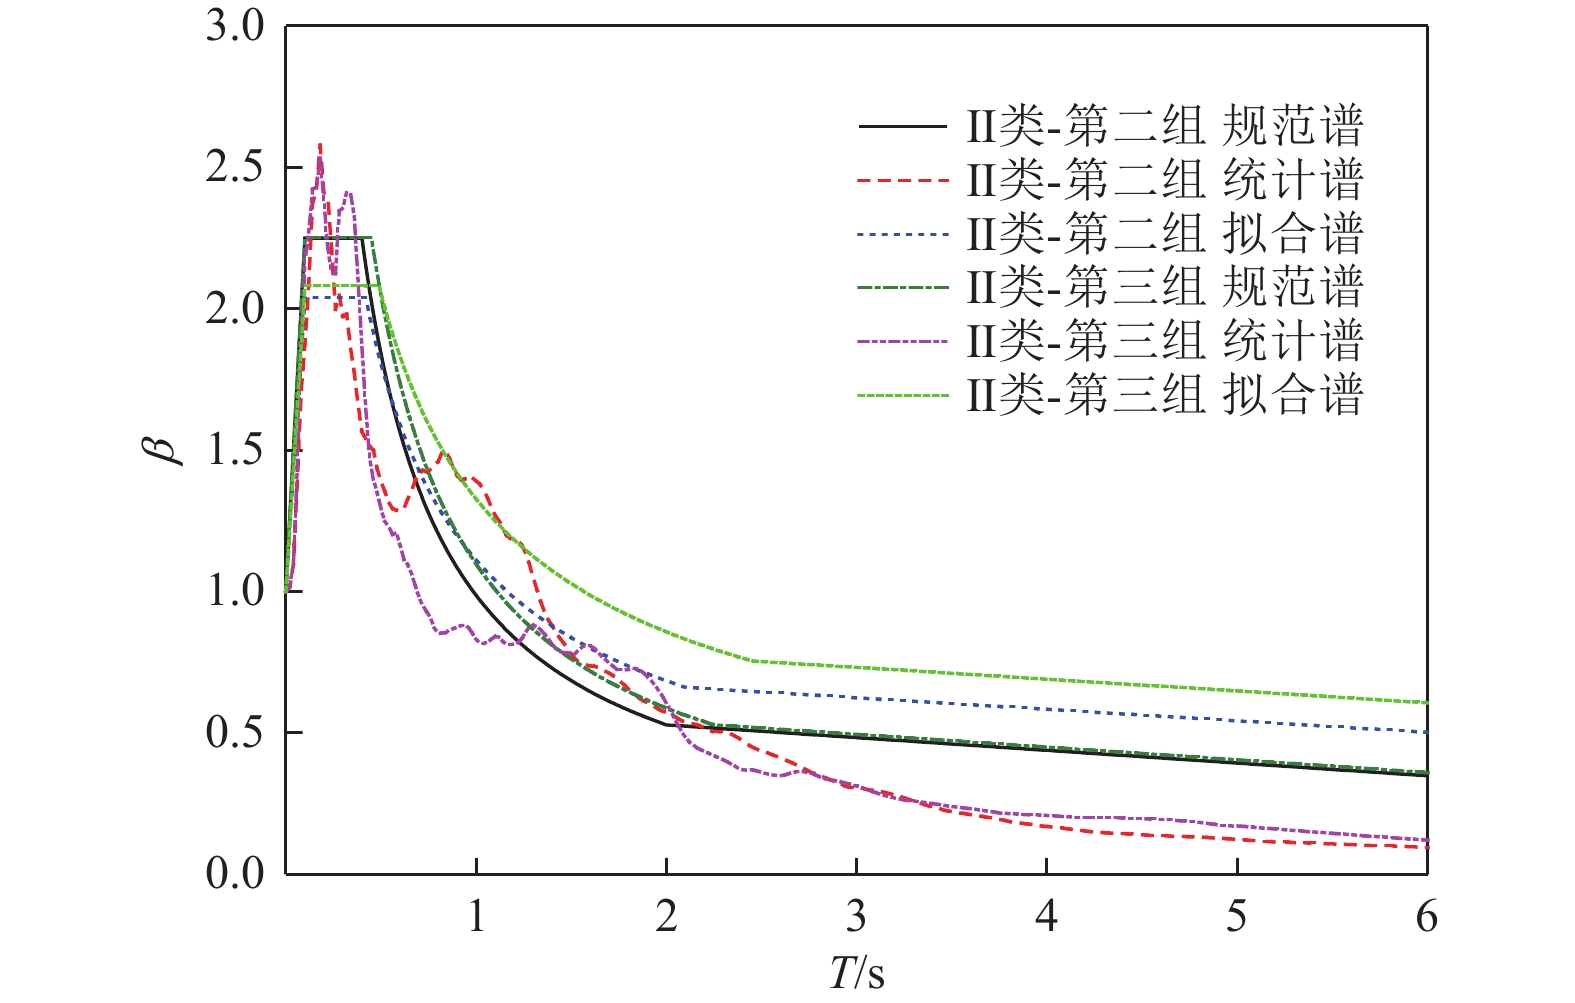
图 15 II类场地统计谱、拟合谱与规范谱的比较
Figure 15. Statistical response spectrum, pseudo-acceleration spectrum and code design spectrum of class II site
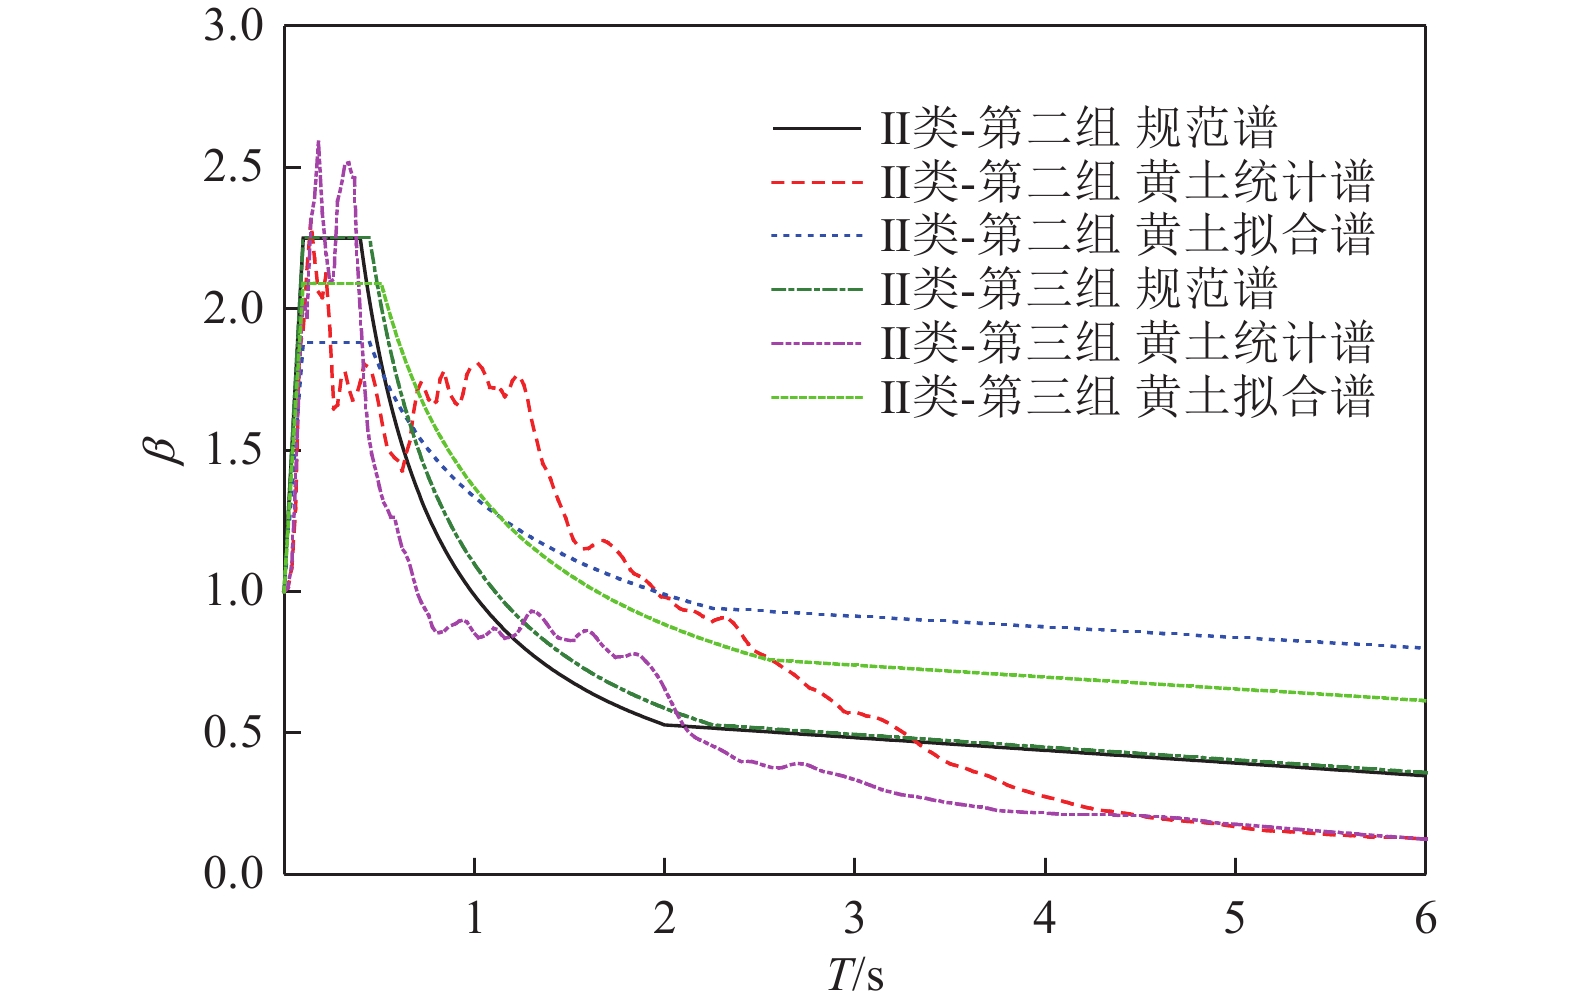
图 16 黄土场地统计谱、拟合谱与规范谱的比较
Figure 16. Statistical response spectrum, pseudo-acceleration spectrum and code design spectrum in loess area
表 1 强地震记录按震中距和场地条件分组统计表
Table 1. Statistics of strong motion record grouped in terms of epicentral distance and site condition
组别 震中距 场地类型 场地类别 台站个数 记录条数 1 近场 基岩 I 1 3 2 近场 土层 — — — 3 中远场 基岩 I 2 6 4 中远场 土层 (II) 6(4) 18(12) 5 远场 基岩 I 3 9 6 远场 土层 (II/III) 51(20/3) 153(60/9) 注:括号外的数量代表各组别对应的台站个数或记录条数;括号中的数量代表II类/III类场地对应的台站个数或记录条数。  下载: 导出CSV
表 2 典型台站的地震记录相关参数
Table 2. Parameters of seismic records at typical stations
序号 台站名称 台站编号 震中距/km 场地类别 合成PGA/(cm·s−2) 合成PGV/(cm·s−1) 合成PGV/合成PGA 卓越周期/s 特征周期/s 1 青川桥楼 51 QCQ 235.97 I类 4.76 0.44 0.09 0.16 0.36 2 长安台 61 CHA 435.66 I类 1.83 0.25 0.14 0.28 0.61 3 汤峪台 61 TAY 342.85 I类 2.76 0.50 0.18 0.61 0.79 4 临潭 62 LTA 76.22 I类 8.36 0.78 0.09 0.32 0.34 5 五竹镇 62 WZZ 52.18 I类 17.71 1.94 0.11 0.20 0.68 6 舟曲 62 ZHQ 33.72 I类 18.30 1.43 0.08 0.25 0.29 7 安县地办 51 AXD 327.76 II类 2.83 0.55 0.19 0.87 0.70 8 广元曾家 51 GYZ 278.22 II类 14.18 0.89 0.06 0.19 0.21 9 江油专业 51 JYT 308.52 II类 4.22 0.65 0.15 0.47 0.60 10 九寨勿角 51 JZW 171.43 II类 8.96 0.67 0.08 0.21 0.33 11 九寨永丰 51 JZY 149.40 II类 17.86 1.36 0.08 0.19 0.26 12 九寨章扎 51 JZZ 141.06 II类 15.20 1.06 0.07 0.12 0.26 13 理县木卡 51 LXK 338.07 II类 2.38 0.13 0.05 0.33 0.25 14 平武木座 51 PWM 217.75 II类 12.21 0.65 0.05 0.25 0.21 15 高陵台 61 GAL 448.48 II类 4.84 0.85 0.18 0.53 0.75 16 华阴台 61 HUY 539.86 II类 2.18 0.48 0.22 0.98 0.92 17 蓝田台 61 LAT 469.25 II类 4.88 0.65 0.13 0.65 0.69 18 八松 62 BAS 106.42 II类 9.61 1.06 0.11 0.17 0.57 19 皋兰 62 GLA 197.80 II类 13.31 1.62 0.12 0.34 0.54 20 观象台 62 GXT 200.98 II类 6.25 0.60 0.10 0.20 0.45 21 金崖 62 JIA 162.83 II类 9.48 0.64 0.07 0.25 0.25 22 康乐 62 KLE 106.44 II类 8.09 1.58 0.20 0.10 0.80 23 刘家堡 62 LJB 179.62 II类 10.42 1.29 0.12 0.18 0.51 24 平安 62 PAN 202.37 II类 11.84 0.68 0.06 0.35 0.31 25 沙湾 62 SHW 97.28 II类 14.56 0.89 0.06 0.07 0.26 26 宕昌 62 TCH 62.63 II类 95.64 4.64 0.05 0.13 0.19 27 天水 62 TSH 155.16 II类 34.50 1.98 0.06 0.14 0.26 28 冶力关 62 YLG 69.26 II类 43.82 1.79 0.04 0.13 0.17 29 卓尼 62 ZNI 65.32 II类 6.67 0.10 0.01 0.08 0.07 30 中铺 62 ZPU 147.63 II类 8.00 0.78 0.10 0.22 0.36 31 草滩台 61 CAT 439.92 III类 3.95 0.63 0.16 0.20 0.63 32 吝店台 61 LID 494.02 III类 3.61 0.52 0.14 0.60 0.69 33 和平 62 HEP 163.63 III类 17.58 1.67 0.10 0.21 0.47
下载: 导出CSV
表 3 由拟合式算出的不同类型场地峰值加速度
Table 3. PGA for various site types computed from fitted formula
场地类型 峰值加速度/(cm·s−2) 50 km 100 km 200 km 300 km 400 km 基岩/I类场地 14.13 7.94 4.22 2.95 2.29 土层场地 47.52(3.4) 21.67(2.7) 10.07(2.4) 6.39(2.2) 4.63(2.0) II类场地 37.41(2.7) 18.20(2.3) 8.85(2.1) 5.81(2.0) 4.31(1.9) III类场地 — 36.31(4.6) 13.18(3.1) 7.30(2.5) 4.79(2.1) 注:括号内数值表示针对基岩场地(I类场地)峰值加速度的放大系数。
下载: 导出CSV
表 4 由拟合式算出的黄土与非黄土场地峰值加速度
Table 4. The peak acceleration of loess and non-loess sites computed from fitting formula
场地类型 峰值加速度/(cm·s−2) 50 km 100 km 200 km 300 km 400 km 南向非黄土 93.33 23.99 6.17 2.79 1.59 北向黄土 59.70(0.6) 23.44(1.0) 9.21(1.5) — — 东向黄土 — 89.13(3.7) 21.98(3.6) 9.68(3.5) 5.42(3.4) 注:括号内数值表示针对非黄土场地峰值加速度的放大倍数。
下载: 导出CSV
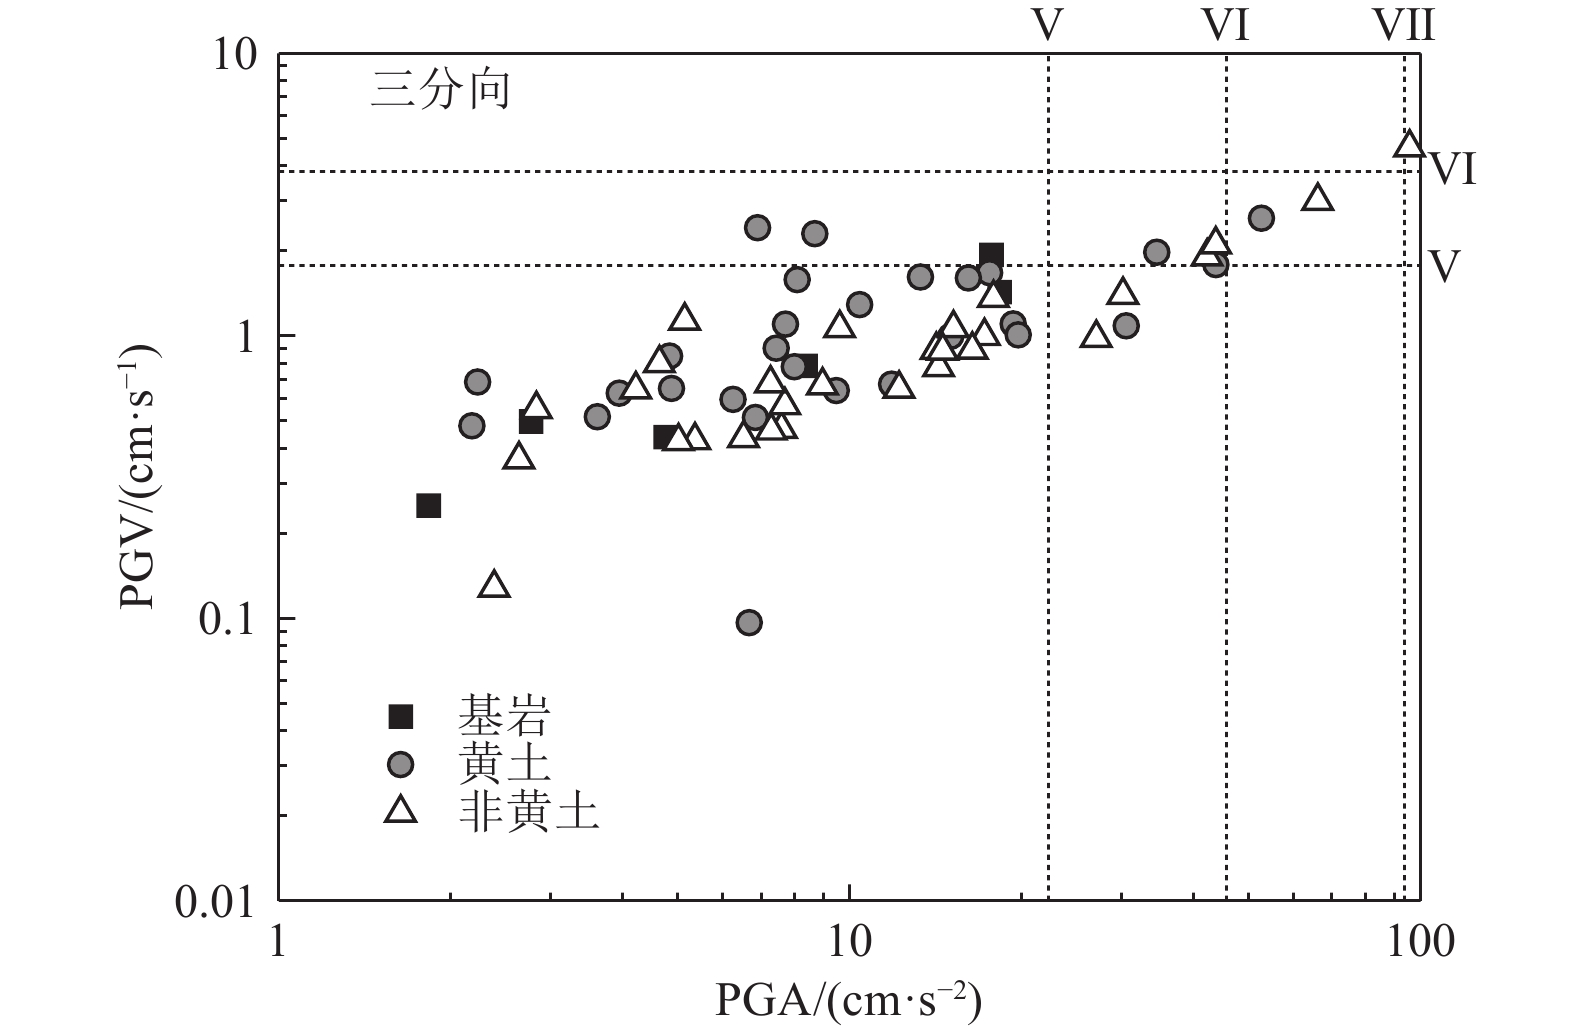
表 5 峰值速度与峰值加速度的比值
Table 5. The ratio of PGV to PGA
场地类型 峰值速度与峰值加速度的比值/(cm·s−1·g−1) ≤50 km 50~100 km >100 km 基岩 77 100 133 黄土 — 29 130 非黄土 — 51 84
下载: 导出CSV
表 6 统计谱拟合曲线的特征值
Table 6. The characteristic values of pseudo-acceleration spectrum
设计地震分组 台站数/个 Tg/s βmax γ II类-第二组 15 0.42 2.04 0.70 II类-第三组 9 0.49 2.08 0.63 II类-第二组黄土场地 5 0.45 1.88 0.43 II类-第三组黄土场地 8 0.51 2.09 0.63
下载: 导出CSV
表 7 基岩场地相对持时及能量持时的平均值(单位:秒)
Table 7. The average value of the relative duration and energy duration of the soil site(Unit: s)
震中距/km Td(≥Amax/2) Td(≥Amax/3) Td(5%~95%) Td(5%~75%) NS EW UD NS EW UD NS EW UD NS EW UD 50~100 40.19 43.16 43.17 43.14 43.22 43.32 20.94 23.88 23.32 9.13 12.59 13.18 >100 69.01 69.05 69.01 69.02 69.05 69.05 29.59 39.77 36.85 14.83 25.82 22.16
下载: 导出CSV
表 8 不同类别场地相对持时及能量持时的平均值(单位:秒)
Table 8. The average value of the relative duration and energy duration of the different sites(Unit: s)
场地类别 台站个数 Td(≥Amax/2) Td(≥Amax/3) Td(5%~95%) Td(5%~75%) NS EW UD NS EW UD NS EW UD NS EW UD I类 3 69.01 69.05 69.01 69.02 69.05 69.05 29.59 39.77 36.85 14.83 25.82 22.16 II类 20 69.81 68.90 70.76 72.55 71.70 72.53 37.47 36.05 45.26 21.65 20.50 28.44 III类 3 111.52 111.88 112.04 112.03 112.15 112.38 58.87 62.57 82.02 35.40 35.69 60.05
下载: 导出CSV
表 9 黄土场地与非黄土场地相对持时及能量持时的平均值(单位:秒)
Table 9. The average value of the relative duration and energy duration of loess and non-loess sites(Unit: s)
震中距/km 土层条件 台站个数 Td(≥Amax/2) Td(≥Amax/3) Td(5%~95%) Td(5%~75%) NS EW UD NS EW UD NS EW UD NS EW UD 100~300 非黄土 6 63.44 62.95 64.81 64.65 64.85 65.57 33.24 32.95 36.94 20.63 21.04 23.97 黄土 8 67.62 67.27 68.26 72.92 70.75 72.03 36.96 37.16 44.19 21.82 21.33 26.43 >300 非黄土 3 59.68 54.38 60.11 60.06 59.73 60.35 29.52 20.81 32.53 15.89 7.41 19.05 黄土 3 98.51 99.69 99.95 99.87 99.88 99.97 55.24 54.55 77.52 28.97 30.27 52.11
下载: 导出CSV
-
郭晓云, 2011. 汶川地震反应谱研究. 哈尔滨: 中国地震局工程力学研究所.Guo X. Y., 2011. Study on response spectrum of WenChuan earthquake. Harbin: Institute of Engineering Mechanics, China Earthquake Administration. (in Chinese) 黄旭涛, 温瑞智, 任叶飞等, 2013. 2013年7月22日岷县漳县6.6级地震强震记录及特征分析. 地震工程学报, 35(3): 489−496.Huang X. T., Wen R. Z., Ren Y. F., et al., 2013. Strong motion records and its characteristics in Minxian-Zhangxian Ms6.6 Earthquake on July 22, 2013. China Earthquake Engineering Journal, 35(3): 489−496. (in Chinese) 霍俊荣, 1989. 近场强地面运动衰减规律的研究. 哈尔滨: 中国地震局工程力学研究所. 李小军, 钱玉, 荣棉水等, 2024. 基于地震动反应谱与傅里叶谱确定场地卓越频率的差异性. 震灾防御技术, 19(3): 421−435. doi: 10.11899/zzfy20240301Li X. J., Qian Y., Rong M. S., et al., 2024. Difference analysis of site dominant frequencies obtained from response spectra and Fourier spectra of earthquake motion. Technology for Earthquake Disaster Prevention, 19(3): 421−435. (in Chinese) doi: 10.11899/zzfy20240301 廖振鹏, 1989. 地震小区划-理论与实践. 北京: 地震出版社. 卢育霞, 王良, 魏来等, 2018. 利用场地表征参数研究岷漳地区地震动相对变化趋势. 防灾减灾工程学报, 38(2): 359−366. doi: 10.13409/j.cnki.jdpme.2018.02.021Lu Y. X., Wang L, Wei L., et al., 2018. Study on relative variability of ground-motion in Min-Zhang region by using representative site parameters. Journal of Disaster Prevention and Mitigation Engineering, 38(2): 359−366. (in Chinese) doi: 10.13409/j.cnki.jdpme.2018.02.021 马宁, 徐龙军, 谢礼立, 2008. 集集地震地震动频谱参数研究. 地震工程与工程振动, 28(1): 11−16. doi: 10.13197/j.eeev.2008.01.002Ma N., Xu L. J., Xie L. L., 2008. Study on the period parameters of ground motions during the Chi-Chi earthquake. Journal of Earthquake Engineering and Engineering Vibration, 28(1): 11−16. (in Chinese) doi: 10.13197/j.eeev.2008.01.002 万卫, 2013. 汶川地震反应谱衰减关系研究. 哈尔滨: 中国地震局工程力学研究所.Wan W., 2013. Study on relationship of response spectrum attenuation of Wenchuan earthquake. Harbin: Institute of Engineering Mechanics, China Earthquake Administration. (in Chinese) 万卫, 薄景山, 郭晓云, 2014. 2008年汶川MS8.0地震反应谱平台值衰减特性研究. 地震学报, 36(6): 1032−1042.Wan W., Bo J. S., Guo X. Y., 2014. Attenuation characteristic of the response spectrum platform value for 2008 Wenchuan Ms8.0 earthquake. Acta Seismologica Sinica, 36(6): 1032−1042. (in Chinese) 王亚勇, 戴国莹, 2006. 建筑抗震设计规范算例. 北京: 中国建筑工业出版社. 徐钦, 王文才, 田秀丰等, 2019. 岷县漳县6.6级地震及余震强震动记录特征分析. 地震工程学报, 41(4): 1026−1034.Xu Q., Wang W. C., Tian X. F., et al., 2019. Characteristics of strong motion records from Minxian-Zhangxian Ms6.6 earthquake and aftershock. China Earthquake Engineering Journal, 41(4): 1026−1034. (in Chinese) 杨永强, 谢礼立, 李明等, 2010. 汶川余震加速度记录的反应谱特征研究. 土木工程学报, 43(S1): 37−41.Yang Y. Q., Xie L. L., Li M, et al., 2010. Response spectrum characteristics of Wenchuan aftershock acceleration records. China Civil Engineering Journal, 43(S1): 37−41. (in Chinese) 俞言祥, 汪素云, 2006. 中国东部和西部地区水平向基岩加速度反应谱衰减关系. 震灾防御技术, 1(3): 206−217.Yu Y. X., Wang S. Y., 2006. Attenuation relations for horizontal peak ground acceleration and response spectrum in eastern and western China. Technology for Earthquake Disaster Prevention, 1(3): 206−217. (in Chinese) 俞言祥, 李山有, 肖亮, 2013. 为新区划图编制所建立的地震动衰减关系. 震灾防御技术, 8(1): 24−33. doi: 10.3969/j.issn.1673-5722.2013.01.003Yu Y. X., Li S. Y., Xiao L., 2013. Development of ground motion attenuation relations for the new seismic hazard map of China. Technology for Earthquake Disaster Prevention, 8(1): 24−33. (in Chinese) doi: 10.3969/j.issn.1673-5722.2013.01.003 张苏平, 聂高众, 孙艳萍等, 2017. 甘肃岷县漳县Ms6.6地震重灾区房屋类型与致死的关系研究. 地震工程学报, 39(4): 781−789.Zhang S. P., Nie G. Z., Sun Y. P., et al., 2017. Relation between different building types and personnel death in the heavy disaster area of the Minxian-Zhangxian Ms6.6 earthquake. China Earthquake Engineering Journal, 39(4): 781−789. (in Chinese) 中国地震局, 2013. 甘肃岷县漳县6.6级地震烈度图. (2013-07-24)[2024-12-18]. 2024. https://www.gov.cn/jrzg/2013-07/24/content_2454658.htm. 周中红, 陈文凯, 孙艳萍, 2024. 2000-2021年甘肃省地震灾害人员伤亡特征. 震灾防御技术, 19(2): 296−305.Zhou Z. H., Chen W. K., Sun Y. P., 2024. Characteristics of earthquake casualties in Gansu Province from 2000 to 2021. Technology for Earthquake Disaster Prevention, 19(2): 296−305. (in Chinese) Chen T., 2021. Seismic response analysis of loess site under far-field bedrock ground motion of the Wenchuan Earthquake. PLoS One, 16(7): e0254871. doi: 10.1371/journal.pone.0254871 Pu X. W., Wang L. M., Wang P, et al., 2022. The response law of far-field seismic ground motion of the Wenchuan earthquake and its damaging mechanism in the Loess Plateau. Earthquake Research Advances, 2(3): 100114. doi: 10.1016/j.eqrea.2022.100114 Rathje E. M., Abrahamson N. A., Bray J. D., 1998. Simplified frequency content estimates of earthquake ground motions. Journal of Geotechnical and Geoenvironmental Engineering, 124(2): 150−159. doi: 10.1061/(ASCE)1090-0241(1998)124:2(150) Rathje E. M., Faraj F., Russell S., et al., 2004. Empirical relationships for frequency content parameters of earthquake ground motions. Earthquake Spectra, 20(1): 119−144. doi: 10.1193/1.1643356 Wu Z. J., Xu S. M., CHEN D. W., et al., 2020. An experimental study of the influence of structural parameters on dynamic characteristics of loess. Soil Dynamics and Earthquake Engineering, 132: 106067. doi: 10.1016/j.soildyn.2020.106067 Xie J. J., Li X. J., Wen Z. P., et al., 2022. Soil profile database and site classification for national strong-motion stations in western China. Seismological Research Letters, 93(3): 1930−1942. doi: 10.1785/0220210271 -

 点击查看大图
计量
- 文章访问数: 226
- HTML全文浏览量: 142
- PDF下载量: 188
- 被引次数: 0
