
Preliminary Study on Shallow Seismic Activity Model in Taiwan Region
-
摘要: 本文从中国台湾地区气象厅(CWB)网站收集到了1900—2022年ML2.0以上震源深度小于350 km的地震目录数据集,按照台湾地区更新完善后的地震目录(1900—2014)建议的方法,将该地震目录的地震震级统一为矩震级MW。以此地震目录数据集为基础分析台湾地区的地震活动特征,探讨台湾地区不同时期记录的完备性震级下限MC的历史沿革。本文采用目前国际比较流行的Gardner-Knopoff除丛方法删除了地震目录中的前震和余震,分别选用Gardner-Knopoff时空窗、Grünthal时空窗、Uhrhammer时空窗计算获得了相应的主震目录。结果表明,不同的除丛方法对地震目录影响显著。本文推荐使用Gardner-Knopoff除丛方法的Uhrhammer时空窗参数去除地震目录中的前震和余震事件,并建议在概率地震危险性分析中应该考虑由多种除丛方法引起的认知不确定性。文中采用Stepp(1971)方法对台湾地区的地震目录进行了完整性分析,根据各震级档地震平均发生率估计的方差偏离所绘制的预期回归线的时间,给出了各震级档的完整性时间表,避免了人为主观判断所引入的认知不确定性。最后,分别利用Weichert(1980)、Bender(1983)以及Kijko等(2012)的极大似然估计方法对台湾地区G-R关系中的活动性参数进行估算,获得了台湾地区的地震活动性参数值。本文的研究结果能够为后续台湾地区的概率地震危险性分析提供数据输入,为下一代区划图的编制提供地震活动参数计算方法和参考。Abstract: This paper compiles an earthquake catalogue dataset containing earthquakes with magnitudes above ML2.0 and focal depths less than 350 km, sourced from the Taiwan Meteorological Bureau (CWB) for the period from 1900 to 2022. All magnitudes in this catalogue are standardized to moment magnitudes (MW). Utilizing this dataset, we analyze the characteristics of seismic activity in Taiwan and discuss the historical evolution of the lower limit for completeness magnitude (MC) recorded during different periods. To refine the earthquake catalogue, we apply the widely used Gardner-Knopoff declustering method to remove foreshocks and aftershocks. Three time-distance window parameters—Gardner-Knopoff, Grünthal, and Uhrhammer—are employed to derive the corresponding mainshock catalogue through calculations. Our findings indicate that different declustering methods significantly impact the resulting earthquake catalogue. In this study, we recommend the Gardner-Knopoff declustering method combined with the Uhrhammer time-distance window parameters for effectively removing foreshock and aftershock events. We emphasize that epistemic uncertainty arising from various declustering approaches must be considered in probabilistic seismic hazard analyses. The completeness of the earthquake catalog in Taiwan is assessed using the Stepp (1971) method, which establishes completeness times for each magnitude bin based on the point at which the estimated variance of the average earthquake occurrence rate deviates from the expected regression line, thus minimizing subjective bias. Finally, we estimate the activity parameters of the Gutenberg-Richter (G-R) relationship in Taiwan using maximum likelihood estimation methods developed by Weichert (1980), Bender (1983), and Kijko et al., (2012). The results of this research provide valuable data inputs for future probabilistic seismic hazard analyses in Taiwan and serve as a reference for calculating seismic activity parameters for the upcoming seismic ground motion parameters zonation map of China.1)
1 2 中国地震动参数区划图编制组, 2011. 中国地震动参数区划图技术报告-地震活动性参数确定专题报告. -

图 1 台湾地区MW≥2的浅源地震分布图
Figure 1. Distribution of shallow source earthquakes with MW≥2 in Taiwan
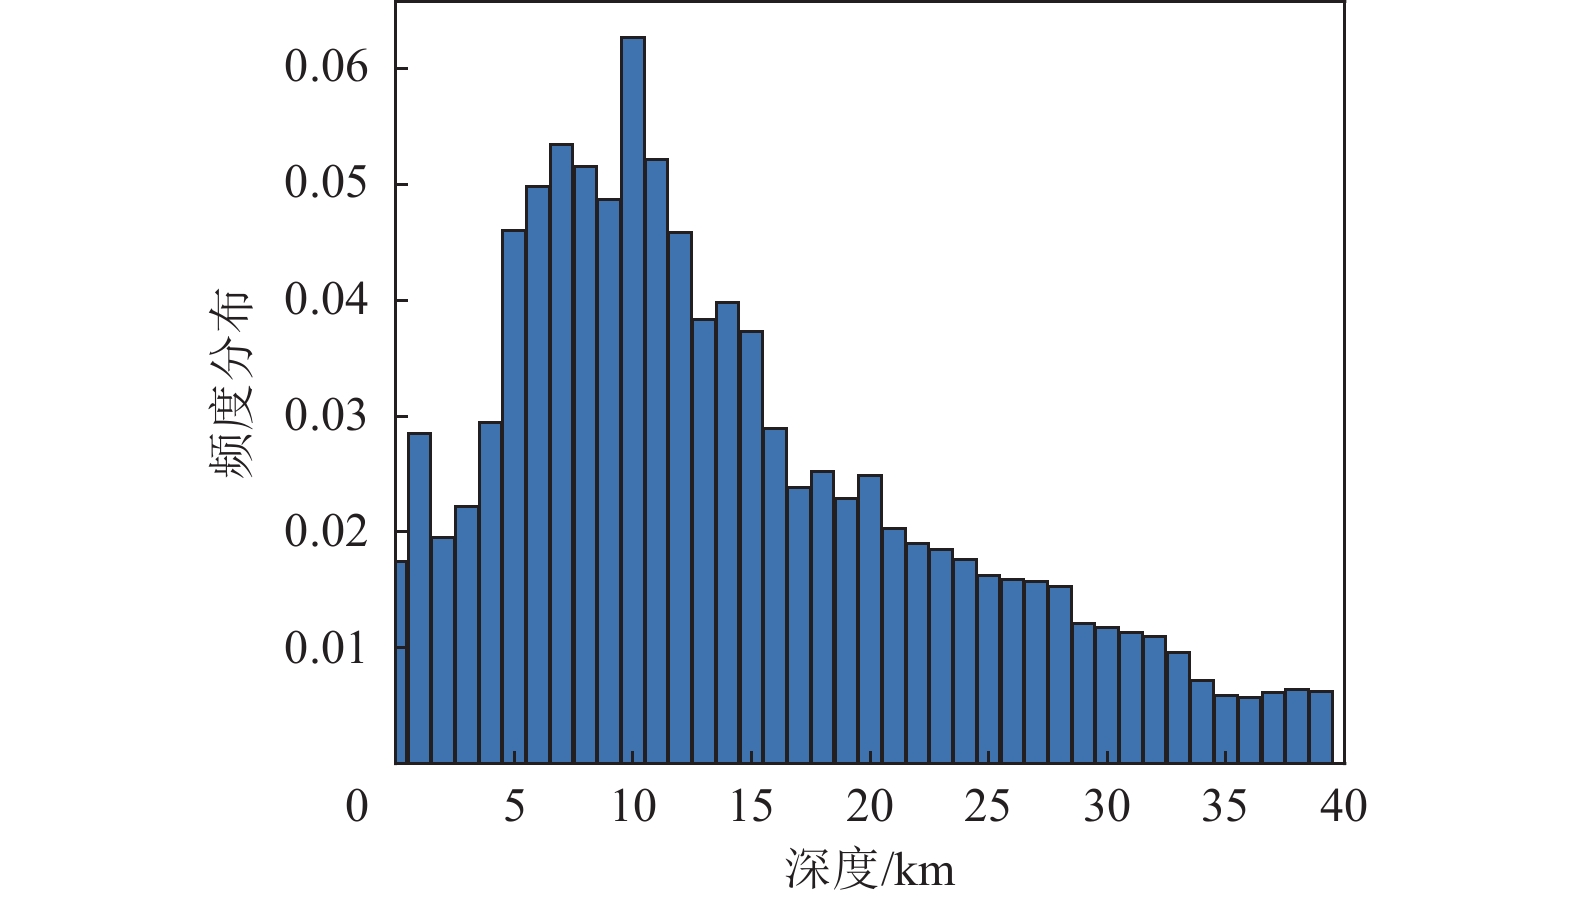
图 2 台湾地区ML≥2的浅源震源深度频度分布图
Figure 2. Frequency distribution of focal depth of shallow source earthquakes with ML≥2 in Taiwan
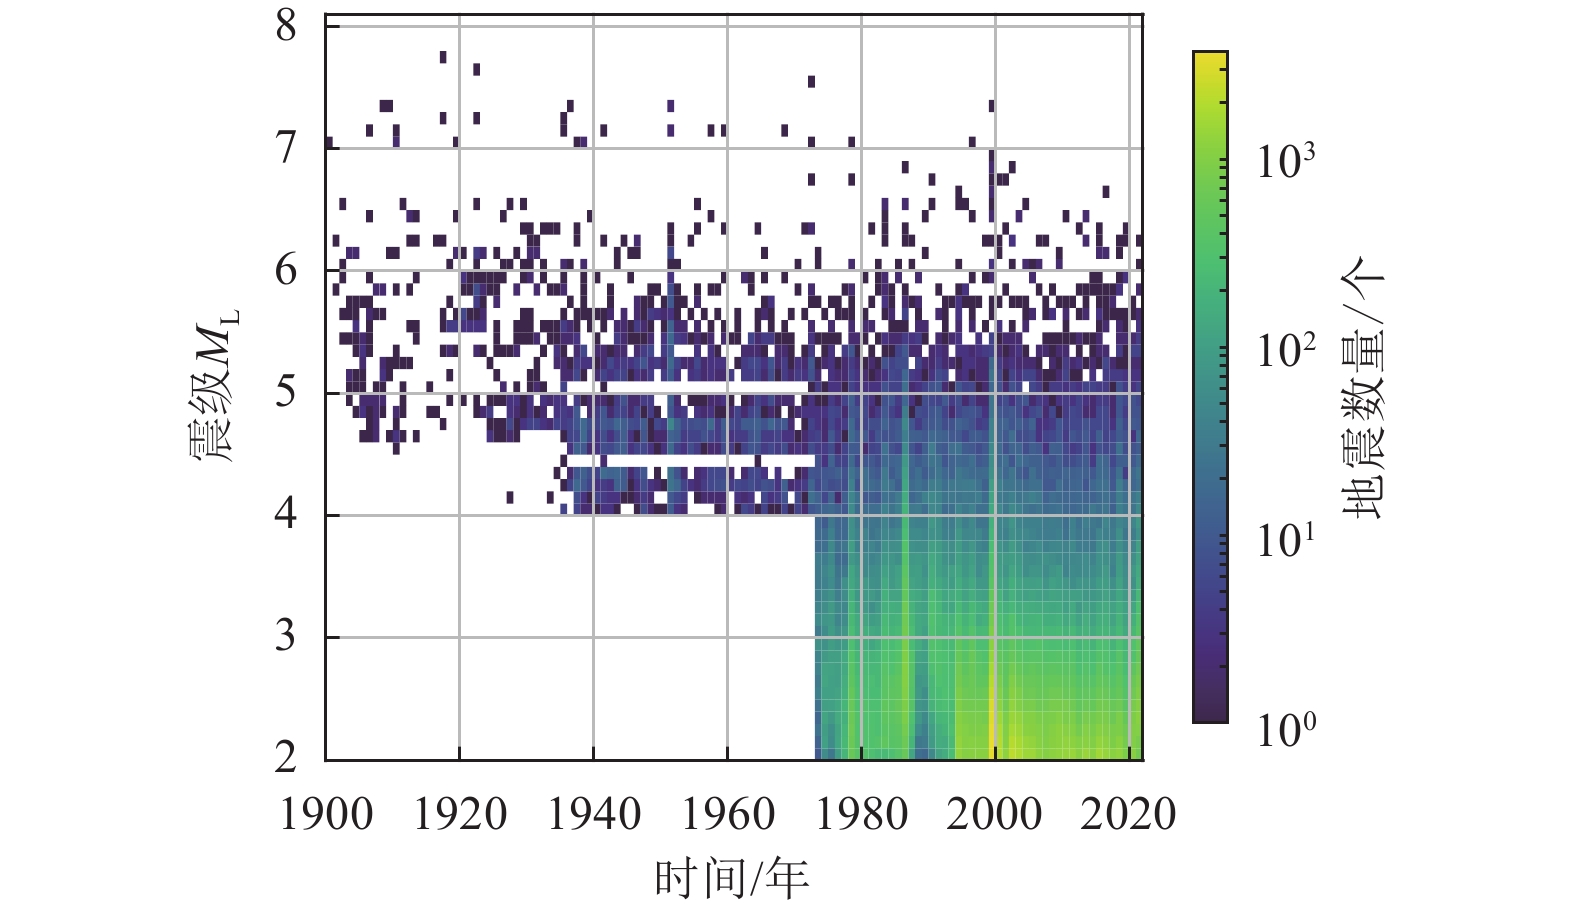
图 3 台湾地区ML≥2的浅源地震震级-发震时间的密度分布图
Figure 3. Relationship between the magnitudes and time of shallow source earthquakes with ML≥2 in Taiwan

图 4 利用3种时空窗方法除丛获得的台湾地区主震空间分布
Figure 4. Spatial distribution of mainshocks in Taiwan obtained by using various declustering approach methods
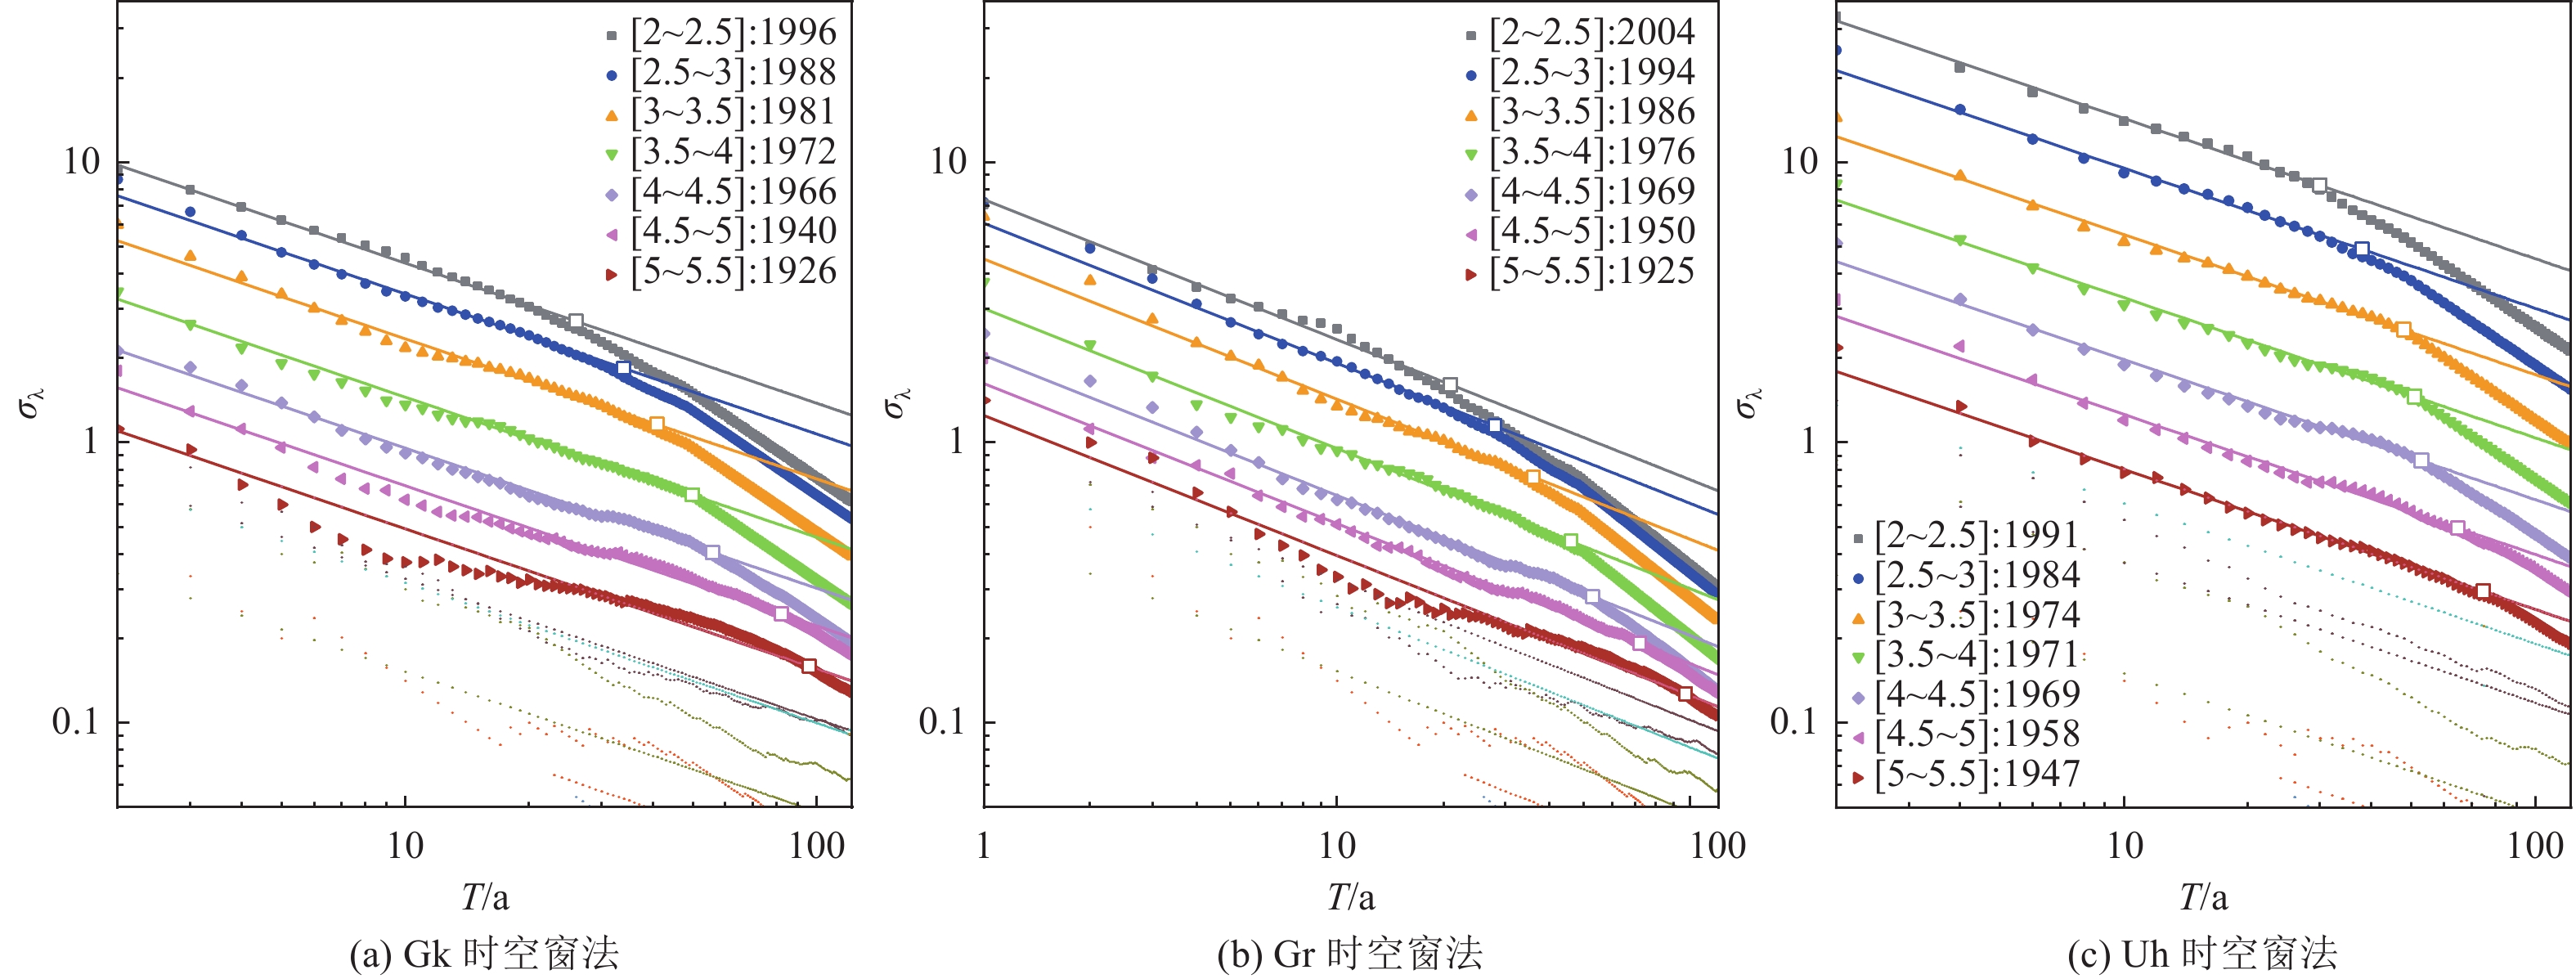
图 5 地震目录中各震级档地震平均发生率的方差与观测时间关系
Figure 5. Relationship between observation time and variance of the average incidence of earthquakes at each magnitude bin
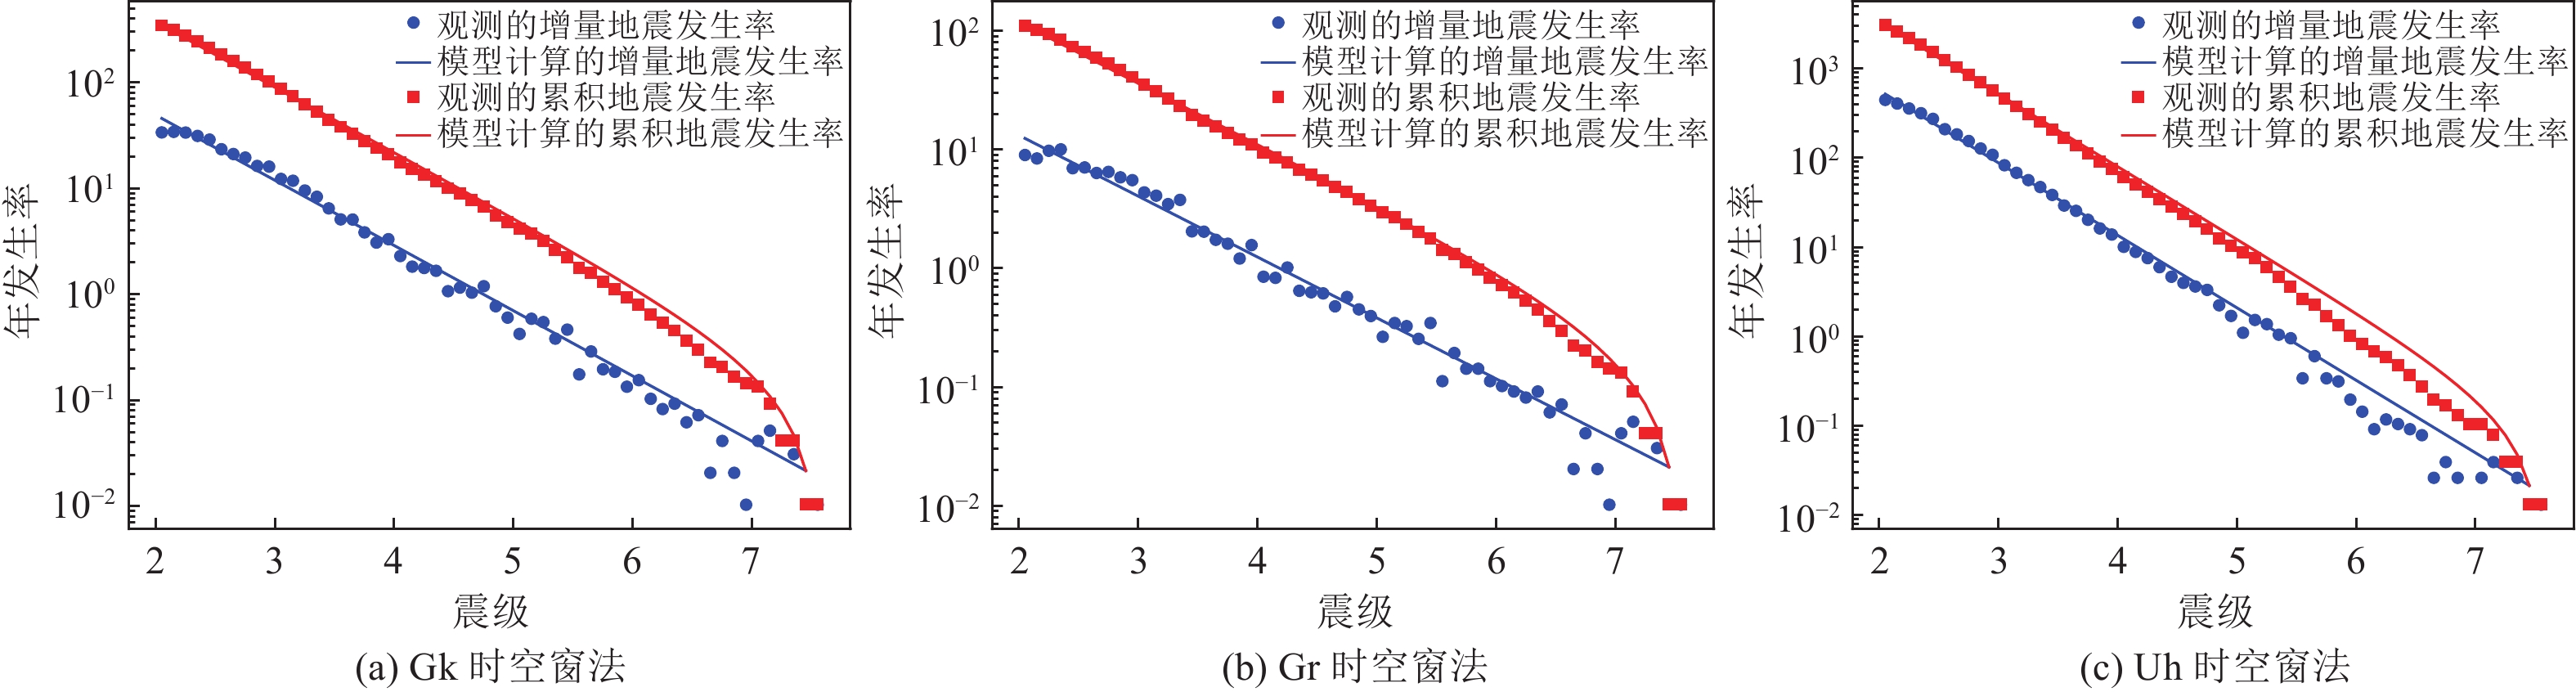
图 6 不同极大似然估计方法拟合的台湾地区地震活动性参数
Figure 6. Seismic activity parameters fitted by different maximum likelihood estimation methods
表 1 不同除丛时空窗方法计算得到的台湾地区完整性时间表
Table 1. Integrity schedule in Taiwan calculated by different declustering process
震级档 完整性起始年份 Gk时空窗 Gr时空窗 Uh时空窗 2.0~2.5 1996 2001 1991 2.5~3.0 1988 1994 1984 3.0~3.5 1981 1986 1974 3.5~4.0 1972 1976 1971 4.0~4.5 1966 1969 1969 4.5~5.0 1940 1950 1958 5.0~5.5 1926 1925 1947  下载: 导出CSV
表 2 不同极大似然估计方法计算的台湾地区地震活动性参数
Table 2. Seismic activity parameters calculated by different maximum likelihood estimation methods
下载: 导出CSV
-
李姜一,周本刚,2016. 中国东部中强地震潜在震源区地震复发概率分布. 震灾防御技术,11(1):1−10. doi: 10.11899/zzfy20160101Li J. Y., Zhou B. G., 2016. Recurrence interval probability distribution of moderate-strong earthquakes in potential seismic source of east China. Technology for Earthquake Disaster Prevention, 11(1): 1−10. (in Chinese) doi: 10.11899/zzfy20160101 徐伟进,李雪婧,谢卓娟等,2021. 中国海域及邻区地震时间分布特征研究. 震灾防御技术,16(1):39−50.Xu W. J., Li X. J., Xie Z. J., et al., 2021. Temporal distribution characteristics of earthquakes in the China sea and adjacent areas. Technology for Earthquake Disaster Prevention, 16(1): 39−50. (in Chinese) Aki K., 1965. Maximum likelihood estimate of b in the formula logN=a-bM and its confidence limits. Bulletin of the Earthquake Research Institute, 43(2): 237−239. Arabasz W. J., Robinson R., 1976. Microseismicity and geologic structure in the northern South Island, New Zealand. New Zealand Journal of Geology and Geophysics, 19(5): 569−601. doi: 10.1080/00288306.1976.10426309 Bender B., 1983. Maximum likelihood estimation of b values for magnitude grouped data. Bulletin of the Seismological Society of America, 73(3): 831−851. doi: 10.1785/BSSA0730030831 Campbell K. W., Thenhaus P. C., Barnhard T. P., et al., 2002. Seismic hazard model for loss estimation and risk management in Taiwan. Soil Dynamics and Earthquake Engineering, 22(9-12): 743−754. doi: 10.1016/S0267-7261(02)00095-7 Chan C. H., Ma K. F., Shyu J. B. H., et al., 2020. Probabilistic seismic hazard assessment for Taiwan: TEM PSHA2020. Earthquake Spectra, 36(S1): 137−159. Chang S. Y., Loh C. H., Chen S. S., 1988. Distribution of seismic hazard and risk analysis of buried pipelines in Taiwan. Journal of the Chinese Institute of Engineers, 11(1): 11−23. doi: 10.1080/02533839.1988.9677037 Chang W. Y. , Chen K. P. , Tsai Y. B. , 2016. An updated and refined catalog of earthquakes in Taiwan (1900-2014) with homogenized M w magnitudes. Earth, Planets and Space, 68 (1): 45. Chen C. H., Wang J. P., Wu Y. M., et al., 2013. A study of earthquake inter-occurrence times distribution models in Taiwan. Natural Hazards, 69(3): 1335−1350. doi: 10.1007/s11069-012-0496-7 Chen K. P., Tsai Y. B., 2008. A catalog of Taiwan earthquakes (1900-2006) with homogenized Mw magnitudes. Bulletin of the Seismological Society of America, 98(1): 483−489. doi: 10.1785/0120070136 Cheng C. T., Chiou S. J., Lee C. T., et al., 2007. Study on probabilistic seismic hazard maps of Taiwan after Chi-Chi earthquake. Journal of Geoengineering, 2(1): 19−28. Cheng C. T. , Hsieh P. S. , Lin P. S. , et al. , 2015. Probability seismic hazard mapping of Taiwan. In: Beer M. , Kougioumtzoglou I. A. , Patelli E. , et al. , eds. , Encyclopedia of Earthquake Engineering. Berlin: Springer, 1−25. Cornell C. A., 1968. Engineering seismic risk analysis. Bulletin of the Seismological Society of America, 58(5): 1583−1606. doi: 10.1785/BSSA0580051583 Gutenberg B., Richter C. F., 1944. Frequency of earthquakes in California. Bulletin of the Seismological society of America, 34(4): 185−188. doi: 10.1785/BSSA0340040185 Kijko A., Smit A., 2012. Extension of the Aki‐Utsu b‐value estimator for incomplete catalogs. Bulletin of the Seismological Society of America, 102(3): 1283−1287. doi: 10.1785/0120110226 Knopoff L., Gardner J. K., 1972. Higher seismic activity during local night on the raw worldwide earthquake catalogue. Geophysical Journal International, 28(3): 311−313. doi: 10.1111/j.1365-246X.1972.tb06133.x Lin C. H., 1996. Crustal structures estimated from arrival differences of the first P-waves in Taiwan. Journal of the Geological Society of China, 39(1): 1−12. Petersen M. D. , Frankel A. D. , Harmsen S. C. , et al. , 2008. Documentation for the 2008 update of the United States National Seismic Hazard Maps. Reston: U. S. Geological Survey, 20. Petersen M. D., Shumway A. M., Powers P. M., et al., 2020. The 2018 update of the US National Seismic Hazard Model: Overview of model and implications. Earthquake Spectra, 36(1): 5−41. doi: 10.1177/8755293019878199 Schorlemmer D., Woessner J., 2008. Probability of detecting an earthquake. Bulletin of the Seismological Society of America, 98(5): 2103−2117. doi: 10.1785/0120070105 Stepp J. C. , 1971. An investigation of earthquake risk in the Puget Sound area by use of the type I distribution of largest extremes. Pennsylvania: The Pennsylvania State University. Tsai Y. B., Teng T. L., Chiu J. M., et al., 1977. Tectonic implications of the seismicity in the Taiwan region. Memoir of the Geological Society of China, (2): 13−41. Uhrhammer R. A., 1986. Characteristics of northern and central California seismicity. Earthquake Notes, 57(1): 21. Ustaszewski K., Wu Y. M., Suppe J., 2012. Crust–mantle boundaries in the Taiwan–Luzon arc-continent collision system determined from local earthquake tomography and 1D models: implications for the mode of subduction polarity reversal. Tectonophysics, 578: 31−49. doi: 10.1016/j.tecto.2011.12.029 Van Stiphout T. , Zhuang J. C. , Marsan D. , 2012. Seismicity declustering, community online resource for statistical seismicity analysis. 1-25. doi: 10.5078/corssa-52382934. http://www.corssa.org . Wang Y. J. , Chan C. H. , Lee Y. T. , et al. , 2016. Probabilistic seismic hazard assessment for Taiwan. Terrestrial, Atmospheric and Oceanic Sciences, 27 (3): 325−340. Weichert D. H., 1980. Estimation of the earthquake recurrence parameters for unequal observation periods for different magnitudes. Bulletin of the Seismological Society of America, 70(4): 1337−1346. doi: 10.1785/BSSA0700041337 Wu Y. M., Chen C. C., Zhao L., et al., 2008. Seismicity characteristics before the 2003 Chengkung, Taiwan, earthquake. Tectonophysics, 457(3-4): 177−182. doi: 10.1016/j.tecto.2008.06.007 Wyss M., 1979. Estimating maximum expectable magnitude of earthquakes from fault dimensions. Geology, 7(7): 336−340. doi: 10.1130/0091-7613(1979)7<336:EMEMOE>2.0.CO;2 Yeh Y. H. , Tsai Y. B. , 1981. Crustal structure of central Taiwan from inversion of P-wave arrival time. Bulletin of the Institute of Earth Sciences, Academia Sinica, 1 : 83−102. -

 点击查看大图
计量
- 文章访问数: 470
- HTML全文浏览量: 83
- PDF下载量: 19
- 被引次数: 0
