State of the Art of Seismic Zonation Map in United States, Site Effect Model and Basin Effect Model
-
摘要: 2018版《美国地震危险性图》对地震动模型美国中部和东部地区地震动场地效应模型及西部地区沉积盆地放大等进行了更新,改善了对美国各地地震灾害的描述,并增强了对美国中部、东部地区与西部地区地震动差异的理解。本文分析并论述了2018版《美国地震危险性图》中美国中部和东部地区地震动场地效应模型及西部地区沉积盆地效应模型的主要特征,对我国新一代地震动区划图的编制、修订进行了思考。Abstract: The 2018 US National Seismic Hazard Model has updated the site effect models of ground motion in the central and eastern United States, and the amplification effect of sedimentary basins in the western United States, improving the description of seismic disasters across the United States and the understanding of ground motion differences between the central and eastern United States and the western United States regions. In this paper, the main characteristics of the site effect models of ground motion in the central and eastern United States and the sedimentary basin effect model in the western United States are analyzed and discussed, which triggers the deliberation of seismic zonation map of next generation in China.
-
引言
1976年唐山大地震在唐山与天津地区引发了范围广、灾害重的液化震害。地震发生后,铁道部科学研究院等单位于1977、1978年对液化场地进行了钻孔勘察及静力触探测试(CPT)(刘恢先,1985)。当时使用的是单桥静力触探(以下简称“单桥CPT”)测试,在数据指标方面存在缺陷,与国际标准不接轨。单桥静力触探仅能提供比贯入阻力ps,不同的土层可能有相同的ps值,土层划分分辨率极低(孟高头等,2000)。因此,中国地震局工程力学研究所联合California Polytechnic State University及东南大学于2007年对上述唐山地区部分测点进行了现代多功能孔压静力触探(CPTU)测试(邱毅,2008;Moss等,2011)。CPTU测试在数据指标方面进行了补充,可提供锥尖阻力qc、侧壁摩阻力fs、摩阻比Rf(侧壁摩阻力fs与锥尖阻力qc的比值)及孔压u。相比单桥CPT,多了3项指标,在土层划分时分辨率较高,且有较丰富的经验和成熟的方法(刘松玉等,2013;董林等,2017,2018)。
对于CPTU测试数据,Moss等(2011)和Boulanger等(2014)先后给出了唐山地震CPT液化数据库。但是,由于CPTU测试与单桥CPT相距30年,唐山市经历了恢复重建,且改革开放后城市建设日新月异,地下水位变化及测点重新定位误差等均会影响新CPTU数据的代表性。因此,需对2007年得到的CPTU测试数据能否代表地震时的液化点与非液化点进行判断。本文对唐山大地震液化数据库进行检验,通过对比单桥CPT与CPTU测试数据沿深度的变化趋势,结合标贯击数随深度的变化趋势,判明场地力学特性是否一致。利用Robertson土质分类图,进行新CPTU数据土类分层检验,对比单桥CPT测试时钻孔柱状图,检验土层土类是否一致。通过土类筛选,并结合单桥CPT测试时标贯击数与CPTU测试锥尖阻力,选定液化层。将经过检验的液化数据库带入我国《岩土工程勘察规范》(GB 50021—2001)(中华人民共和国建设部,2004)液化判别方法,检验新CPT数据库的可信度。
1. 方法介绍
1.1 Robertson土质分类图
Robertson等(1998)基于大量现场实测数据与经验,建立了基于CPT指标的土质分类图(图1),根据摩阻比与土体细粒含量和塑性指数成正比的关系,构建了土类指数Ic,对于图1中土类2~7,Ic为5组同心圆的半径,按下式计算:
$$ {I_{\text{c}}} = {\left[ {{{\left( {3.47 - \log Q} \right)}^2} + {{\left( {1.22 + \log F} \right)}^2}} \right]^{0.5}} $$ (1) $$ Q = [\left( {{q_{\rm{c}}} - {\sigma _{{\rm{v}}}}} \right)/{P_{\rm{a}}}][{\left( {{P_{\rm{a}}}{\text{/}}\sigma _{{\rm{v}}}^{'}} \right)^n}] $$ (2) $$ F = \left[ {{f_{\rm{s}}}/\left( {{q_{\rm{c}}} - {\sigma _{{\rm{v}}}}} \right)} \right] \times 100\% $$ (3) 式中,Q为归一化锥尖阻力;F为归一化摩阻比;
$ {\sigma _{{\text{v}}}} $ 为总上覆压力;${\sigma '_{{\text{v}}}}$ 为有效上覆压力;Pa为1个标准大气压;n为应力指数。n值通过以下方法确定:首先假设n取为1.0,若计算得到Ic>2.6,则土为黏土,n取为1.0;若Ic<2.6,则n改取为0.5,重新计算Ic。若重新计算的Ic<2.6,则n为0.5;若Ic>2.6,则n取为0.7。
1.2 分层依据
由于CPTU测试与单桥CPT测试相距30年,考虑再次定位的误差、场地高程变化及地下各土层厚度沿水平方向变化的复杂性,本研究按照CPTU测试数据进行分层,将单桥CPT测试时钻孔柱状图与比贯入阻力沿深度的变化趋势作为参考。分层时首先利用锥尖阻力和比贯入阻力在砂层处突然变大、摩阻比变小(砂土摩阻比一般<2%,黏土摩阻比基本>3%)的特性确定砂层位置。表层填土由于土质不均、成分混杂,曲线振荡幅度较大、无明显规律,所以分层时不再考虑。同一土层中,锥尖阻力和摩阻比一般较均匀,所以本次主要根据摩阻比和锥尖阻力沿深度的变化趋势,结合单桥CPT测试比贯入阻力沿深度分层的趋势特征,对CPTU测试数据进行分层。对于分层时的超前滞后效应,均按照单桥CPT测试时的超前滞后效应确定。分层后求出各土层平均锥尖阻力、侧壁摩阻力及摩阻比,利用Robertson土质分类图进行各土层土类检验。
2. 液化数据库检验
CPTU测试在唐山地区共选取16个测点,其中液化点11个,非液化点5个。限于篇幅,本文仅介绍6个测点,主要体现检验CPTU数据的过程及与Moss等(2011)数据库、Boulanger等(2014)数据库的主要区别。 (1)T1液化点(唐山陡河桥,10度区,地下水位3.700 m)
T1测点数据检验结果如图2所示。单桥CPT测试比贯入阻力-深度关系曲线(ps-h曲线)和CPTU测试锥尖阻力-深度关系曲线(qc-h曲线)趋势基本一致(qc-h曲线对应ps-h曲线0~6 m段)。根据CPTU测试摩阻比-深度关系曲线(Rf-h曲线)可知,T1测点土层自上而下可分为2类,分别为细粒土和砂土土层,与单桥CPT测试时钻孔柱状图土层土类对应程度较好。根据单桥CPT测试ps-h曲线可知,深度达3 m后,ps开始增大,但深度达3.8 m后才为砂层。根据CPTU测试qc-h曲线可知,深度达4.9 m后,锥尖阻力明显增大,所以按相同的超前滞后效应确定砂层位置从深度5.7 m处开始。确定砂层后,根据锥尖阻力和摩阻比进行分层,分层结果如表1所示。分层后将各土层数据代入Robertson土质分类图进行检验,检验结果如图2(c)所示。将图2(c)检验结果与单桥CPT测试时钻孔柱状图中的土类进行对比,结果如表2所示。由表2可知,2次测试的土层土类契合度较高,说明2次测试土层条件基本一致。深度存在的差别可能是场地填高或场地范围内土层水平向厚度不同导致的。对单桥CPT测试时的标贯击数与CPTU测试的平均锥尖阻力进行综合分析,细砂层标贯击数为9,平均锥尖阻力为8.23 MPa,中砂层标贯击数为22,平均锥尖阻力为26.67 MPa,标贯击数与平均锥尖阻力随深度变化趋势基本相符,综合判断T1测点为正确点。T1测点地下水位为3.700 m,根据2次测试得到的力学指标确定液化层为埋深5.7~6.55 m的细砂层。本研究对T1测点液化层的选取与Moss等(2011)数据库、Boulanger等(2014)数据库均一致。
表 1 T1测点CPTU分层结果Table 1. CPTU soil layer classification result of site T1分层深度/m qc/MPa fs/kPa Rf /% σv /kPa σ'v/kPa n Q F/% Ic 2.40~5.70 1.72 69.16 3.73 73.03 69.60 1.0 23.71 4.19 2.79 5.70~6.55 8.23 175.64 2.36 109.78 86.01 0.5 87.56 2.16 2.18 6.55~7.15 26.67 341.91 1.40 122.69 91.82 0.5 277.04 1.29 1.68 表 2 T1测点土层土类检验结果Table 2. Soil layer inspection results of site T1序号 单桥CPT测试钻孔土类 Robertson土质分类图土类 ① 轻亚黏土(深度0.50~3.80 m) 粉质黏土-黏土(深度2.40~5.70 m) ② 细砂(深度3.80~5.65 m) 粉砂-砂质粉土(深度5.70~6.55 m) ③ 中砂(深度5.65~10.20 m) 纯净砂-粉砂(深度6.55~7.15 m) (2)T2液化点(唐山洼里,10度区,地下水位1.250 m)
T2测点数据检验结果如图3所示。单桥CPT测试ps-h曲线和CPTU测试qc-h曲线趋势不一致。由CPTU测试Rf-h曲线可知,T2测点多为细粒土土层,仅在末端存在层厚较小的砂层,与单桥CPT测试时钻孔柱状图土层土类不符。按照CPTU测试数据重新分层,结果如表3所示,将各土层数据代入Robertson土质分类图,结果如图3(c)所示。将图3(c)土类结果与单桥CPT测试时钻孔柱状图中的土类进行对比,结果如表4所示。由表4可知,2次测试各土层土类条件不一致,推测2次测试不在同一测点。综合判断T2测点为错误点,应剔除。Moss等(2011)数据库认为T2测点为正确点,本研究与Boulanger等(2014)数据库均认定T2测点为错误点。
表 3 T2测点CPTU分层结果Table 3. CPTU soil layer classification result of site T2分层深度/m qc/MPa fs/kPa Rf /% σv/kPa σ'v/kPa n Q F/% Ic 0.35~2.20 1.09 72.25 6.57 24.62 24.37 1.0 43.65 6.79 2.75 2.20~4.20 2.97 245.18 8.36 61.78 42.67 1.0 68.10 8.44 2.70 4.20~6.90 3.99 232.30 5.86 107.15 65.01 1.0 59.73 5.98 2.62 6.90~8.30 6.52 257.71 3.75 146.73 84.50 0.5 69.30 4.05 2.45 8.30~8.45 18.63 302.42 1.79 161.75 91.93 0.5 192.58 1.64 1.86 表 4 T2测点土层土类检验结果Table 4. Soil layer inspection results of site T2序号 单桥CPT测试钻孔土类 Robertson土质分类图土类 ① 亚黏土(深度0~2.3 m) 粉质黏土-黏土(深度0.35~2.20 m) ② 细砂(深度2.3~3.7 m) 极硬细砂(深度2.20~4.20 m) ③ 中砂(深度3.7~4.4 m) 粉质黏土-黏土(深度4.20~6.90 m) ④ 淤泥质亚黏土(深度4.4~5.0 m) 黏质粉土-粉质黏土(深度6.90~8.30 m) ⑤ 粉砂(深度5.0~6.8 m) 纯净砂-粉砂(深度8.30~8.45 m) (3)T3非液化点(丰南县胥各庄,10度区,地下水位1.500 m)
T3测点数据检验结果如图4所示。单桥CPT测试ps-h曲线和CPTU测试qc-h曲线趋势不一致。由CPTU测试Rf-h曲线可知,深度达6.2 m后出现砂土类土层,与单桥CPT测试时钻孔柱状图土层土类不相符。按照CPTU测试数据重新分层,结果如表5所示。分层后将各土层数据代入Robertson土质分类图,结果如图4(c)所示。将图4(c)土层土类结果与单桥CPT测试时钻孔柱状图中的土类进行对比,结果如表6所示。由表6可知,2次测试的土层土类不契合。单桥CPT测试时标贯击数与比贯入阻力值均较大,而CPTU测试的锥尖阻力均较小,标贯击数与平均锥尖阻力随深度的变化趋势不相符。综合判断,2次测试不在同一测点,T3测点为错误点,应剔除。本研究与Moss等(2011)数据库、Boulanger等(2014)数据库均认定T3测点为错误点。
表 5 T3测点CPTU分层结果Table 5. CPTU soil layer classification result of site T3分层深度/m qc/MPa fs/kPa Rf /% σv/kPa σ'v/kPa n Q F/% Ic 1.05~4.40 0.44 33.49 7.94 52.61 40.60 1.0 9.64 8.56 3.29 4.40~6.20 0.77 42.84 5.42 102.32 65.08 1.0 10.32 6.38 3.18 6.20~7.30 5.87 179.92 3.11 130.48 79.03 0.5 64.56 3.13 2.39 7.30~7.95 29.33 316.81 1.28 148.01 87.98 0.5 311.11 1.09 1.59 表 6 T3测点土层土类检验结果Table 6. Soil layer inspection results of site T3序号 单桥CPT测试钻孔土类 Robertson土质分类图
土类① 无 粉质黏土-黏土
(深度1.05~4.40 m)② 无 粉质黏土-黏土
(深度4.40~6.20 m)③ 亚黏土
(深度0.4~1.8 m)黏质粉土-粉质黏土
(深度6.20~7.30 m)④ 粉砂
(深度1.8~3.0 m)纯净砂-粉砂
(深度7.30~7.95 m)(4)T6液化点(唐山西大夫坨,10度区,地下水位1.500 m)
T6测点数据检验结果如图5所示。单桥CPT测试ps-h曲线和CPTU测试qc-h曲线趋势一致。由CPTU测试Rf-h曲线可知,T6测点土层自上而下可分为2类,分别为细粒土和砂土土层,与单桥CPT测试时钻孔柱状图土层土类对应程度好。按照CPTU测试数据重新分层,由单桥CPT测试ps-h曲线可知,深度达4.2 m后ps开始增大,但深度达4.4 m后才为砂层。由CPTU测试qc-h曲线可知,深度达4.8 m后锥尖阻力明显增大,所以按照相同的超前滞后效应确定砂层位置从深度5 m处开始。确定砂层深度后,根据锥尖阻力和摩阻比进行分层,分层结果如表7所示。分层后将各土层数据代入Robertson土质分类图,结果如图5(c)所示。将图5(c)土类结果与单桥CPT测试钻孔柱状图中的土类进行对比,结果如表8所示。由表8可知,2次测试的土层土类契合度较高,深度存在的差别可能是场地填高或场地范围内土层水平向厚度不同导致的。对比单桥CPT测试时的标贯击数与CPTU测试的平均锥尖阻力,细砂层标贯击数为15,平均锥尖阻力为17.71 MPa,中砂层标贯击数为32,平均锥尖阻力为35.30 MPa,标贯击数与平均锥尖阻力随深度的变化趋势基本相符,综合判断T6测点为正确点,液化层选为深度为5.0~6.1 m的细砂层。Moss等(2011)数据库对该测点液化层的选取与本研究一致。Boulanger等(2014)数据库将该测点液化层选为深度2.4~3.0 m,虽然该层摩阻比较小,属于砂土类,锥尖阻力较小,易液化,但与单桥CPT测试时钻孔柱状图中的土层土类无法对应,这样选取显然是错误的。
表 7 T6测点CPTU分层结果Table 7. CPTU soil layer classification result of site T6分层深度/m qc/MPa fs/kPa Rf /% σv/kPa σ'v/kPa n Q F/% Ic 0.50~2.85 3.04 60.75 3.04 32.33 30.62 0.5 54.36 2.02 2.31 2.85~5.00 2.48 67.54 4.16 75.77 52.01 0.5 33.36 2.81 2.56 5.00~6.10 17.71 164.39 1.07 106.50 66.81 0.5 215.47 0.93 1.65 6.10~7.00 35.30 384.7 1.11 125.42 75.94 0.5 403.68 1.09 1.53 表 8 T6测点土层土类检验结果Table 8. Soil layer inspection results of site T6序号 单桥CPT测试钻孔土类 Robertson土质分类图土类 ① 亚黏土(深度0~2.25m) 粉砂-砂质粉土(深度0.50~2.85m) ② 黏土(深度2.25~4.40m) 黏质粉土-粉质黏土(深度2.85~5.00m) ③ 细砂(深度4.40~5.50m) 纯净砂-粉砂(深度5.00~6.10m) ④ 中砂(深度5.50~6.50m) 纯净砂-粉砂(深度6.10~7.00m) (5)T15液化点(滦县佘庄,9度区,地下水位1.000 m)
T15测点数据检验结果如图6所示。单桥CPT测试ps-h曲线和CPTU测试qc-h曲线趋势基本一致。由CPTU测试qc-h曲线和Rf-h曲线可知,所测土层均为砂层,由于单桥CPT测试ps-h曲线和CPTU测试qc-h曲线趋势基本一致,所以按照单桥CPT测试ps-h曲线拐点进行分层,结果如表9所示。分层后将各土层数据代入Robertson土质分类图,结果如图6(c)所示,将图6(c)检验结果与单桥CPT测试时钻孔柱状图中的土层土类进行对比,结果如表10所示。由表10可知,2次测试的土层土类契合度较高,说明2次测试的土层条件基本一致。中砂层标贯击数为11,平均锥尖阻力为17.23 MPa,粉砂层标贯击数为21,平均锥尖阻力为12.66 MPa,更深的砂层标贯击数与锥尖阻力均变的较大,不易液化,标贯击数与平均锥尖阻力变化趋势基本一致。综合判断T15测点为正确点,液化层选为深度为1.4~4.8 m的粉砂层。Moss等(2011)数据库、Boulanger等(2014)数据库均将T15测点作为错误点剔除是不对的。
表 9 T15测点CPTU分层结果Table 9. CPTU soil layer classification result of site T15分层深度/m qc/MPa fs/kPa Rf /% σv/kPa σ'v/kPa n Q F/% Ic 0~0.3 5.35 36.79 0.80 2.98 2.98 0.5 309.53 0.69 1.44 0.3~1.4 17.23 126.53 0.80 17.02 17.02 0.5 417.42 0.73 1.38 1.4~4.8 12.66 97.74 0.81 60.39 39.81 0.5 199.69 0.78 1.61 4.8~6.5 23.57 212.09 0.89 109.784 64.21 0.5 292.79 0.90 1.55 6.5~6.9 34.00 319.35 0.93 130.90 75.04 0.5 390.93 0.94 1.48 表 10 T15测点土层土类检验结果Table 10. Soil layer inspection results of site T15序号 单桥CPT测试钻孔土类 Robertson土质分类图土类 ① 细砂(深度0~1.1 m) 纯净砂-粉砂(深度0~0.3 m) ② 中砂(深度1.1~2.6 m) 纯净砂-粉砂(深度0.3~1.4 m) ③ 粉砂(深度2.6~6.2 m) 纯净砂-粉砂(深度1.4~4.8 m) ④ 细砂(深度6.2~9.3 m) 纯净砂-粉砂(深度4.8~6.5 m) ⑤ 中砂(深度9.3~10.5 m) 纯净砂-粉砂(深度6.5~6.9 m) (6)T16非液化点(滦县东坨子头,9度区,地下水位3.500 m)
T16测点数据检验结果如图7所示。单桥CPT测试ps-h曲线和CPTU测试qc-h曲线趋势高度一致,所以按照单桥CPT测试土层曲线拐点对CPTU测试数据进行分层,结果如表11所示。分层后将各层数据代入Robertson土质分类图,结果如图7(c)所示。将图7(c)检验结果与单桥CPT测试时钻孔柱状图中的土层土类进行对比,结果如表12所示。由表12可知,2次测试的土层土类对应程度较高,说明2次测试的土层条件基本一致。深度存在的差别可能是场地范围内土层水平向厚度不同导致的。综合判断T16测点为正确点,临界液化层选为深度6.0~10.4 m的细砂层。Boulanger等(2014)数据库将液化层选为深度6.0~7.2 m的土层,本研究选为深度6.0~10.4 m的土层,该层细砂实际锥尖阻力较大,两端增大和减小段是出亚黏土层和进入亚黏土层的超前滞后效应造成的。
表 11 T16测点CPTU分层结果Table 11. CPTU soil layer classification result of site T16分层深度/m qc/MPa fs/kPa Rf /% σv/kPa σ'v/kPa n Q F/% Ic 0.25~1.80 1.65 55.03 3.67 18.98 18.98 0.5 37.62 3.36 2.58 1.80~2.80 11.57 132.98 1.21 42.94 42.94 0.5 175.99 1.15 1.77 2.80~3.60 11.85 113.82 1.00 60.89 60.89 0.5 151.18 0.96 1.77 3.60~6.00 1.37 22.76 2.23 91.47 78.73 1.0 16.35 1.77 2.69 6.00~10.40 25.55 234.77 0.97 160.48 114.42 0.5 237.38 0.92 1.61 10.40~11.10 1.53 43.13 4.26 213.75 142.70 1.0 9.28 3.26 3.04 11.10~12.50 14.29 138.92 1.09 235.05 153.71 0.5 113.38 0.99 1.87 12.50~15.50 1.91 35.20 1.74 277.65 174.75 1.0 9.37 2.15 2.94 15.50~15.90 33.09 334.69 0.97 309.59 190.03 0.5 237.85 1.02 1.65 表 12 T16测点土层土类检验结果Table 12. Soil layer inspection results of site T16序号 单桥CPT测试钻孔土类 Robertson土质分类图
土类① 轻亚黏土(0.2~1.5 m) 黏质粉土-粉质黏土(深度0.25~1.8 m) ② 中砂(1.5~3.0 m) 纯净砂-粉砂(深度1.8~2.8 m) ③ 粉砂(3.0~4.3 m) 纯净砂-粉砂(深度2.8~3.6 m) ④ 亚黏土(4.3~7.4 m) 黏质粉土-粉质黏土(深度3.6~6 m) ⑤ 细砂(7.4~10.2 m) 纯净砂-粉砂(深度6~10.4 m) ⑥ 亚黏土(10.2~12.1 m) 粉质黏土-黏土(深度10.4~11.1 m) ⑦ 中砂(12.1~14.1 m) 纯净砂-粉砂(深度11.1~12.5 m) ⑧ 亚黏土(14.1~16.1 m) 粉质黏土-黏土(深度12.5~15.5 m) ⑨ 细砂(12.1~14.1 m) 纯净砂-粉砂(深度15.5~15.9 m) 通过上述检验过程,本文剔除2个错误点T2、T3,剩下14个测点。其中,液化点10个,非液化点4个。
3. 液化数据库分析
根据《岩土工程勘察规范》(GB 50021—2001)(中华人民共和国建设部,2004)规定:当实测计算比贯入阻力或锥尖阻力小于液化比贯入阻力临界值pscr或液化锥尖阻力临界值qccr时,应判别为液化土,并按下列公式计算:
$$ p_{{\rm{s c r}}}=p_{{\rm{s}} 0} \alpha_{w} \alpha_{u} \alpha_{p}$$ (4) $$ q_{{\rm{c c r}}}=q_{{\rm{c}} 0} \alpha_{w} \alpha_{u} \alpha_{p}$$ (5) $$ \alpha_{w}=1-0.065\left(d_{w}-2\right) $$ (6) $$ \alpha_{\mathrm{u}}=1-0.05\left(d_{\mathrm{u}}-2\right) $$ (7) 式中,pscr、qccr分别为饱和土静力触探液化比贯入阻力临界值及锥尖阻力临界值;ps0、qc0分别为地下水深度dw=2 m、上覆非液化土层厚度(计算时应将淤泥和淤泥质土层厚度扣除)du=2 m时,饱和土液化判别比贯入阻力基准值和液化判别锥尖阻力基准值(MPa),可按表13取值,10度区基准值按规范原始文献取值(周神根,1980);αw为地下水位埋深修正系数,地面常年有水且与地下水有水力联系时取1.13;αu为上覆非液化土层厚度修正系数,对于深基础取1.0;αp为与静力触探摩阻比有关的土性修正系数,可按表14取值。
表 13 比贯入阻力和锥尖阻力基准值ps0、qc0Table 13. Liquefied reference value of specific penetration resistance and cone tip resistance参数 抗震设防烈度 7度 8度 9度 ps0/MPa 5.0~6.0 11.5~13.0 18.0~20.0 qc0/MPa 4.6~5.5 10.5~11.8 16.4~18.2 表 14 土性修正系数αp值Table 14. Values of soil property correction factor αp参数 土类 砂土 粉土 摩阻比Rf Rf≤0.4 0.4<Rf≤0.9 Rf>0.9 αp 1. 00 0.60 0.45 对于本研究通过检验的14个测点,分别针对单桥CPT测试比贯入阻力与CPTU测试锥尖阻力,分析液化可能性,建立液化数据库,如表15、16所示,液化判别结果如图8、9所示。
表 15 基于单桥CPT测试的唐山地震液化数据库Table 15. Database of ps-based liquefaction case histories in Tangshan earthquake测点 液化
情况地震
烈度/度土层
深度/mPs0/MPa dw/m du/m αw αu αp Pscr/MPa 实测Ps/MPa 液化判别 T1 液化 10 3.80~5.65 23.5 3.70 3.80 0.89 0.91 0.45 8.56 4.05 是 T4 非液化 10 2.90~3.50 23.5 1.10 2.90 1.06 0.96 0.45 10.69 19.92 否 T5 非液化 10 3.15~5.20 23.5 3.00 3.15 0.94 0.94 0.45 9.32 17.02 否 T6 液化 10 4.40~5.50 23.5 1.50 4.40 1.03 0.88 0.45 9.61 16.44 否 T7 液化 10 6.05~7.05 23.5 3.00 6.05 0.94 0.80 0.45 7.89 11.03 否 T8 液化 10 3.95~7.00 23.5 2.20 3.95 0.99 0.90 0.45 9.42 6.75 是 T9 非液化 10 6.70~8.20 23.5 1.10 6.70 1.06 0.77 0.60 11.42 17.46 否 T10 液化 9 3.00~5.50 19.0 1.45 3.00 1.04 0.95 0.45 8.41 2.98 是 T11 液化 9 0.85~3.40 19.0 0.85 0.85 1.07 1.06 0.45 9.71 7.22 是 T12-1 液化 9 1.80~3.20 19.0 1.55 1.80 1.03 1.01 0.45 8.89 2.48 是 T12-2 液化 9 3.20~10.20 19.0 1.55 1.80 1.03 1.01 0.45 8.89 4.24 是 T13 液化 9 2.00~3.80 19.0 1.05 2.00 1.06 1.00 0.45 9.08 5.30 是 T14 液化 9 1.25~2.10 19.0 1.25 1.25 1.05 1.04 0.60 12.40 8.13 是 T15 液化 9 2.60~6.20 19.0 1.00 2.60 1.07 0.97 0.60 11.78 7.06 是 T16 非液化 9 7.40~10.20 19.0 3.50 7.40 0.90 0.73 0.45 5.63 15.38 否 表 16 基于CPTU测试的唐山地震液化数据库Table 16. Database of qc-based liquefaction case histories in Tangshan earthquake测点 液化
情况地震
烈度/度土层
深度/mqc0/MPa dw/m du/m αw αu αp qccr/MPa 实测qc/MPa 液化判别 T1 液化 10 5.70~6.55 21.2 3.70 5.70 0.89 0.8150 0.45 6.92 8.23 否 T4 非液化 10 4.40~5.00 21.2 1.10 4.40 1.06 0.8800 0.45 8.89 9.49 否 T5 非液化 10 3.00~4.20 21.2 3.00 3.00 0.94 0.9500 0.45 8.47 6.94 是 T6 液化 10 5.00~6.10 21.2 1.50 5.00 1.03 0.8500 0.45 8.37 17.71 否 T7 液化 10 3.00~4.00 21.2 3.00 3.00 0.94 0.9500 0.45 8.47 4.20 是 T8 液化 10 4.75~7.40 21.2 2.20 4.75 0.99 0.8630 0.45 8.12 8.67 否 T9 非液化 10 3.30~4.80 21.2 1.10 3.30 1.06 0.9350 0.60 12.59 9.25 是 T10 液化 9 5.00~6.70 17.3 1.45 5.00 1.04 0.8500 0.45 6.85 4.93 是 T11 液化 9 1.40~2.60 17.3 0.85 1.40 1.07 1.0300 0.45 8.62 4.02 是 T12-1 液化 9 2.45~4.80 17.3 1.55 2.45 1.03 0.9775 0.45 7.83 2.57 是 T12-2 液化 9 4.80~9.40 17.3 1.55 2.45 1.03 0.9775 0.45 7.83 9.28 否 T13 液化 9 1.65~3.00 17.3 1.05 1.65 1.06 1.0175 0.45 8.41 5.42 是 T14 液化 9 1.25~2.10 17.3 1.25 1.25 1.05 1.0375 0.60 11.29 11.04 是 T15 液化 9 1.40~4.80 17.3 1.00 1.40 1.07 1.0300 0.60 11.39 12.66 否 T16 非液化 9 6.00~10.40 17.3 3.50 6.00 0.90 0.8000 0.45 5.62 25.55 否 对比表15、16可知,CPTU测试qc大于单桥CPT测试ps的测点有T1、T6、T8、T10、T12-1、T12-2、T14、T15、T16,CPTU测试测点液化层深度大于单桥CPT测试的测点有T1、T4、T6、T8、T10、T11、T12-1、T12-2。从液化判别结果来看,基于ps指标的液化判别方法判别成功率较高,因为我国规范CPT液化判别方法是利用这些数据构建的。而基于qc指标的液化判别方法判别成功率较低,将液化判别为不液化的有测点T1、T6、T8、T12-2、T15,将不液化判别为液化的测点有T5、T9,液化点整体有向右移动的趋势。
综合来看,经过30年的时间,土层液化可能性已发生较大改变,利用CPTU测试数据建立的液化数据库可靠性较低,并不能代表1976年唐山地震时的液化情况。
4. 结论
本文通过对比2次静力触探数据,利用Robertson土质分类图,进行新CPTU数据土类分层检验,将检验结果与单桥CPT测试时钻孔柱状图进行对比,发现大部分测点土层土类均能较好对应,现场测试力学指标沿深度的变化趋势较相符,仅剔除了错误点T2、T3。
对所有测点选定液化层,分别建立了基于单桥CPT测试ps指标和基于CPTU测试qc指标的液化数据库。利用我国规范CPT液化判别方法,检验了2个数据库的数据,发现基于单桥CPT测试ps指标的数据库液化点和非液化点得到了很好的区分,而基于CPTU测试qc指标的数据库判别效果较差,说明经过30年的时间,土层液化可能性已发生较大改变。因此,基于CPTU测试建立的液化数据库可靠性较低,基于该数据库对液化判别方法进行改进意义较小。
-
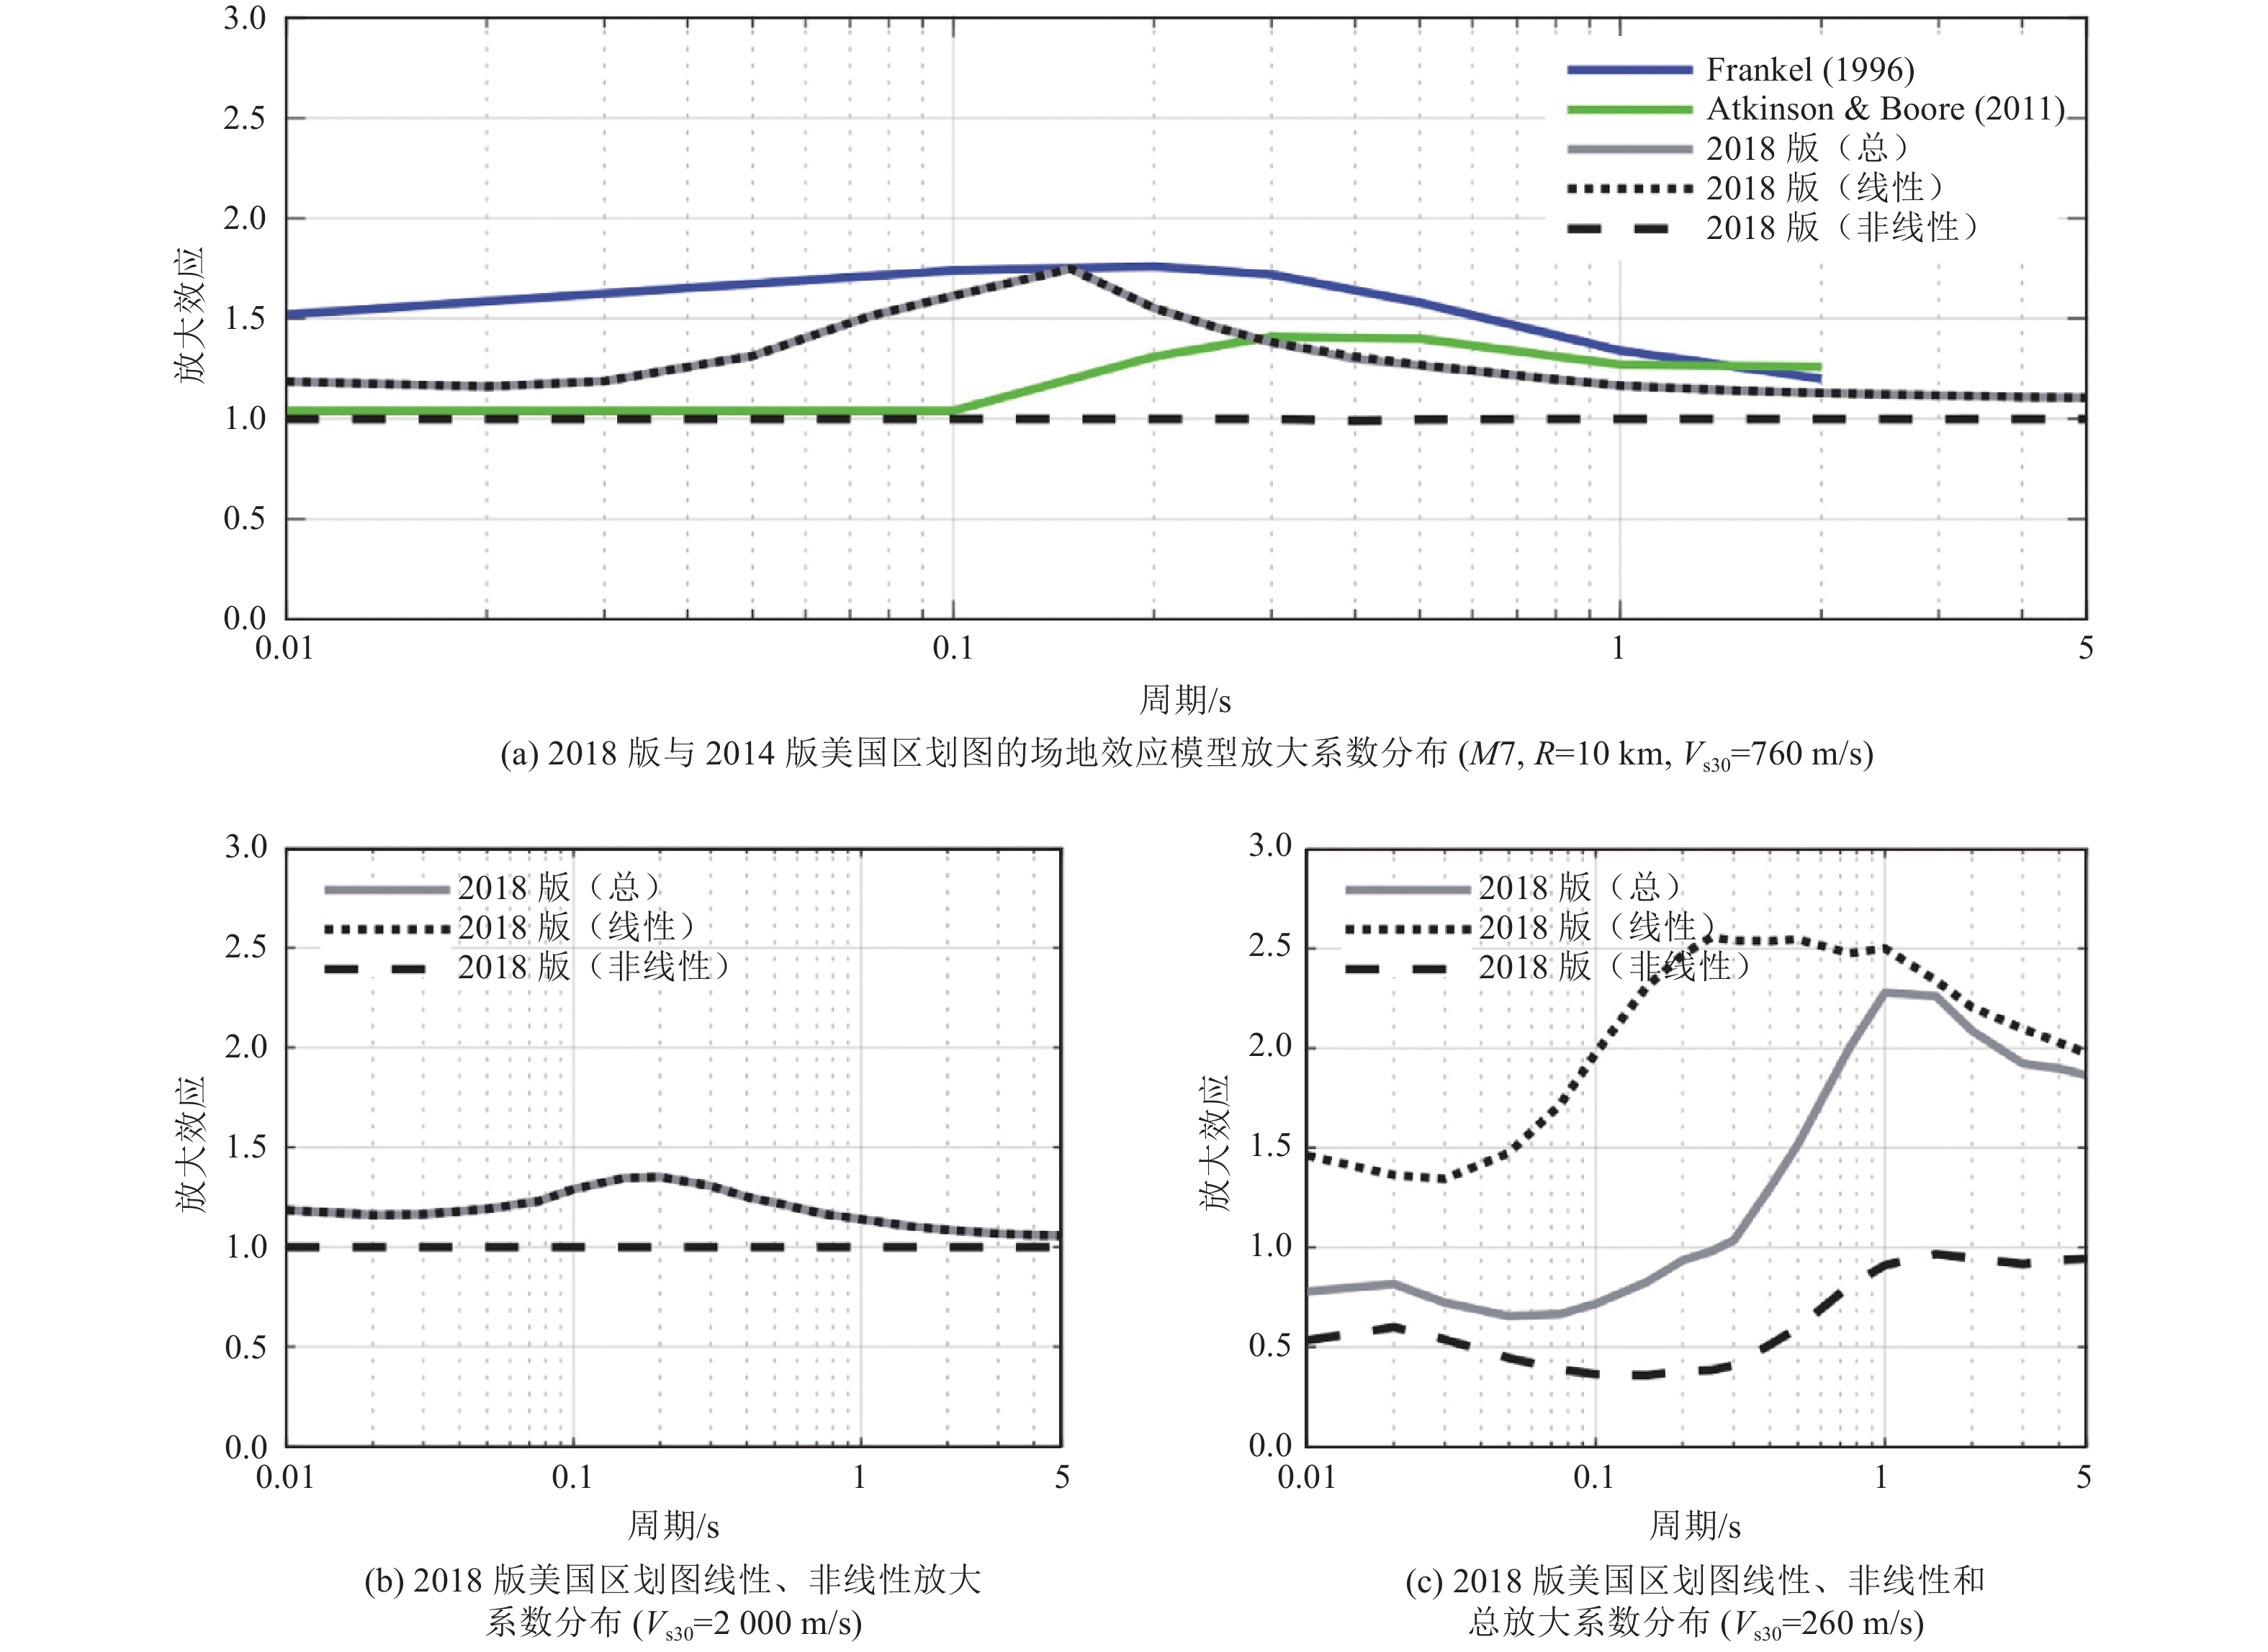
图 1 场地放大系数分布情况(Petersen等,2020)
Figure 1. Distribution of site magnification factors (Petersen et al., 2020)
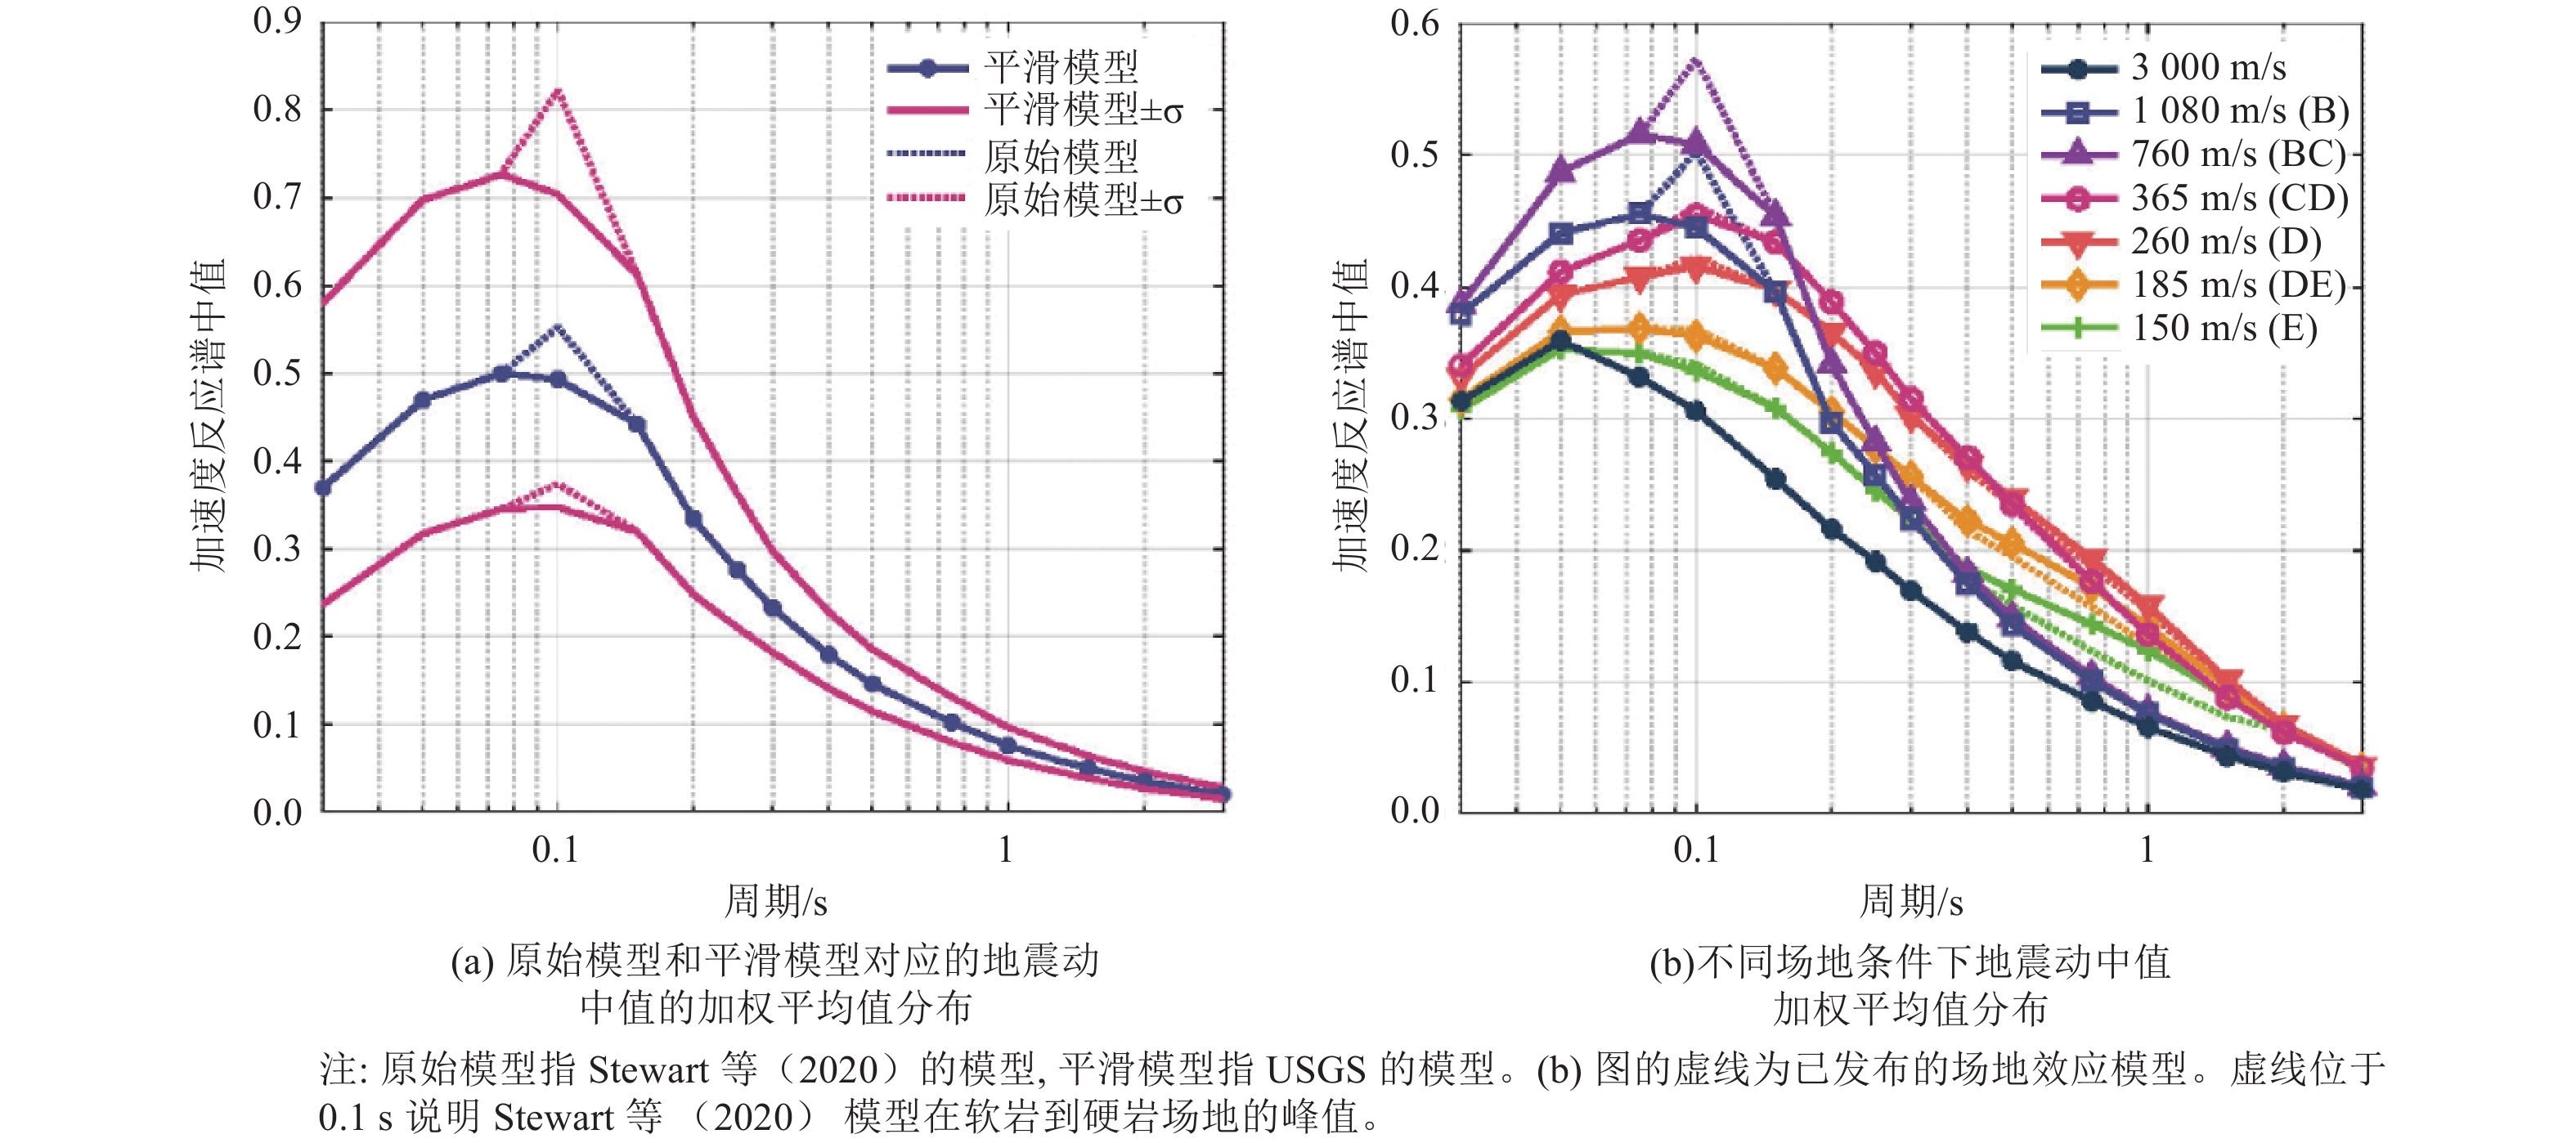
图 2 不同模型、不同场地类别条件下地震动中值加权平均值分布情况(Rezaeian等, 2021)
Figure 2. Comparison of the 2018 GMM medians at original models and smoothed models, a range of site classes (Rezaeian et al., 2021)
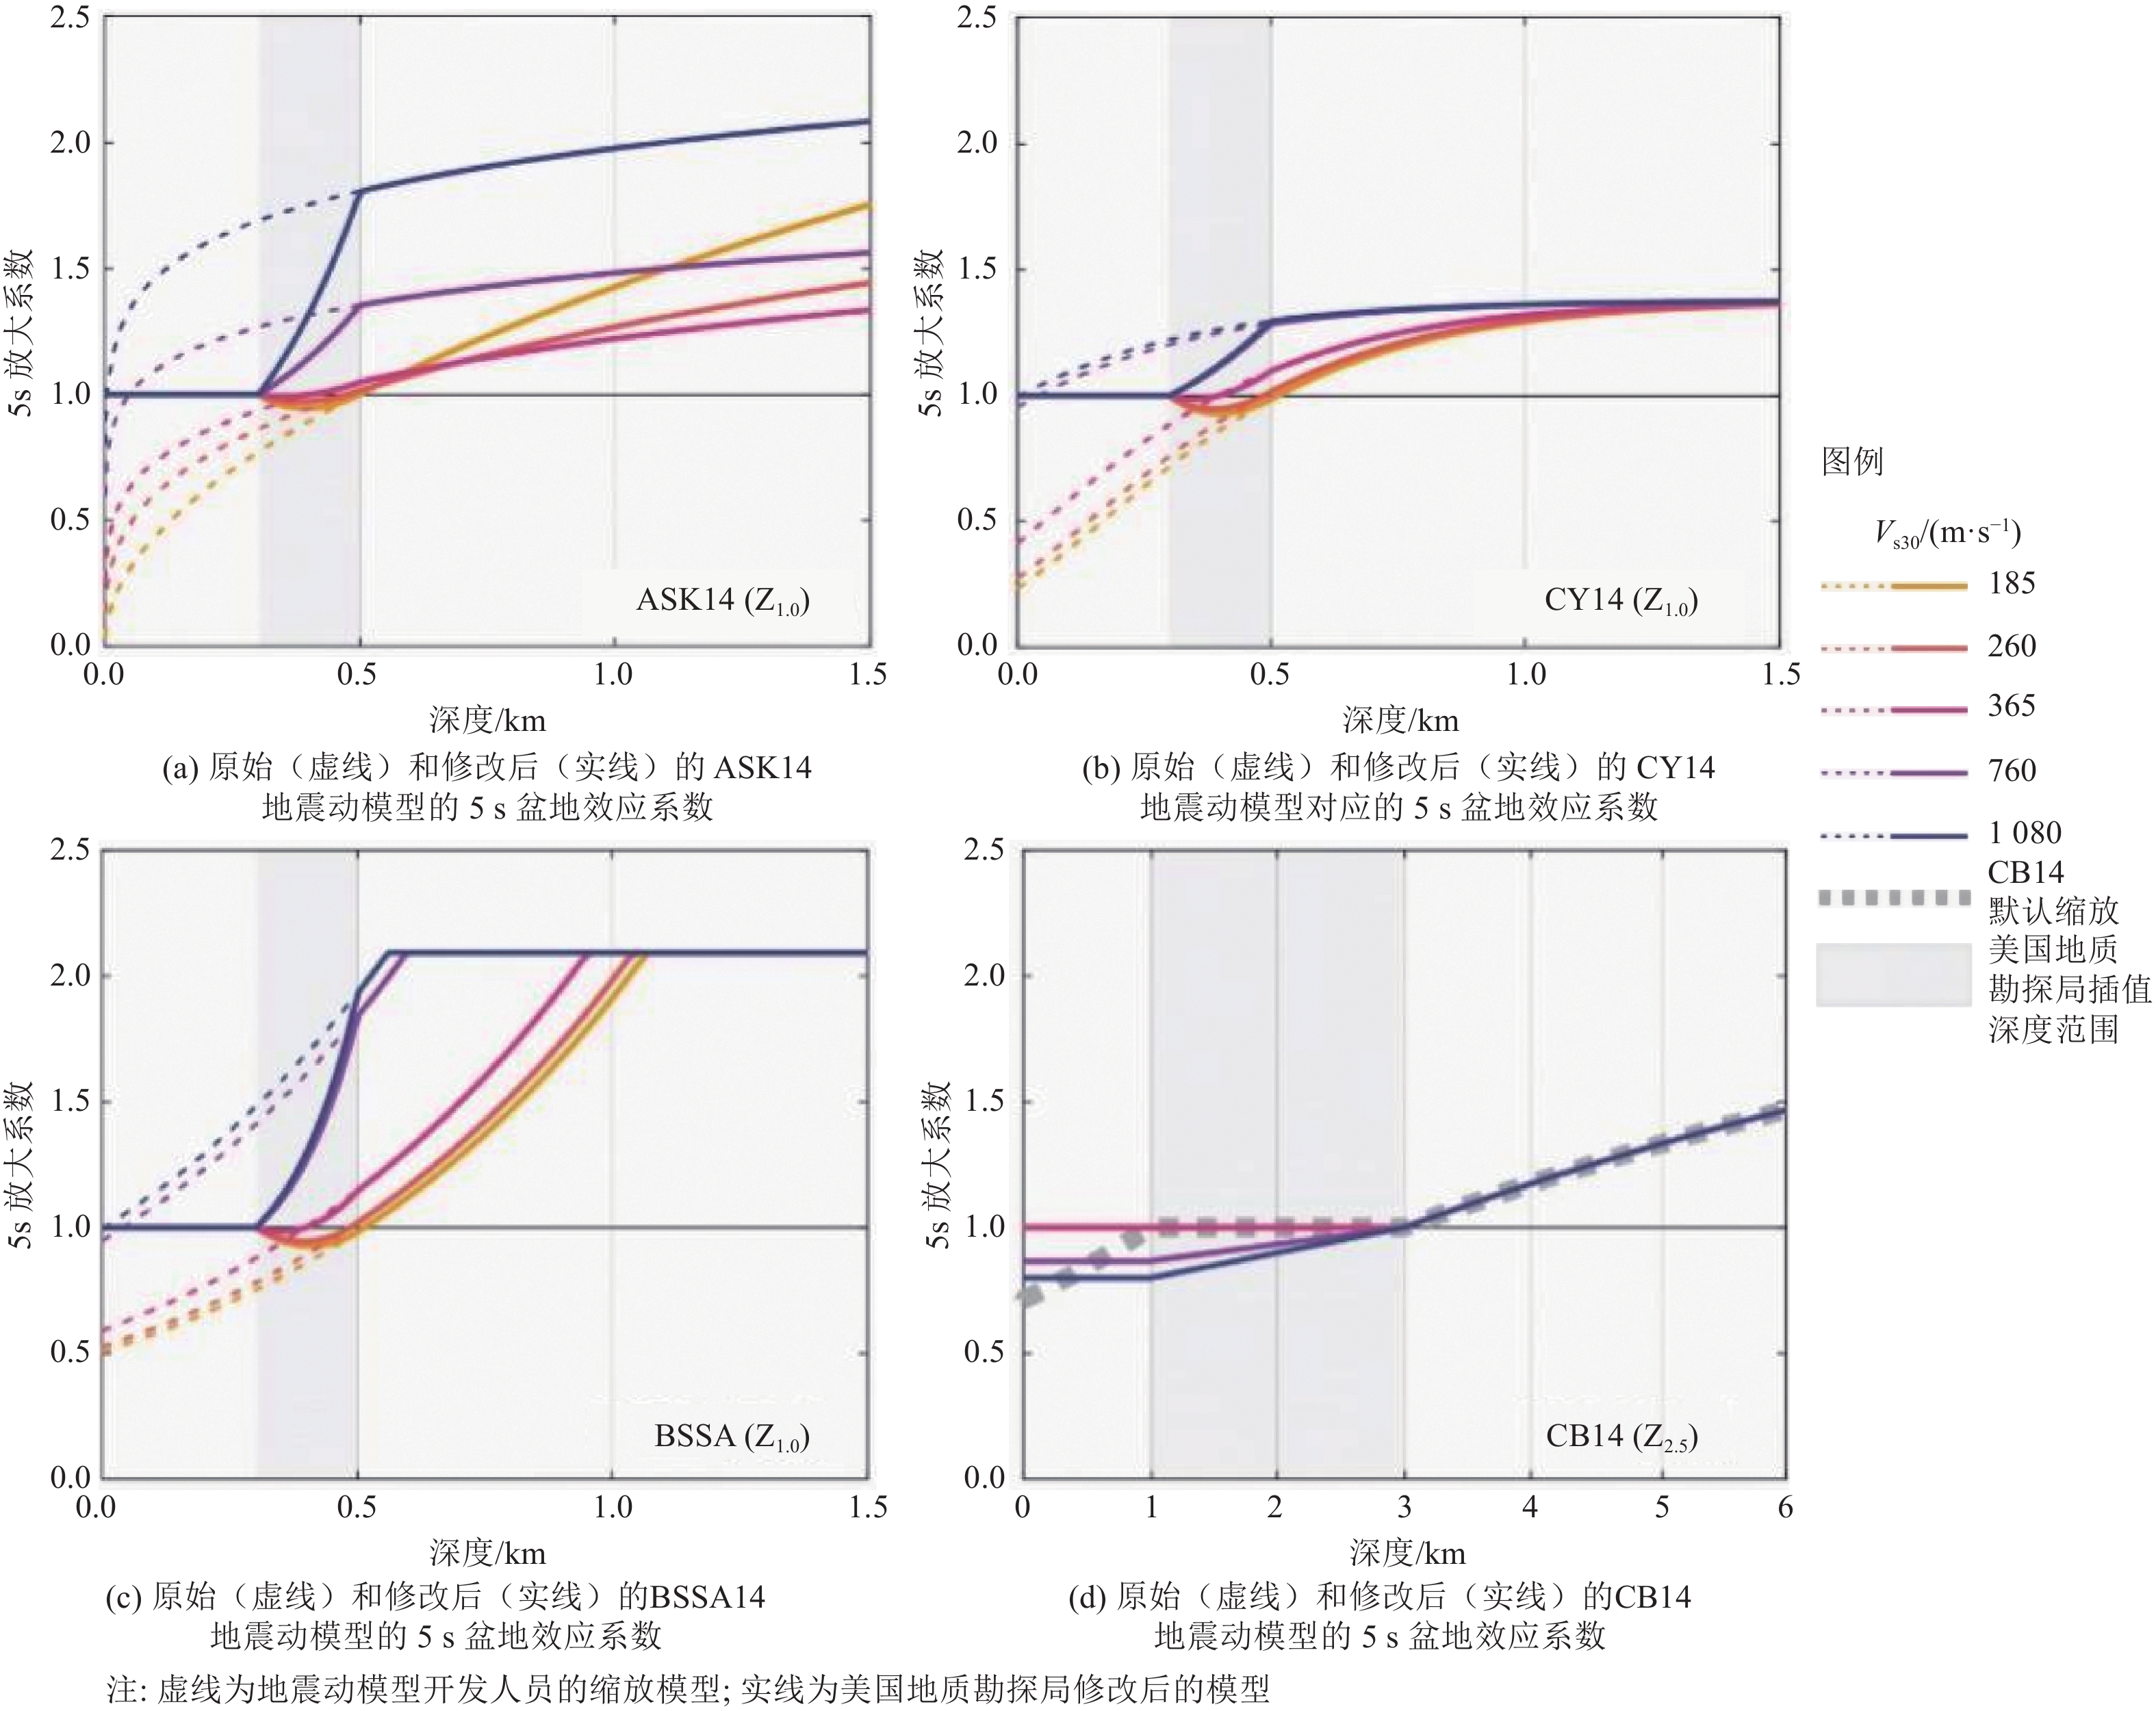
图 3 NGA-West2的4个地震动模型在T=5 s时盆地效应系数与盆地深度的关系(Powers等,2021)
Figure 3. The relationship between basin effect coefficient and basin depth at T=5 s for the four ground motion models of NGA-West2 (Powers et al., 2021)
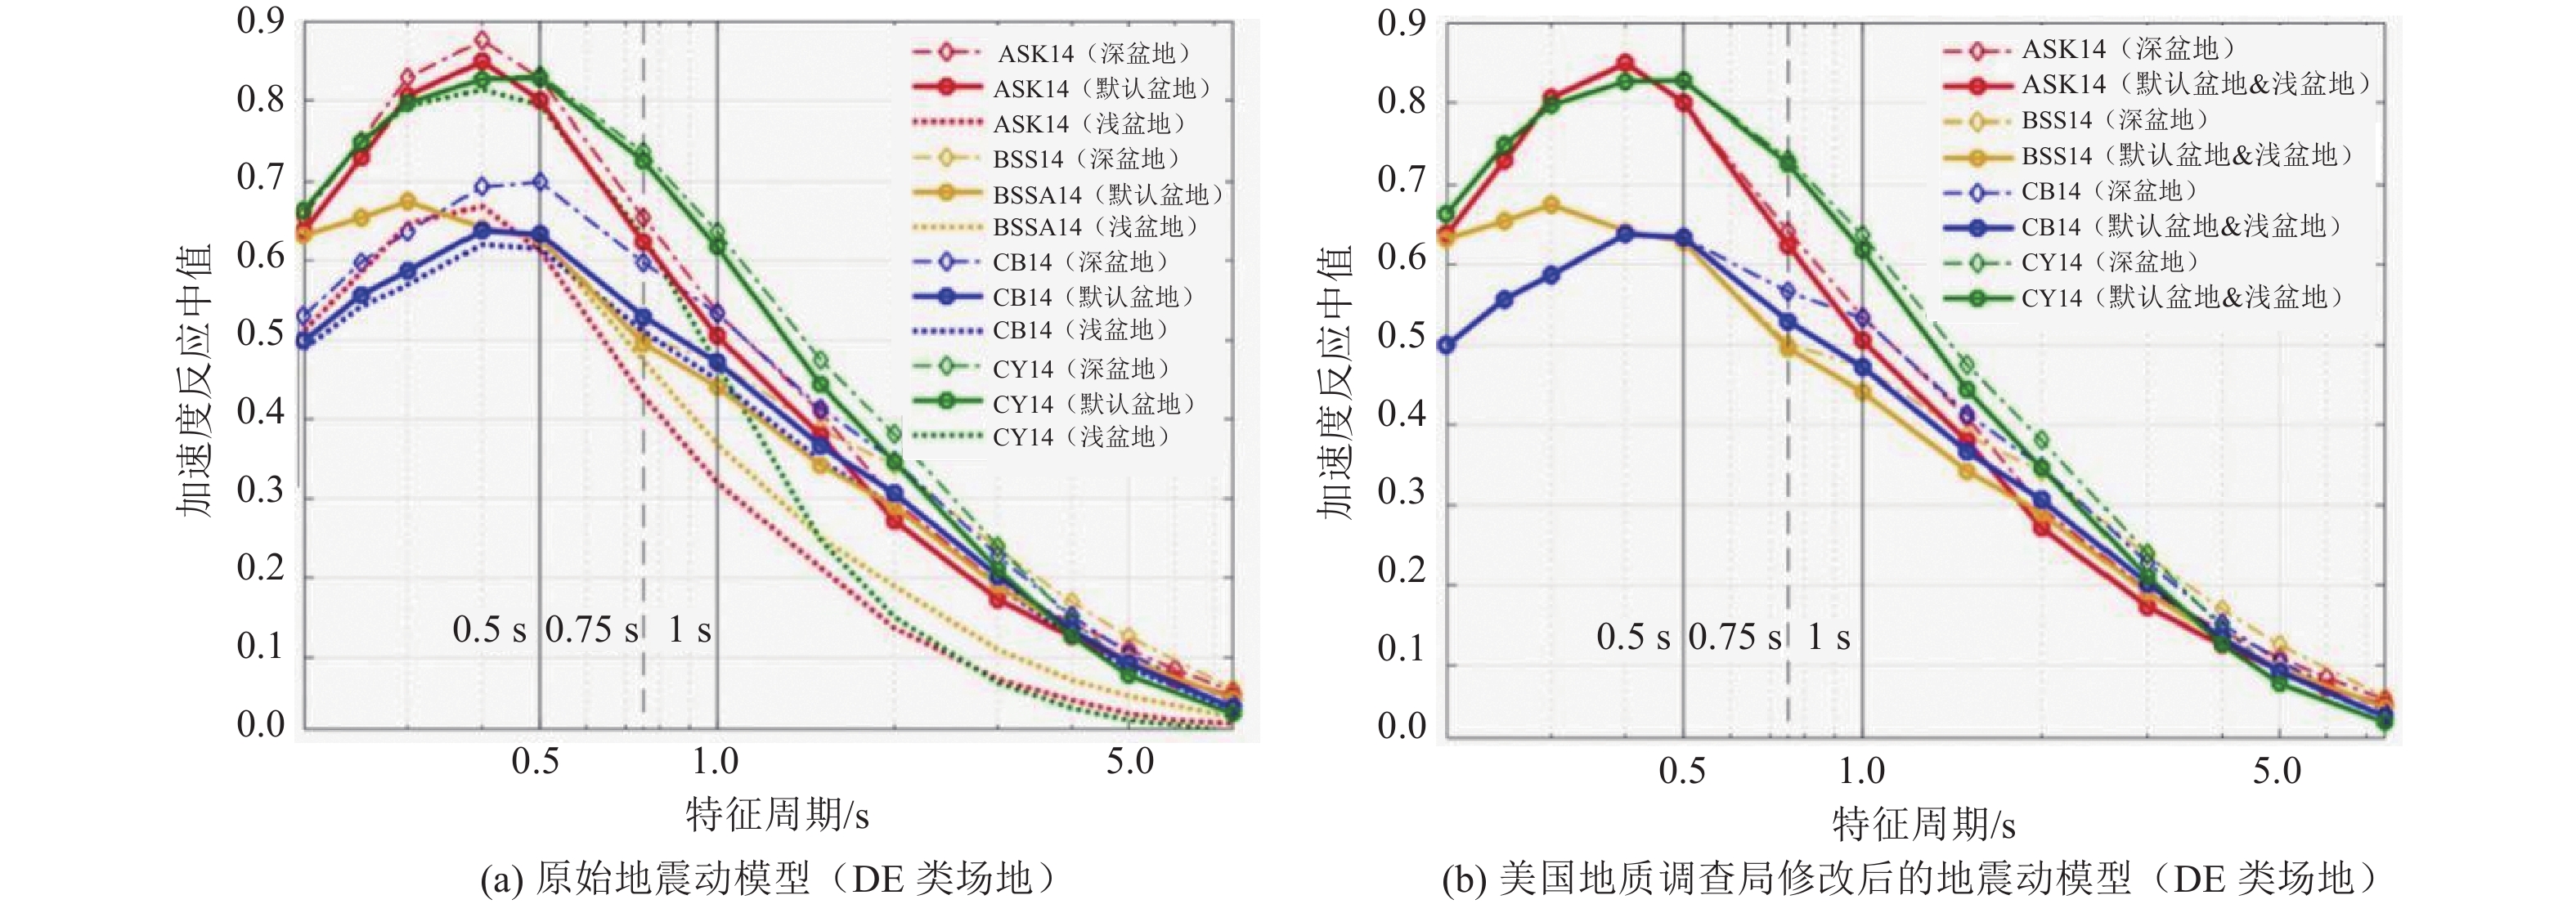
图 4 原始发布和 2018年美国地质勘探局修改后实施的地震动模型在不同盆地深度条件下对应的加速度反应谱中值对比结果(Powers等,2021)
Figure 4. The models as published and the 2018 USGS implementation of the median spectral acceleration at different basin depth conditions(Powers et al., 2021)
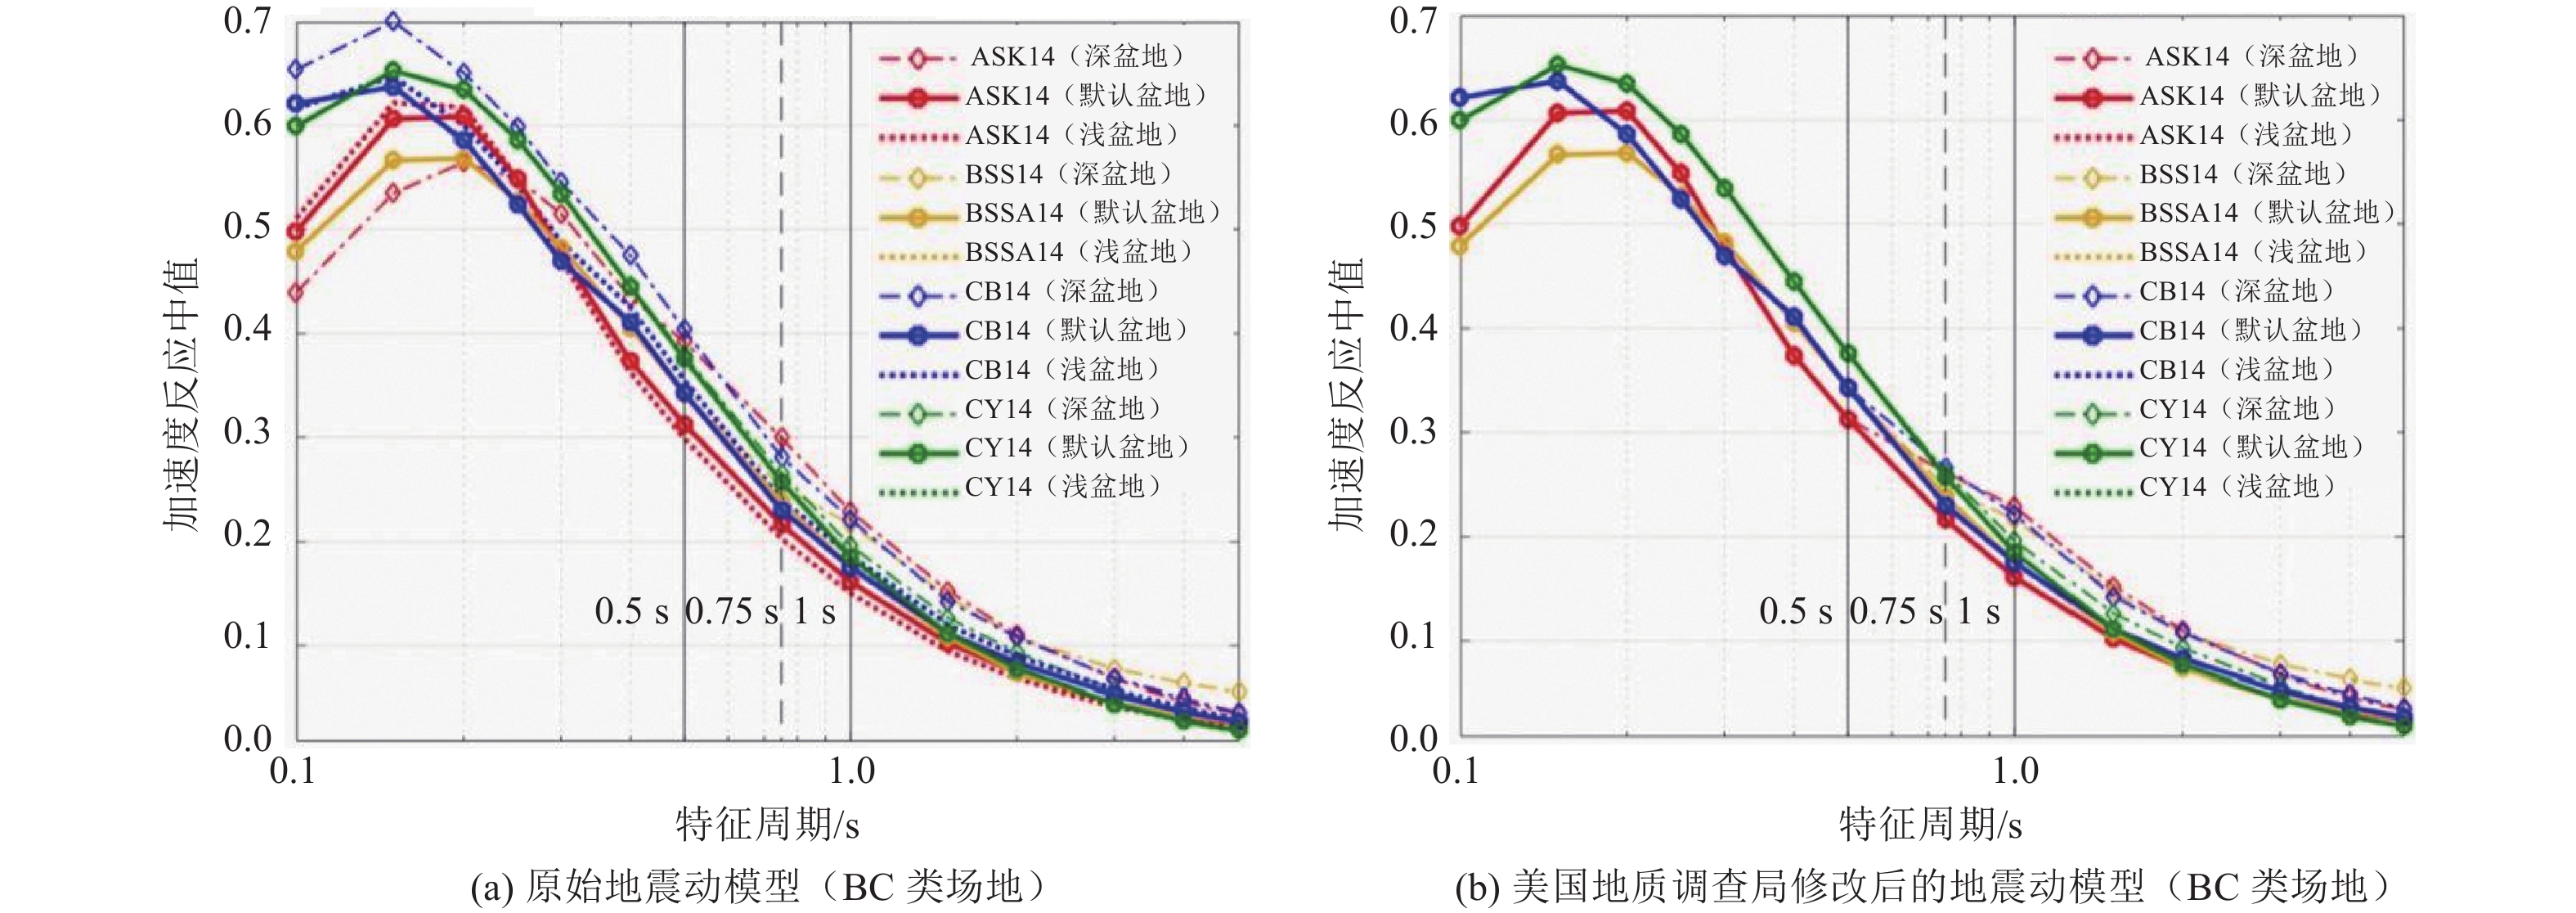
图 5 原始发布和 2018年美国地质勘探局修改后实施的地震动模型在不同盆地深度条件下对应的加速度反应谱中值对比结果(Powers等,2021)
Figure 5. The models as published and the 2018 USGS implementation of the median spectral acceleration at different basin depth conditions (Powers et al., 2021)
表 1 场地类别和盆地深度组合(Powers等,2021)
Table 1. Site class and basin-depth combinations for plots ( Powers et al., 2021)
场地类别-盆地 Vs30/(m·s−1) Z1.0/km(ASK14、BSSA14、CY14模型) Z2.5/km(CB14模型) BC类-默认盆地($ {V}_{\mathrm{s}30} $-基础) 760 (0.048,0.041,0.041) 0.607 BC类-深盆地(长滩) 760 (0.704,0.704,0.704) 3.830 BC类-浅盆地(旧金山) 760 (0.025,0.025,0.025) 0.850 DE类-默认盆地($ {V}_{\mathrm{s}30} $-基础) 185 (0.497,0.513,0.513) 3.060 DE类-深盆地(长滩) 185 (0.704,0.704,0.704) 3.830 DE类-浅盆地(旧金山) 185 (0.025,0.025,0.025) 0.850 -
中华人民共和国住房和城乡建设部, 中华人民共和国国家质量监督检验检疫总局, 2010. GB 50011—2010 建筑抗震设计规范. 北京: 中国建筑工业出版社, 18—20Ministry of Housing and Urban-Rural Development of the People’s Republic of China, General Administration of Quality Supervision, Inspection and Quarantine of the People’s Republic of China, 2010. GB 50011—2010 Code for seismic design of buildings. Beijing: China Architecture & Building Press, 18—20. (in Chinese) 周健, 李小军, 李亚琦等, 2021. 中美建筑抗震设计规范中工程场地类别的对比和换算关系. 地震学报, 43(4): 521—532 doi: 10.11939/jass.20200164Zhou J. , Li X. J. , Li Y. Q. , et al. , 2021. Comparative analysis and transformation relations between China and the US site classification systems in building seismic code provisions. Acta Seismologica Sinica, 43(4): 521—532. (in Chinese) doi: 10.11939/jass.20200164 Aagaard B. T. , Brocher T. M. , Dolenc D. , et al. , 2008. Ground-motion modeling of the 1906 San Francisco earthquake, part II: ground-motion estimates for the 1906 earthquake and scenario events. Bulletin of the Seismological Society of America, 98(2): 1012—1046. doi: 10.1785/0120060410 Abrahamson N. A. , Silva W. J. , Kamai R. , 2014. Summary of the ASK14 ground motion relation for active crustal regions. Earthquake Spectra, 30(3): 1025—1055. doi: 10.1193/070913EQS198M Algermissen S. T., Perkins D. M., 1976. A probabilistic estimate of maximum acceleration in rock in the contiguous United States. Reston: U. S. Geological Survey. Algermissen S. T., Perkins D. M., Thenhaus P. C., et al., 1990. Probabilistic earthquake acceleration and velocity maps for the United States and Puerto Rico. Reston: U. S. Geological Survey. Atkinson G. M. , Boore D. M. , 2008. Erratum to empirical ground-motion relations for subduction zone earthquakes and their application to Cascadia and other regions. Bulletin of the Seismological Society of America, 98(5): 2567—2569. doi: 10.1785/0120080108 Atkinson G. M. , Boore D. M. , 2011. Modifications to existing ground-motion prediction equations in light of new data. Bulletin of the Seismological Society of America, 101(3): 1121—1135. doi: 10.1785/0120100270 Boore D. M. , Stewart J. P. , Seyhan E. , et al. , 2014. NGA-West2 equations for predicting PGA, PGV, and 5% damped PSA for shallow crustal earthquakes. Earthquake Spectra, 30(3): 1057—1085. doi: 10.1193/070113EQS184M Campbell K. W. , Bozorgnia Y. , 2014. NGA-West2 ground motion model for the average horizontal components of PGA, PGV, and 5% damped linear acceleration response spectra. Earthquake Spectra, 30(3): 1087—1115. doi: 10.1193/062913EQS175M Chiou B. S. J. , Youngs R. R. , 2014. Update of the Chiou and Youngs NGA model for the average horizontal component of peak ground motion and response spectra. Earthquake Spectra, 30(3): 1117—1153. doi: 10.1193/072813EQS219M Frankel A. , Wirth E. , Marafi N. , et al. , 2018. Broadband synthetic seismograms for magnitude 9 earthquakes on the Cascadia megathrust based on 3 D simulations and stochastic synthetics, part 1: methodology and overall results. Bulletin of the Seismological Society of America, 108(5 A): 2347—2369. doi: 10.1785/0120180034 Frankel A. D., Mueller C. S., Barnhard T. P., et al., 1996. National seismic-hazard maps: documentation June 1996. Reston: U. S. Geological Survey. Frankel A. D. , Carver D. L. , Williams R. A. , 2002 a. Nonlinear and linear site response and basin effects in Seattle for the M 6.8 Nisqually, Washington, earthquake. Bulletin of the Seismological Society of America, 92(6): 2090—2109. doi: 10.1785/0120010254 Frankel A. D., Petersen M. D., Mueller C. S., et al., 2002 b. Documentation for the 2002 update of the national seismic hazard maps. Reston: U. S. Geological Survey. Goulet C. A., Bozorgnia Y., Abrahamson N., et al., 2018. Central and eastern North America ground-motion characterization-NGA-east final report. Berkeley: Pacific Earthquake Engineering Research Center. Graves R. , Jordan T. H. , Callaghan S. , et al. , 2011. CyberShake: a physics-based seismic hazard model for southern California. Pure and Applied Geophysics, 168(3—4): 367—381. doi: 10.1007/s00024-010-0161-6 Hartzell S. , Cranswick E. , Frankel A. , et al. , 1997. Variability of site response in the Los Angeles urban area. Bulletin of the Seismological Society of America, 87(6): 1377—1400. doi: 10.1785/BSSA0870061377 Hashash Y. M. A. , Ilhan O. , Harmon J. A. , et al. , 2020. Nonlinear site amplification model for ergodic seismic hazard analysis in central and eastern North America. Earthquake Spectra, 36(1): 69—86. doi: 10.1177/8755293019878193 Idriss I. M. , 2014. An NGA-West2 empirical model for estimating the horizontal spectral values generated by shallow crustal earthquakes. Earthquake Spectra, 30(3): 1155—1177. doi: 10.1193/070613EQS195M Moschetti M. P. , Hartzell S. , Ramírez-Guzmán L. , et al. , 2017. 3 D Ground-motion simulations of Mw7 earthquakes on the Salt Lake City segment of the Wasatch fault zone: variability of long-period (T≥1 s) ground motions and sensitivity to kinematic rupture parameters. Bulletin of the Seismological Society of America, 107(4): 1704—1723. Pacific Earthquake Engineering Research Center (PEER), 2015. NGA-east: adjustments to median ground-motion models for central and eastern North America. Berkeley: Pacific Earthquake Engineering Research Center. Petersen M. D., Frankel A. D., Harmsen S. C., et al., 2008. Documentation for the 2008 update of the United States national seismic hazard maps. Reston: U. S. Geological Survey. Petersen M. D., Moschetti M. P., Powers P. M., et al., 2014. Documentation for the 2014 update of the United States national seismic hazard maps. Reston: U. S. Geological Survey. Petersen M. D. , Shumway A. M. , Powers P. M. , et al. , 2020. The 2018 update of the US national seismic hazard model: overview of model and implications. Earthquake Spectra, 36(1): 5—41. doi: 10.1177/8755293019878199 Petersen M. D. , Shumway A. M. , Powers P. M. , et al. , 2021. The 2018 update of the US national seismic hazard model: where, why, and how much probabilistic ground motion maps changed. Earthquake Spectra, 37(2): 959—987. doi: 10.1177/8755293020988016 Powers P. M. , Rezaeian S. , Shumway A. M. , et al. , 2021. The 2018 update of the US national seismic hazard model: ground motion models in the western US. Earthquake Spectra, 37(4): 2315—2341. doi: 10.1177/87552930211011200 Rezaeian S. , Powers P. M. , Shumway A. M. , et al. , 2021. The 2018 update of the US national seismic hazard model: ground motion models in the central and eastern US. Earthquake Spectra, 37(S1): 1354—1390. Shumway A., Petersen M. D., Powers P. M., et al., 2018. Additional period and site class maps for the 2014 national seismic hazard model for the conterminous United States. Reston: U. S. Geological Survey. Stephenson W. J. , Frankel A. D. , Odum J. K. , et al. , 2006. Toward resolving an earthquake ground motion mystery in west Seattle, Washington State: shallow seismic focusing may cause anomalous chimney damage. Geophysical Research Letters, 33(6): L06316. Stewart J. P. , Parker G. A. , Atkinson G. M. , et al. , 2020. Ergodic site amplification model for central and eastern North America. Earthquake Spectra, 36(1): 42—68. doi: 10.1177/8755293019878185 期刊类型引用(1)
1. 朱国军,酆少英,袁洪克,侯黎华,秦晶晶,韩健,武泉,左莹. 利用反射地震资料研究华北地块南缘驻马店-淮滨凹陷的浅部构造特征. 地震地质. 2023(06): 1419-1431 . 百度学术
其他类型引用(1)
-