
Analysis of Monitoring Capability of Jiangsu Seismic Network Based on PMC Method
-
摘要: 江苏测震台网经近20年的高速发展,已拥有75个数字测震台站,针对江苏台网监测能力的评估需求,同时为进一步优化台网布局,提高江苏测震台网监测能力提供参考意见,本文使用基于概率的完整性震级方法,利用江苏台网2009—2021年正式编目观测报告数据,对江苏台网进行监测能力评估。研究结果表明,江苏台网监测能力较好的地区为北部连云港周边地区,监测能力达到了
$ {M}_{\mathrm{L}}\geqslant 1.0 $ ;其次为南部南京、镇江、常州及周边地区,监测能力达到了$ {M}_{\mathrm{L}}\geqslant 1.5 $ ;监测能力较差的地区为中部地区及近海海域,监测能力达到了$ {M}_{\mathrm{L}}\geqslant 2.0 $ 。整个江苏台网基本实现了$ {M}_{\mathrm{L}}\geqslant 2.0 $ 的监测能力,周边地区及中部近海海域基本实现了$ {M}_{\mathrm{L}}\geqslant 2.5 $ 的监测能力。-
关键词:
- 江苏测震台网 /
- 监测能力评估 /
- 完整性震级PMC方法
Abstract: After nearly two decades of rapid development, the Jiangsu Seismic Network has expanded to include 75 digital seismic stations. This study aims to evaluate the monitoring capabilities of the Jiangsu network and provide recommendations for optimizing the network layout and improving its monitoring effectiveness. The evaluation utilizes the Probability-based Magnitude of Completeness (PMC) method and examines the official cataloged observation report data from 2009 to 2021. The research findings indicate variations in monitoring capabilities across different regions of the Jiangsu network. The northern regions, particularly around Lianyungang, exhibit relatively robust monitoring capabilities, with a threshold of$ {M}_{{\rm{L}}} $ ≥1.0. The southern regions, including Nanjing, Zhenjiang, Changzhou, and the surrounding areas, demonstrate relatively stronger monitoring capabilities, reaching approximately$ {M}_{{\rm{L}}} $ ≥1.5. The central regions and nearshore areas exhibit lower monitoring capabilities, with a threshold of$ {M}_{{\rm{L}}} $ ≥2.0. Overall, the entire Jiangsu network has achieved a satisfactory level of monitoring capabilities for$ {M}_{{\rm{L}}} $ ≥2.0, while the surrounding areas and central nearshore regions have achieved a higher level of seismic monitoring capabilities, reaching$ {M}_{{\rm{L}}} $ ≥2.5. -
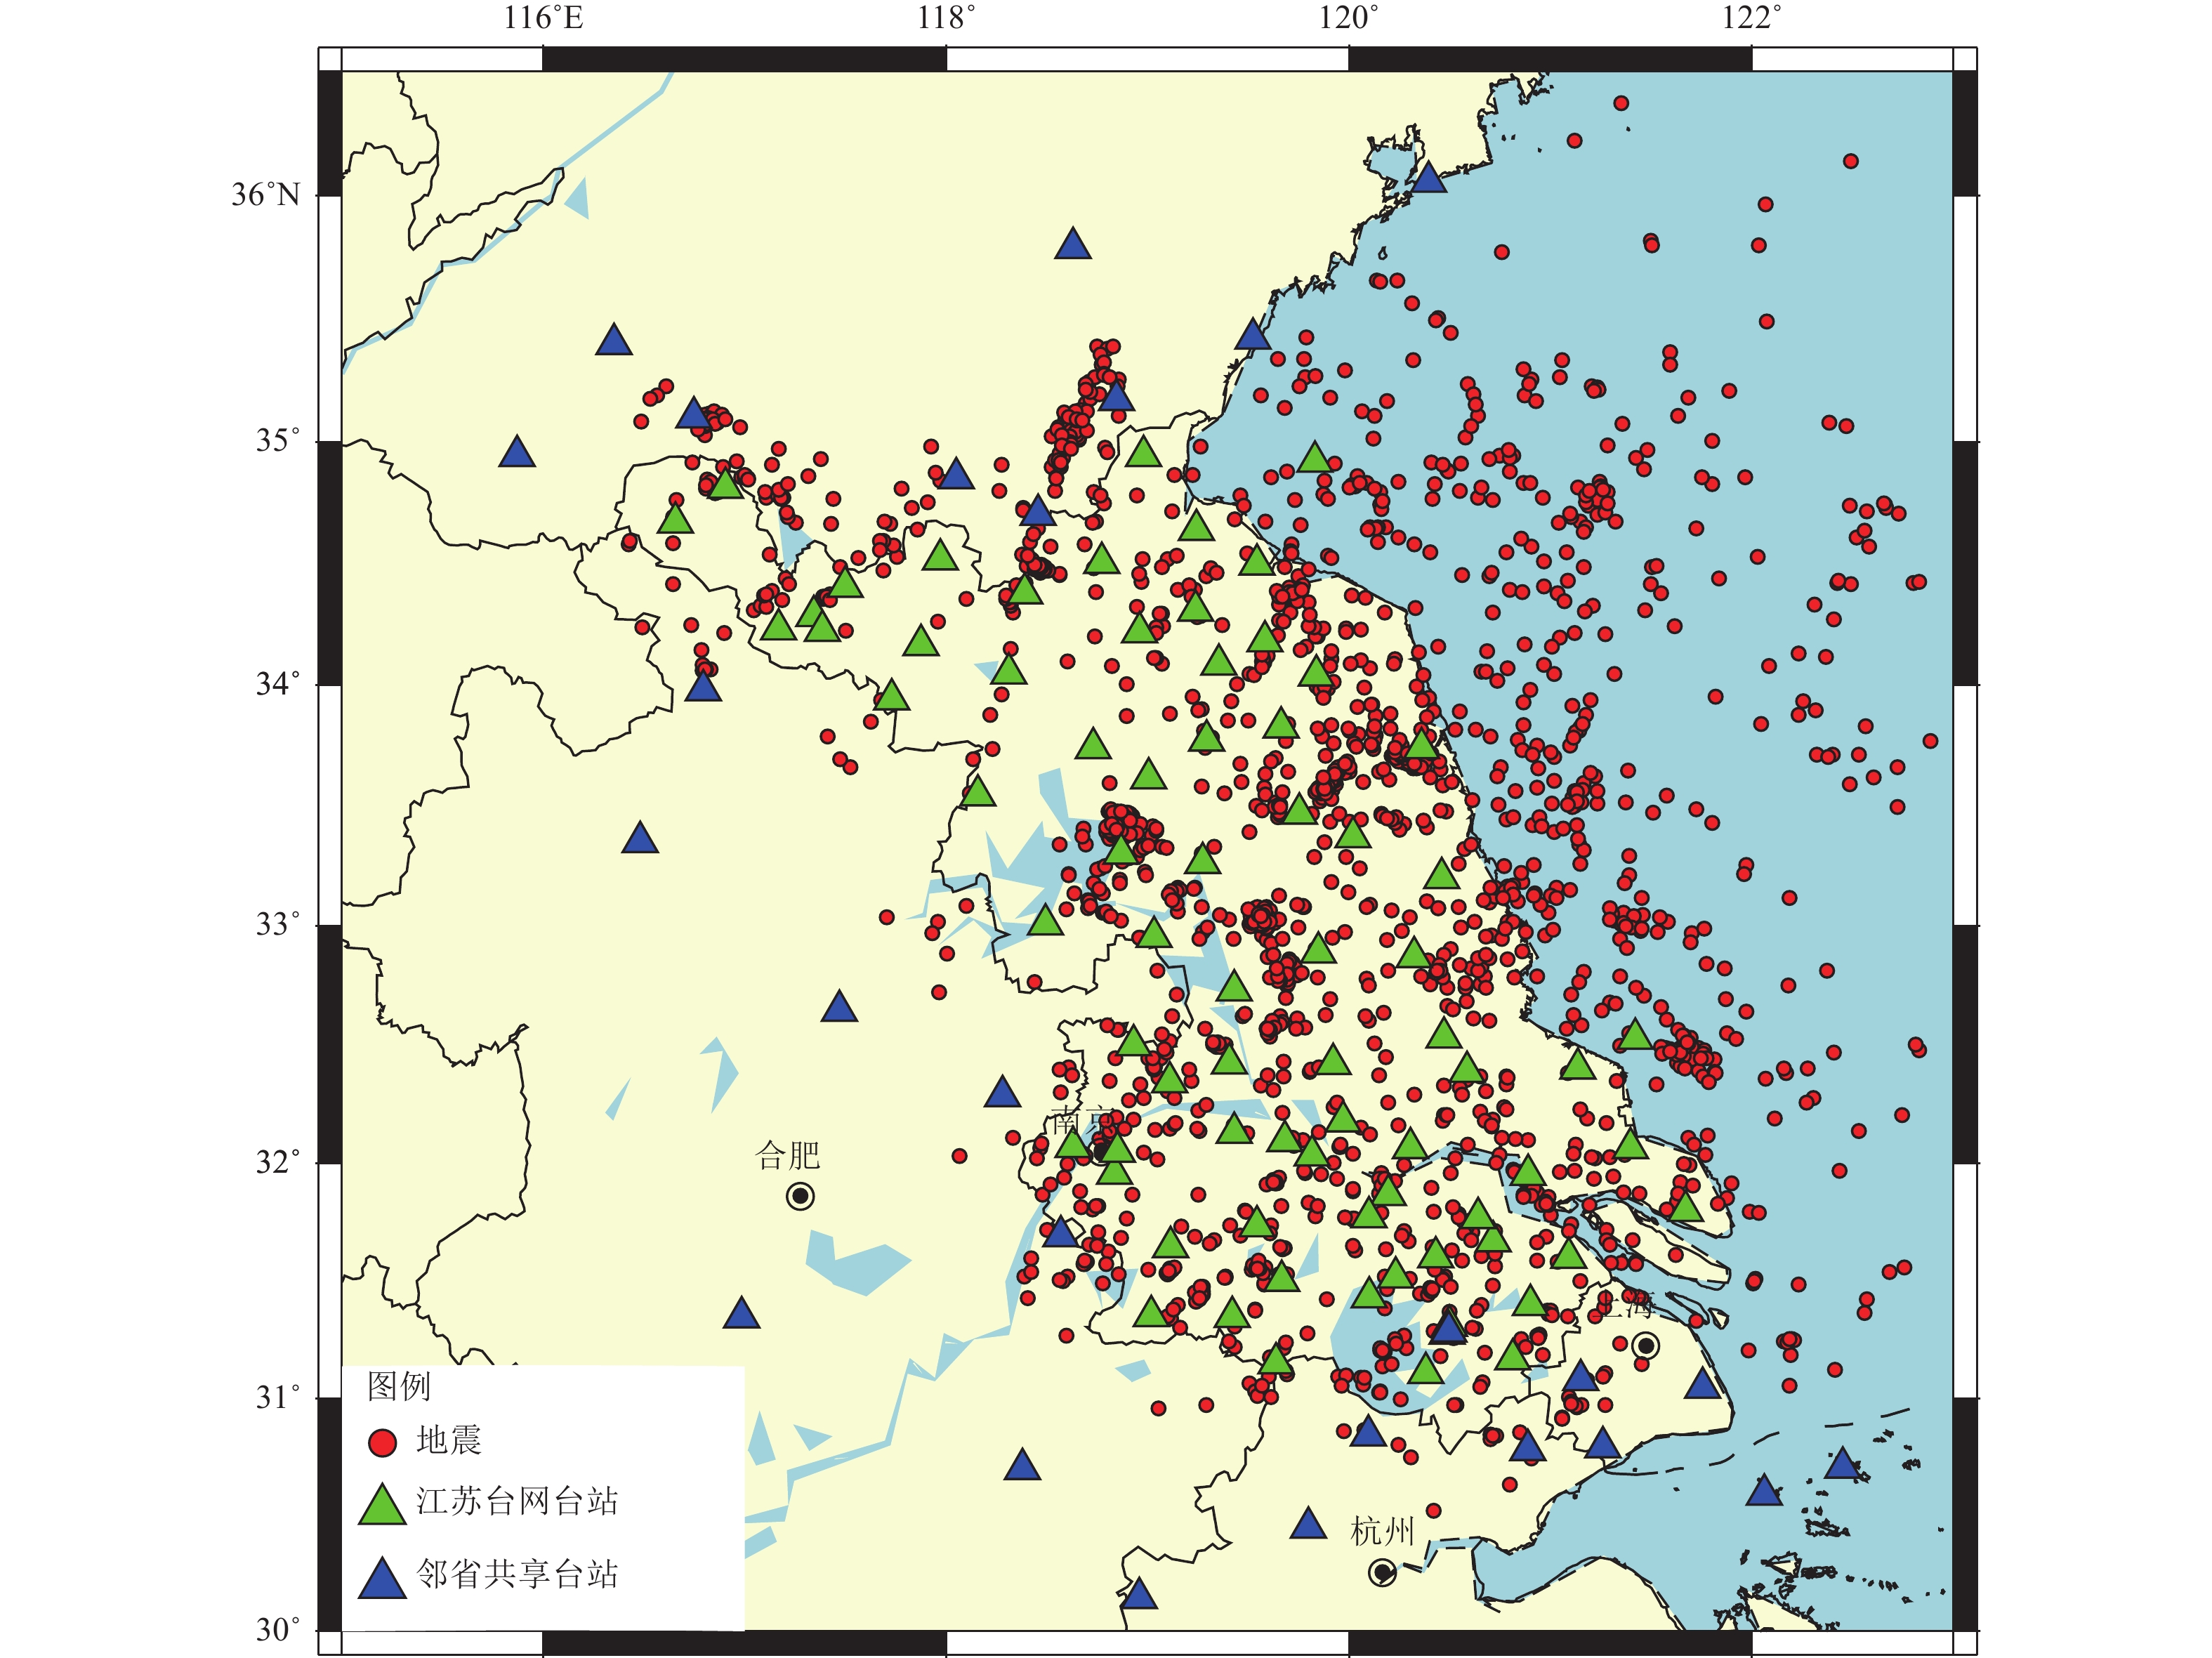
图 1 江苏及共享的邻省地震台站和2009—2021年震中分布
Figure 1. Distribution of seismic stations of Jiangsu and adjacent provinces and earthquakes occurred during 2009—2021
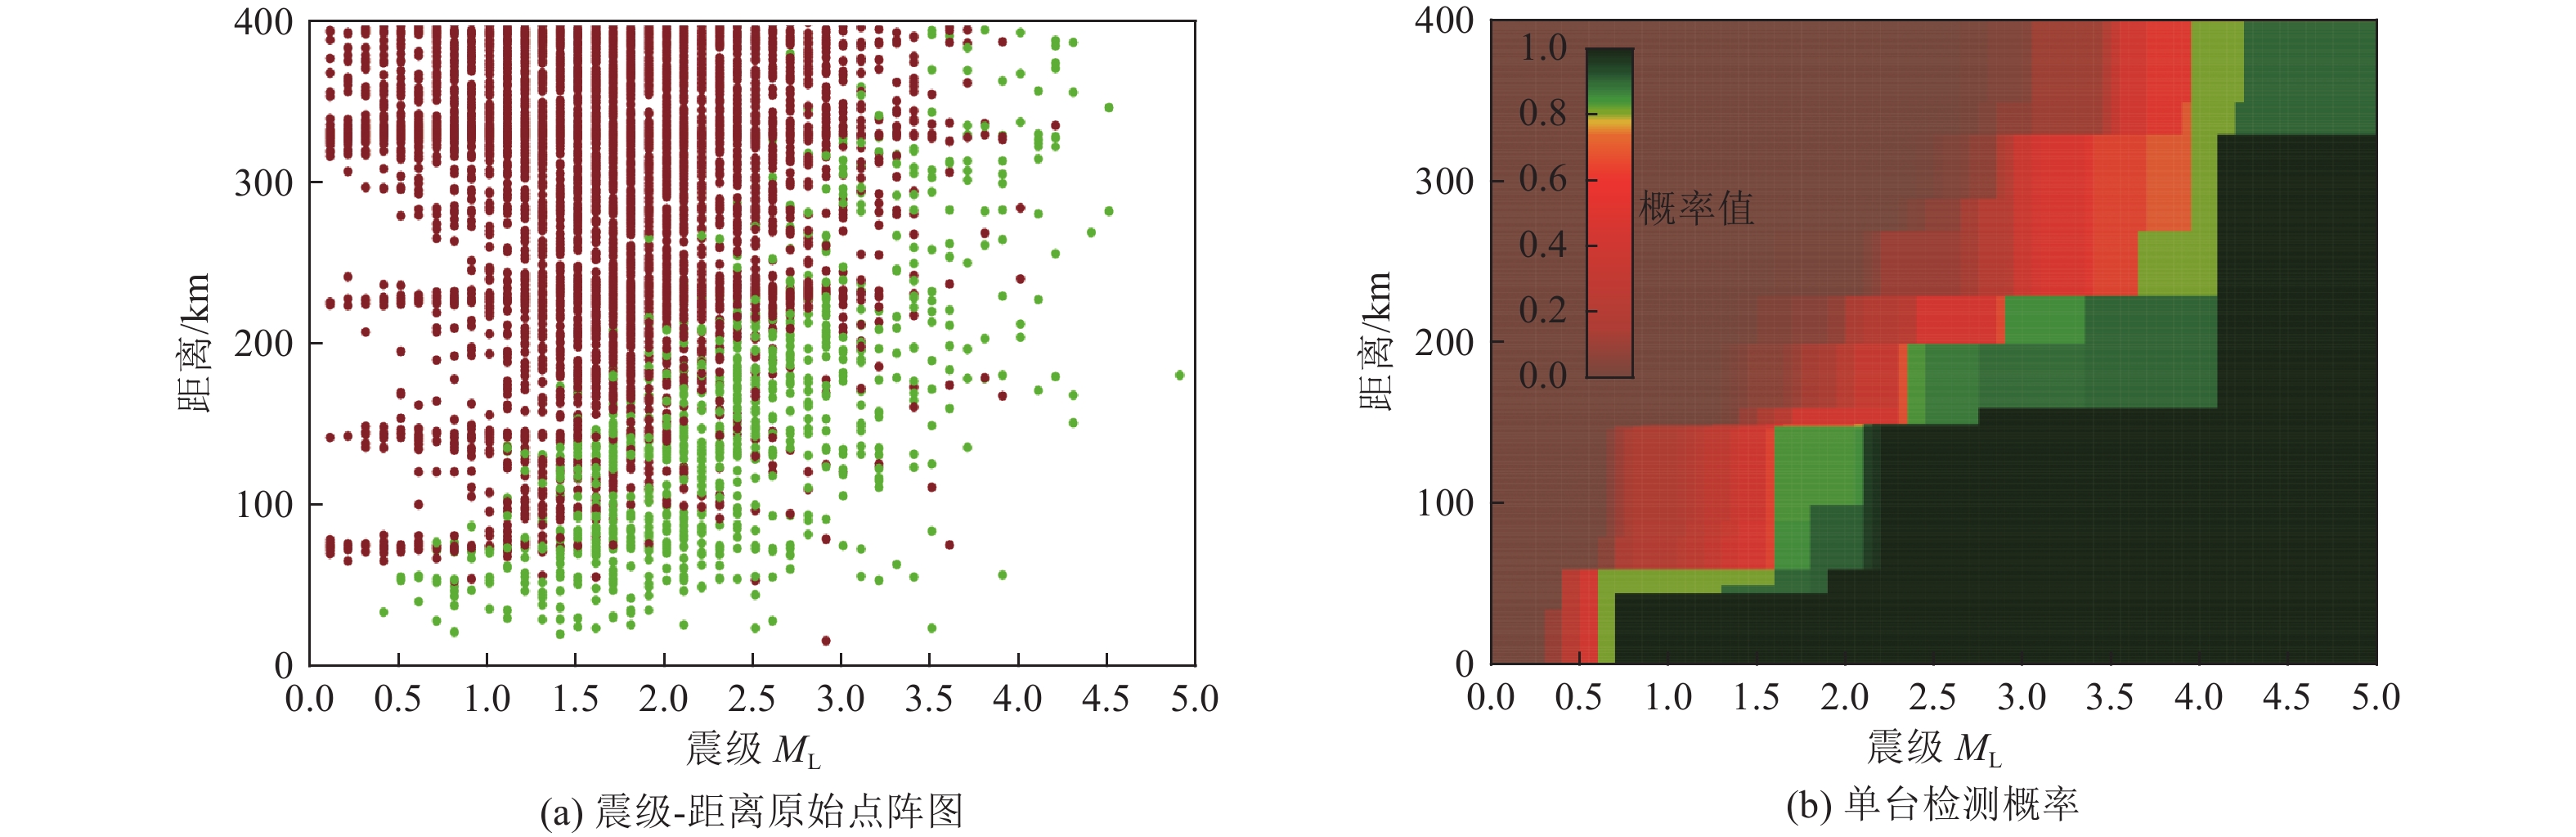
图 2 连云港台单台监测概率分布
Figure 2. Probability diagram of single station monitoring of Lianyungang station
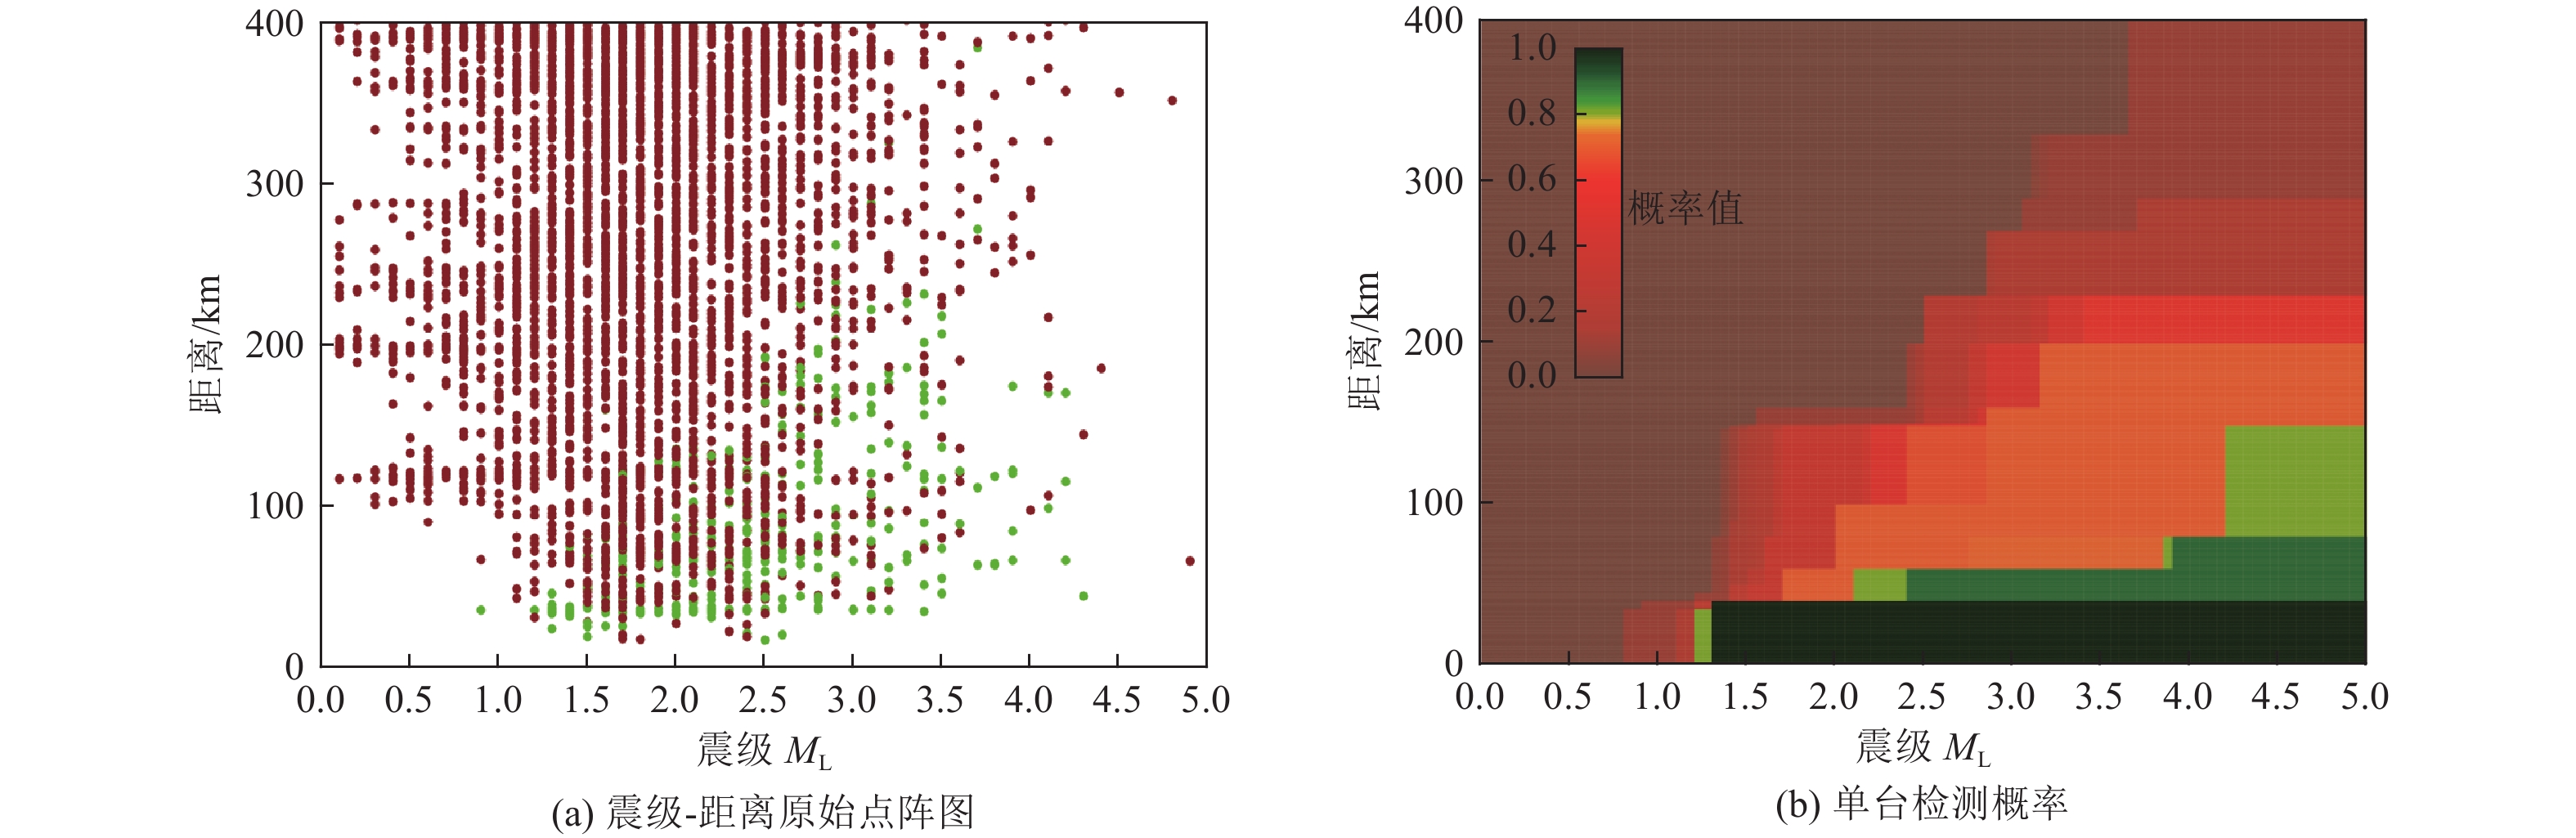
图 3 盐城台单台监测概率分布
Figure 3. Probability diagram of single station monitoring of Yancheng station

图 4 南京台单台监测概率分布
Figure 4. Probability diagram of single station monitoring of Nanjing station
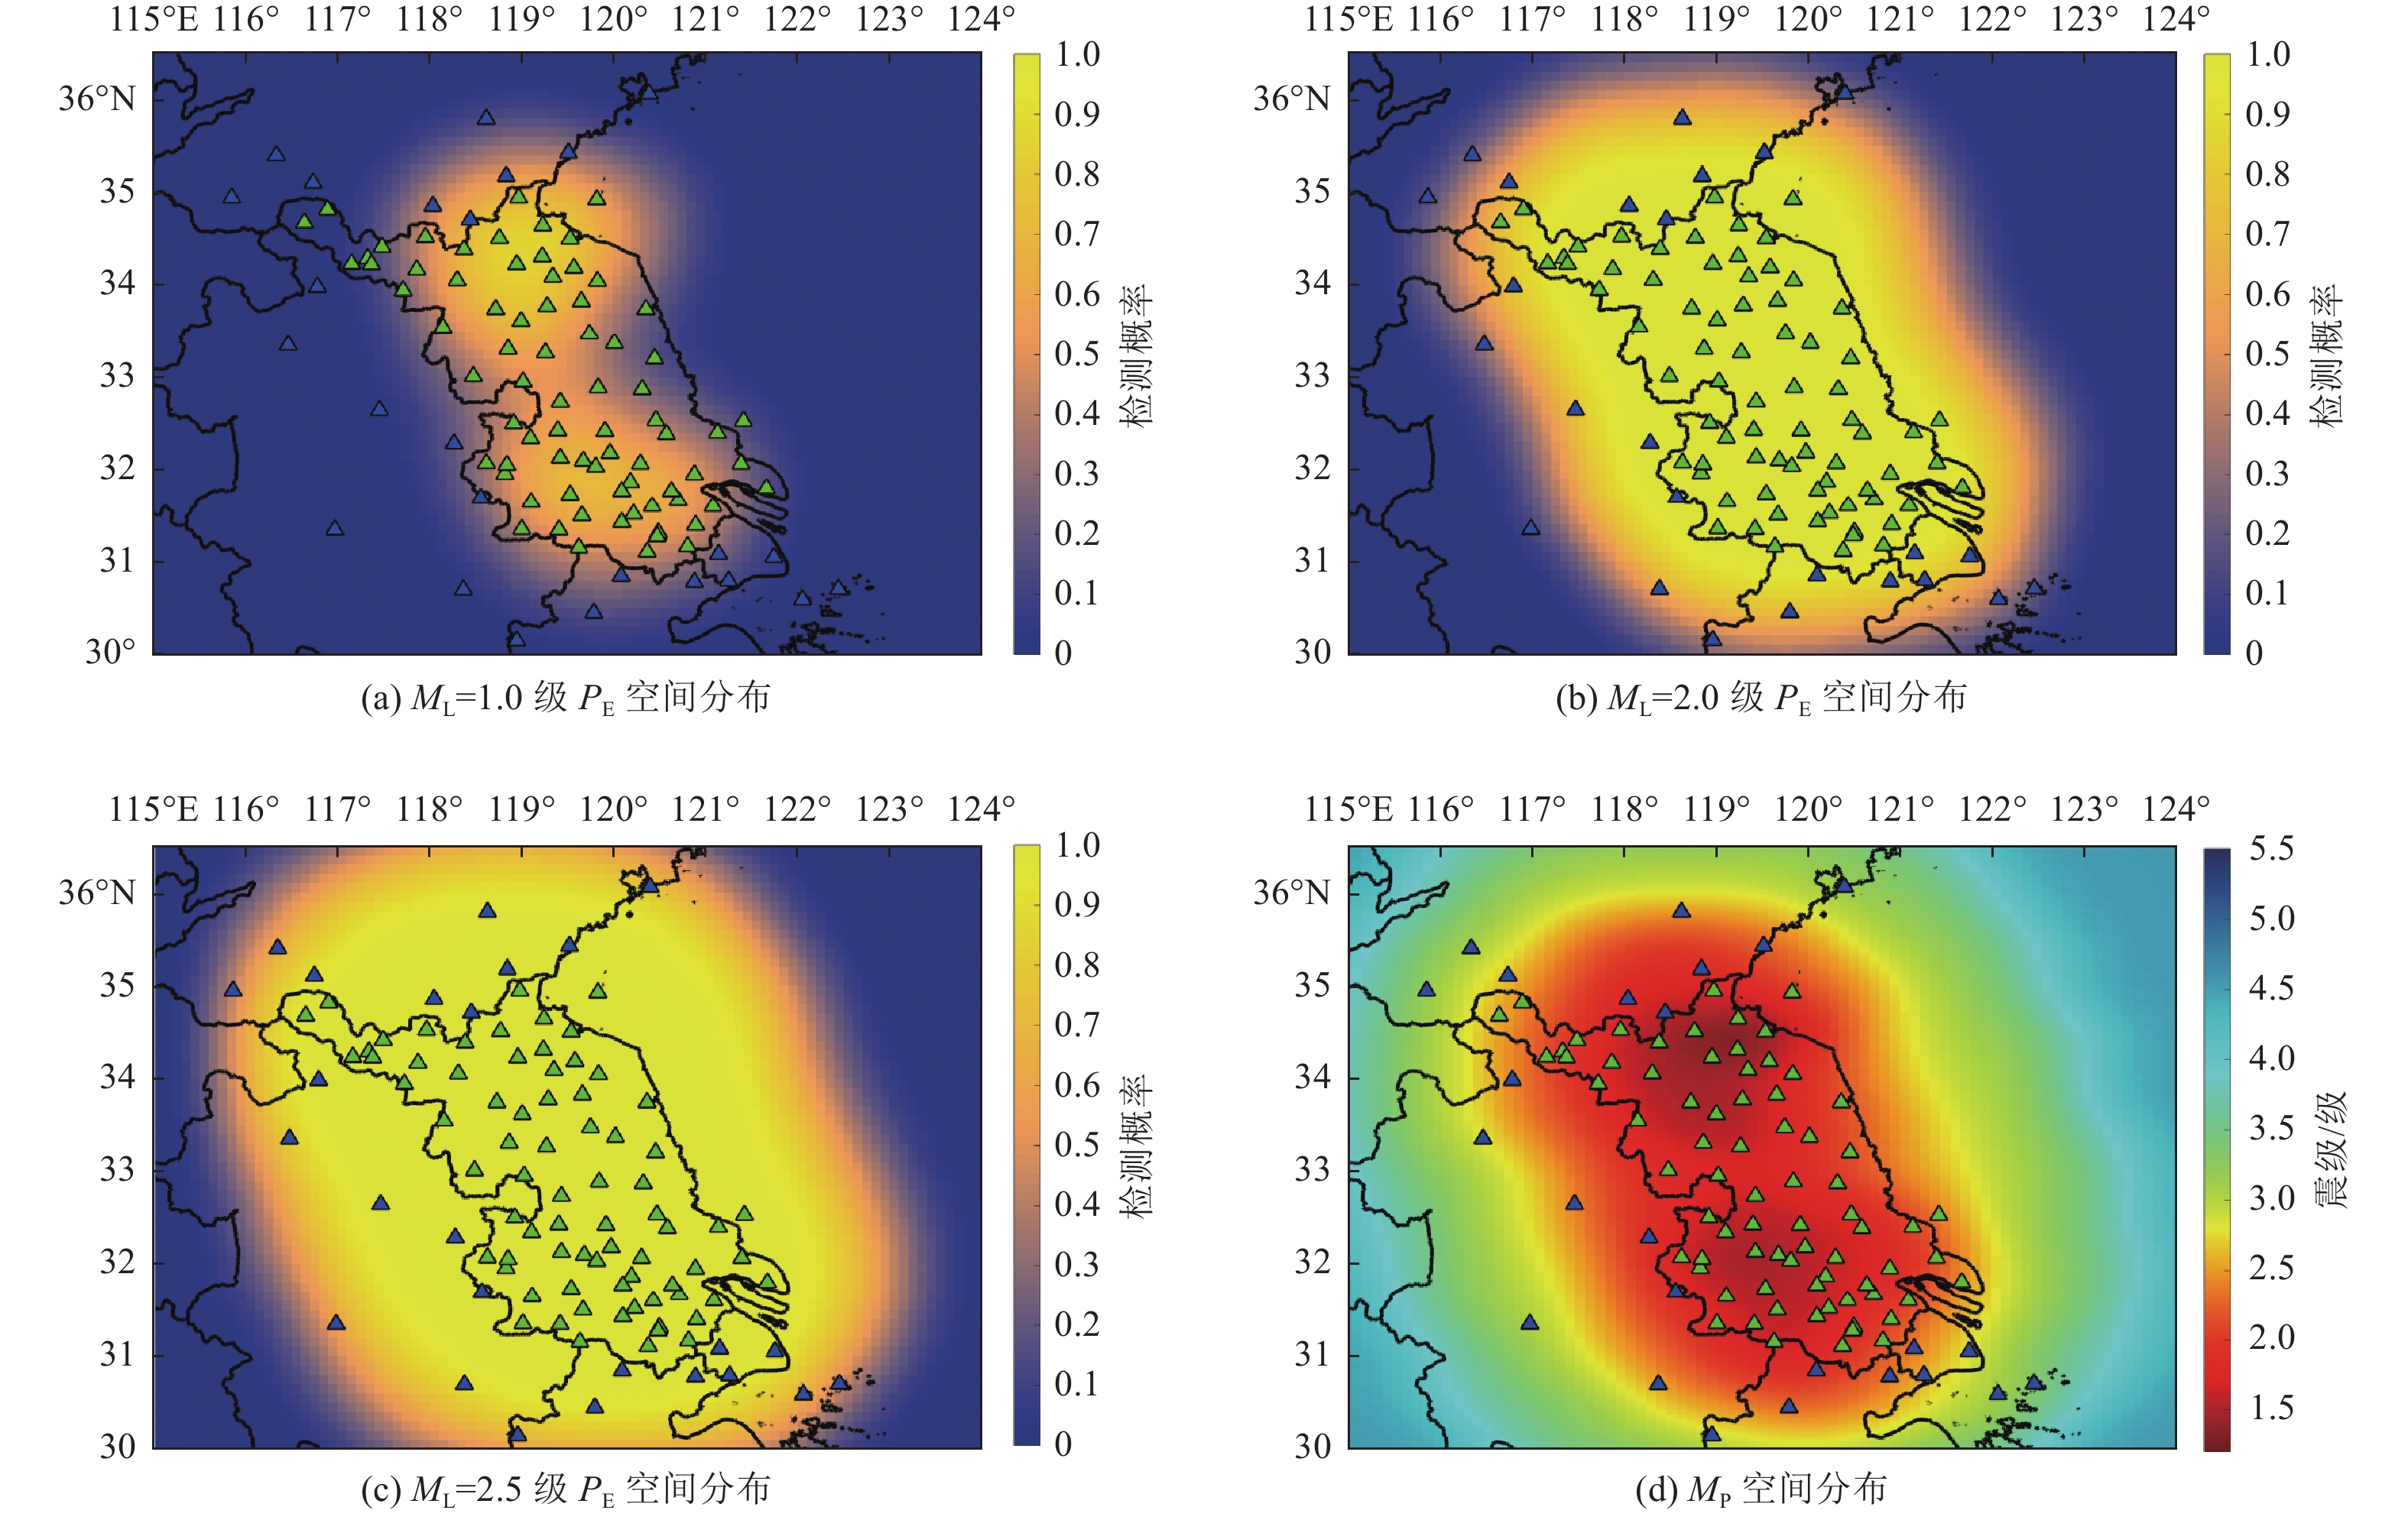
图 5
$ {P}_{\mathrm{E}} $ 与$ {M}_{\mathrm{P}} $ 空间分布Figure 5. Composite detection probability
$ {{P}}_{\mathrm{E}} $ distribution map and$ {{M}}_{\mathrm{P}} $ spatial distribution map表 1 江苏台网典型台站单台检测概率
Table 1. Statistical table of single station detection probability of typical stations of Jiangsu network
台站名称/代码 L/km
(ML=1.0、PD=100%)ML/级
(L=100 km、PD=100%)L/km
(ML=3.0、PD=100%)ML/级
(L=250 km、PD=100%)噪声级别 台基
类型常熟/CS 40 1.6 150 3.5 Ⅱ 石英砂岩 常州/CZ — 1.4 150 — Ⅲ 混合花岗岩 邳州/PZ — 1.7 150 3.8 Ⅱ 石英砂岩 徐州/XZ — 2.7 150 — Ⅰ 灰岩 东海/DH 20 1.8 150 3.5 Ⅰ 混合花岗岩 赣榆/GAY 30 1.4 150 3.3 Ⅰ 混合岩 高淳/GC 30 1.6 150 3.5 Ⅰ 紫红长石砂岩 灌云/GUY 50 2.0 150 3.2 Ⅰ 花岗片麻岩 镇江/ZJ — 2.1 150 — Ⅱ 砂岩 江宁/JN — 3.4 90 3.5 Ⅱ 砂岩 浦口/PK — — 50 — Ⅲ 灰岩 靖江/JJ — 3.1 20 — Ⅲ 石英砂岩 金坛/JT — 4.6 50 — Ⅱ 砂岩 溧水/LIS 20 2.1 150 3.6 Ⅱ 片麻岩 泗洪/SH — 2.0 150 3.3 Ⅱ 安山岩 宿迁/SQ — 2.4 150 3.6 Ⅱ 安山凝灰岩 —锡/WX 20 1.7 150 3.5 Ⅱ 石英砂岩 新沂/XIY 20 2.2 150 3.3 Ⅱ 砂岩 徐圩/XW 20 2.4 150 3.7 Ⅱ 花岗片麻岩 盱眙/XY — 1.9 100 3.7 Ⅰ 灰岩 大丰(井下)/DF — — — — Ⅲ 松散沉积层 高邮(井下)/GY — 3.9 20 — Ⅱ 松散沉积层 海安(井下)/HA — 3.2 30 — Ⅱ 松散沉积层 淮安(井下)/HUA — 2.5 150 — Ⅱ 松散沉积层 涟水(井下)/LIS — — 30 — Ⅱ 石英岩 溧阳(井下)/LY 10 2.0 150 — Ⅰ 安山玄武岩 南通(井下)/NT — — 10 — Ⅱ 石英砂岩 沛县(井下)/PX — 2.4 50 — Ⅱ 石英砂岩 启东(井下)/QD — — — — Ⅱ 混合花岗岩 如东(井下)/RD — — 50 — Ⅱ 灰岩 射阳(井下)/SY — — 20 — Ⅲ 松散沉积层 泰州(井下)/TZ — 2.9 130 — Ⅲ 沉积岩 兴化(井下)/XH — — — — Ⅲ 混合花岗岩 盐城(井下)/YC — — 60 — Ⅱ 松散沉积层 阳光岛(井下)/YGD — — — — Ⅱ 基岩 宝应(井下)/BY — 3.1 40 — Ⅱ 石英砂岩 昆山/KS — 2.5 150 — Ⅲ 灰岩 六合/LH — 2.7 150 — Ⅰ 白云岩 前三岛/QSD — — — — Ⅱ 片麻岩 宜兴/YX — 2.5 150 — Ⅰ 砂岩 南京/NJ2 — 1.9 150 3.3 Ⅱ 安山玄武岩 连云港/LYG 40 1.7 150 3.1 Ⅰ 片麻岩  下载: 导出CSV
-
安祥宇, 赵倩, 王晓睿等, 2019. 基于PMC方法的辽宁测震台网监测能力评估. 地震工程学报, 41(6): 1545—1552 doi: 10.3969/j.issn.1000-0844.2019.06.1545An X. Y. , Zhao Q. , Wang X. R. , et al. , 2019. Assessment of earthquake monitoring capability of Liaoning seismic network based on PMC method. China Earthquake Engineering Journal, 41(6): 1545—1552. (in Chinese) doi: 10.3969/j.issn.1000-0844.2019.06.1545 黄亦磊, 周仕勇, 庄建仓, 2016. 基于地震目录估计完备震级方法的数值实验. 地球物理学报, 59(4): 1350—1358 doi: 10.6038/cjg20160416Huang Y. L. , Zhou S. Y. , Zhuang J. C. , 2016. Numerical tests on catalog-based methods to estimate magnitude of completeness. Chinese Journal of Geophysics, 59(4): 1350—1358. (in Chinese) doi: 10.6038/cjg20160416 霍祝青, 瞿旻, 2016. 江苏地区小震精定位及构造意义分析. 地震工程学报, 38(5): 802—807 doi: 10.3969/j.issn.1000-0844.2016.05.0802Huo Z. Q. , Qu M. , 2016. Precise relocation of small earthquakes in the Jiangsu area and associated tectonic implications. China Earthquake Engineering Journal, 38(5): 802—807. (in Chinese) doi: 10.3969/j.issn.1000-0844.2016.05.0802 蒋长胜, 房立华, 韩立波等, 2015. 利用PMC方法评估地震台阵的地震检测能力——以西昌流动地震台阵为例. 地球物理学报, 58(3): 832—843 doi: 10.6038/cjg20150313Jiang C. S. , Fang L. H. , Han L. B. , et al. , 2015. Assessment of earthquake detection capability for the seismic array: a case study of the Xichang seismic array. Chinese Journal of Geophysics, 58(3): 832—843. (in Chinese) doi: 10.6038/cjg20150313 立凯, 陈浩, 张朋等, 2021. 江苏省测震台网背景噪声特征. 华北地震科学, 39(3): 66—71, 76Li K., Chen H., Zhang P., et al., 2021 Background noise characteristics of Jiangsu seismological network. North China Earthquake Sciences, 39(3): 66—71, 76. (in Chinese) 李智超, 黄清华, 2014. 基于概率完备震级评估首都圈地震台网检测能力. 地球物理学报, 57(8): 2584—2593 doi: 10.6038/cjg20140818Li Z. C. , Huang Q. H. , 2014. Assessment of detectability of the capital-circle seismic network by using the probability-based magnitude of completeness (PMC) method. Chinese Journal of Geophysics, 57(8): 2584—2593. (in Chinese) doi: 10.6038/cjg20140818 刘芳, 蒋长胜, 张帆等, 2014. 内蒙古区域地震台网监测能力研究. 地震学报, 36(5): 919—929Liu F. , Jiang C. S. , Zhang F. , et al. , 2014. A study on detection capability of the Inner Mongolia regional seismic network. Acta Seismologica Sinica, 36(5): 919—929. (in Chinese) 王鹏, 郑建常, 李铂, 2016. 基于PMC方法的山东省测震台网监测能力评估. 地球物理学进展, 31(6): 2408—2414 doi: 10.6038/pg20160607Wang P. , Zheng J. C. , Li B. , 2016. Analysis of detection capability of Shandong regional seismic network based on PMC method. Progress in Geophysics, 31(6): 2408—2414. (in Chinese) doi: 10.6038/pg20160607 Enescu B., Ito K., 2002. Spatial analysis of the frequency-magnitude distribution and decay rate of aftershock activity of the 2000 western tottori earthquake. Earth, Planets and Space, 54(8): 847—859. Gentili S., Sugan M., Peruzza L., et al., 2011. Probabilistic completeness assessment of the past 30 years of seismic monitoring in northeastern Italy. Physics of the Earth and Planetary Interiors, 186(1—2): 81—96. Gomberg J. , 1991. Seismicity and detection/location threshold in the southern great basin seismic network. Journal of Geophysical Research: Solid Earth, 96(B10): 16401—16414. doi: 10.1029/91JB01593 Gomberg J. , Reasenberg P. A. , Bodin P. , et al. , 2001. Earthquake triggering by seismic waves following the landers and hector mine earthquakes. Nature, 411(6836): 462—466. doi: 10.1038/35078053 Gutenberg B. , Richter C. F. , 1944. Frequency of earthquakes in California. Bulletin of the Seismological Society of America, 34(4): 185—188. doi: 10.1785/BSSA0340040185 He Y. C. , Li J. L. , Tian W. , et al. , 2021. Characterization of the near-surface shear wave attenuation in the Groningen gas field using borehole recording. Geophysical Journal International, 226(3): 2057—2072. doi: 10.1093/gji/ggab186 Knopoff L. , 2000. The magnitude distribution of declustered earthquakes in Southern California. Proceedings of the National Academy of Sciences of the United States of America, 97(22): 11880—11884. Main I., 2000. Apparent breaks in scaling in the earthquake cumulative frequency-magnitude distribution: fact or artifact? Bulletin of the Seismological Society of America, 90(1): 86—97. Nanjo K. Z. , Schorlemmer D. , Woessner J. , et al. , 2010. Earthquake detection capability of the Swiss seismic network. Geophysical Journal International, 181(3): 1713—1724 Rydelek P. A. , Sacks I. S. , 1989. Testing the completeness of earthquake catalogues and the hypothesis of self-similarity. Nature, 337(6204): 251—253. doi: 10.1038/337251a0 Schorlemmer D. , Woessner J. , 2008. Probability of detecting an earthquake. Bulletin of the Seismological Society of America, 98(5): 2103—2117. doi: 10.1785/0120070105 Schorlemmer D. , Mele F. , Marzocchi W. , 2010. A completeness analysis of the national seismic network of Italy. Journal of Geophysical Research: Solid Earth, 115(B4): B04308. Sereno T. J. Jr. , Bratt S. R. , 1989. Seismic detection capability at NORESS and implications for the detection threshold of a hypothetical network in the Soviet Union. Journal of Geophysical Research: Solid Earth, 94(B8): 10397—10414. doi: 10.1029/JB094iB08p10397 Stein R. S. , 1999. The role of stress transfer in earthquake occurrence. Nature, 402(6762): 605—609. doi: 10.1038/45144 Wiemer S. , Wyss M. , 2000. Minimum magnitude of completeness in earthquake catalogs: examples from Alaska, the western United States, and Japan. Bulletin of the Seismological Society of America, 90(4): 859—869. doi: 10.1785/0119990114 Wiemer S. , Wyss M. , 2002. Mapping spatial variability of the frequency-magnitude distribution of earthquakes. Advances in Geophysics, 45: 259—302, I-V. Woessner J. , Wiemer S. , 2005. Assessing the quality of earthquake catalogues: estimating the magnitude of completeness and its uncertainty. Bulletin of the Seismological Society of America, 95(2): 684—698. doi: 10.1785/0120040007 -


 点击查看大图
计量
- 文章访问数: 214
- HTML全文浏览量: 88
- PDF下载量: 10
- 被引次数: 0
