
The Hanging-wall Effect of the Near-fault Strong Ground Motions during the Hokkaido Eastern Iburi MW 6.6 Earthquake
-
摘要: 上盘效应是近断层地震动的主要特性之一,而目前就上盘效应的定量研究较少。本文利用日本K-NET和KiK-net强震动台网获取的近场强震动加速度记录,定量研究了北海道MW6.6地震的上盘效应对地震动PGA、PGV和不同周期的加速度反应谱值空间分布和衰减特征的影响,探讨地震动上盘效应的特征及其影响范围,并将上、下盘观测结果与地震动预测经验模型进行对比。研究结果表明:(1)在断层距小于45 km时,此次北海道地震具有显著的上盘效应特征,断层上盘记录的PGA、PGV和加速度反应谱值明显大于下盘和中间区域的地震动观测值,且高于本次地震的平均值。上盘效应影响范围与震源破裂过程反演得到的断层尺度相吻合。(2)断层上盘的PGA观测值高于此次地震平均水平的对数偏差为0.61±0.16,这与1994年北岭地震和1999年集集地震等逆冲型地震的影响水平接近。上盘记录的PGV高于平均水平的对数偏差为0.39±0.12,即高于平均水平约35%。上盘观测地震动在周期T为0.2 、0.5 、1.0、2.0、3.0、5.0 s时的加速度反应谱值高于平均水平的对数偏差分别为0.33±0.19、0.54±0.23、0.53±0.20、0.26±0.21、0.24±0.19、0.16±0.16,随着周期的逐渐增大,上盘效应引起的偏差不断减小。此次地震上盘效应对地震动的影响主要以PGA和短周期(T≤1.0 s)地震动为主。(3)从实际观测结果与地震动预测经验模型的对比来看,对于PGA和小于1.0 s的短周期地震动,BSSA2014和CB2014的2个模型对此次地震上盘效应的预测效果更好,但对1.0 s以上的长周期,ASK2014、CB2014、CY2014模型的预测效果更好,BSSA2014模型则可能会高估地震动。Abstract: The hanging-wall effect is one of the main characteristics of near-fault strong ground motion. However, there are few quantitative studies on the hanging-wall effect. Here, based on the near-fault strong ground motion recordings obtained by K-NET and KiK-net during the MW 6.6 Hokkaido Eastern Iburi earthquake, we investigated the hanging-wall effect of the near-fault and its influence on spatial distribution and attenuation features of horizontal peak ground acceleration (PGA), peak ground velocity (PGV) and acceleration spectra (Sa) of different periods. The characteristics and the influence range of the hanging-wall effect were investigated. And the observation of hanging-wall and footwall was compared with NGA-West2 prediction models. The results show the following: (1) The Hokkadio earthquake has a distinct hanging-wall effect. Within about 45 km from the fault, the observation of PGAs, PGVs and Sa are larger on the hanging-wall sites than on the footwall sites and the netural sites, and above the regressed median curve. The region of influence of the hanging-wall effect is consistent with the fault scale given by the rupture process. (2) The PGA mean residual of the hanging-wall sites is 0.61±0.16. This value is similar to the mean residual from 1994 Northridge earthquake , 1999 Chi-Chi earthquake and other dipping fault earthquakes. The PGV mean residual of the hanging-wall sites is 0.39±0.12, that is, the observed PGV is 35% larger than the fitted mean. The mean residual for the spectra acceleration at periods of 0.2 s to 5.0 s are 0.33±0.19、0.54±0.23、0.53±0.20、0.26±0.21、0.24±0.19 and 0.16±0.16. With the increase of the period, the mean residual of acceleration spectra on the hanging-wall tends to gradually decrease. The analysis results show that the PGA and the short-period ground motion are systematically affected by the hanging-wall effect. (3) Based on the comparison between the observation and the prediction results, for the PGA and the short period ground motions less than 1.0 s, observation shows a coincidence with the prediction from the BSSA2014 and CB2014 models on the hanging-wall. When the long-period motion is over 1.0 s , the observation of the acceleration response spectrum shows a coincidence with the prediction from the ASK2014, CB2014 and CY2014 models, and the BSSA2014 model may overestimate the ground motions.
-
Key words:
- Near-fault /
- Hanging-wall effect /
- Strong-ground-motion prediction models
1)1 2https://earthquake.usgs.gov/earthquakes/eventpage/us1000chhc/executive#executive -
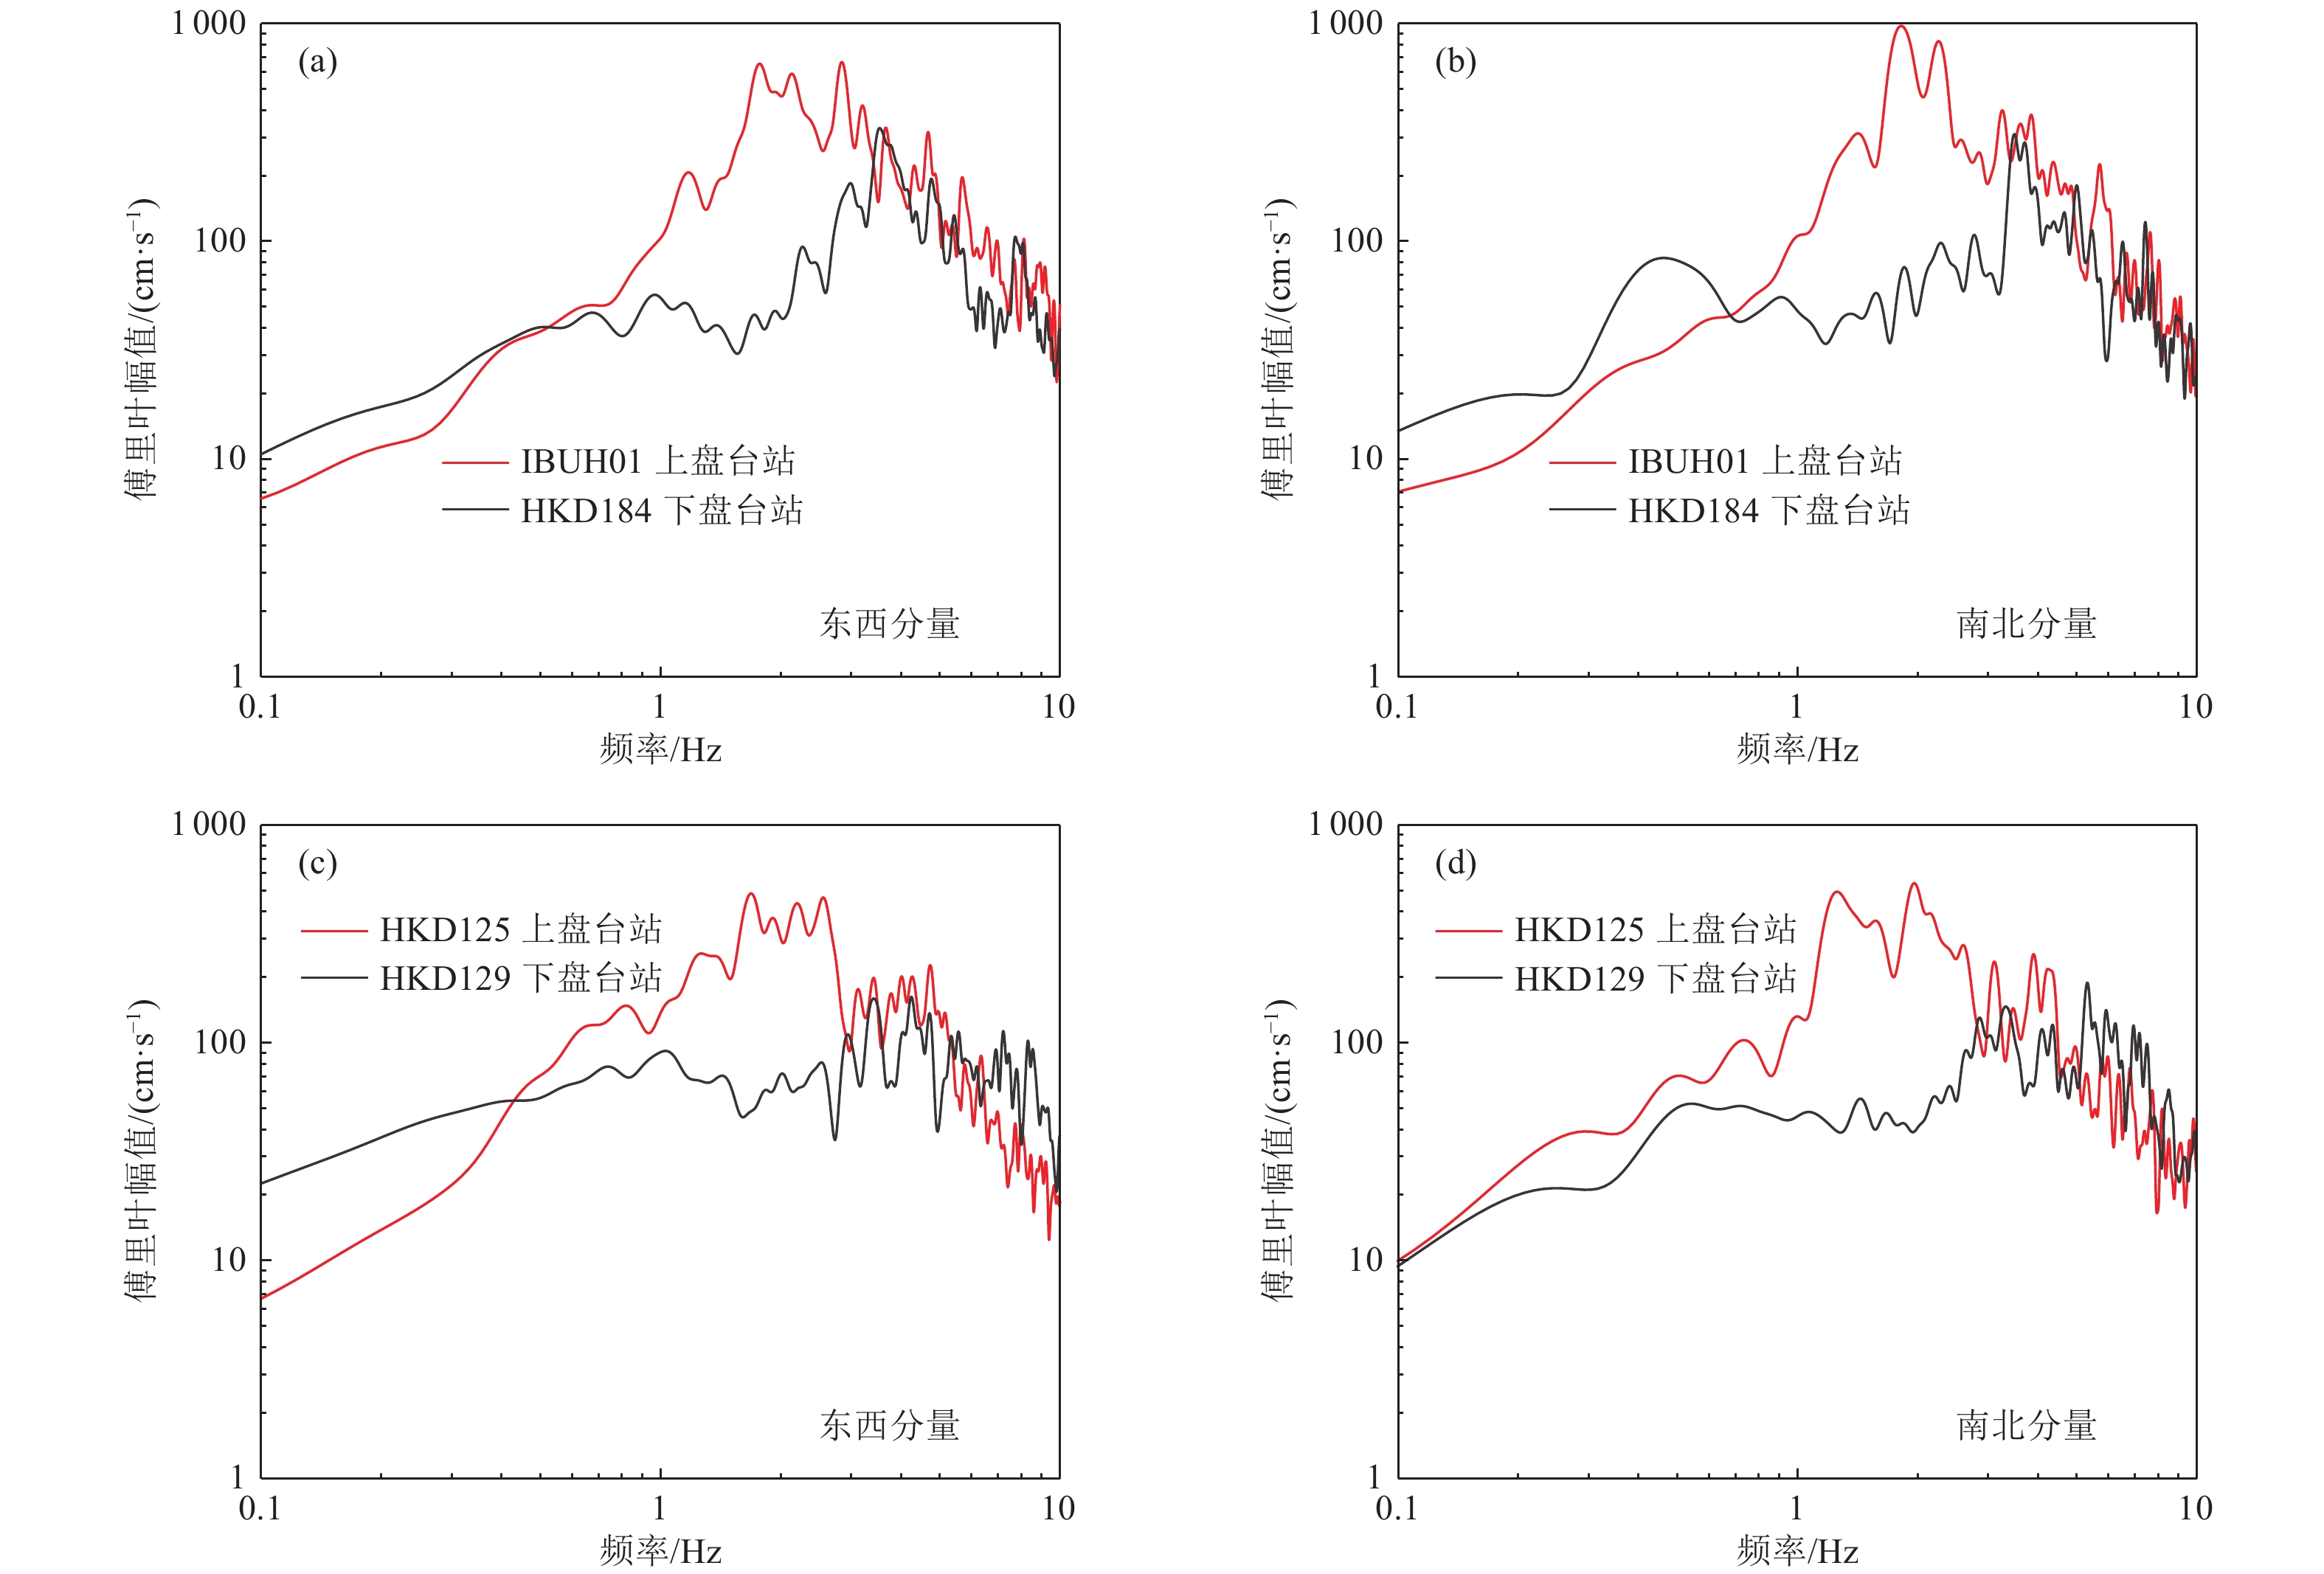
图 1 上盘和下盘强震动记录的傅立叶谱
Figure 1. The Fourier spectrum of ground motions recorded on the hanging wall and footwall, respectively
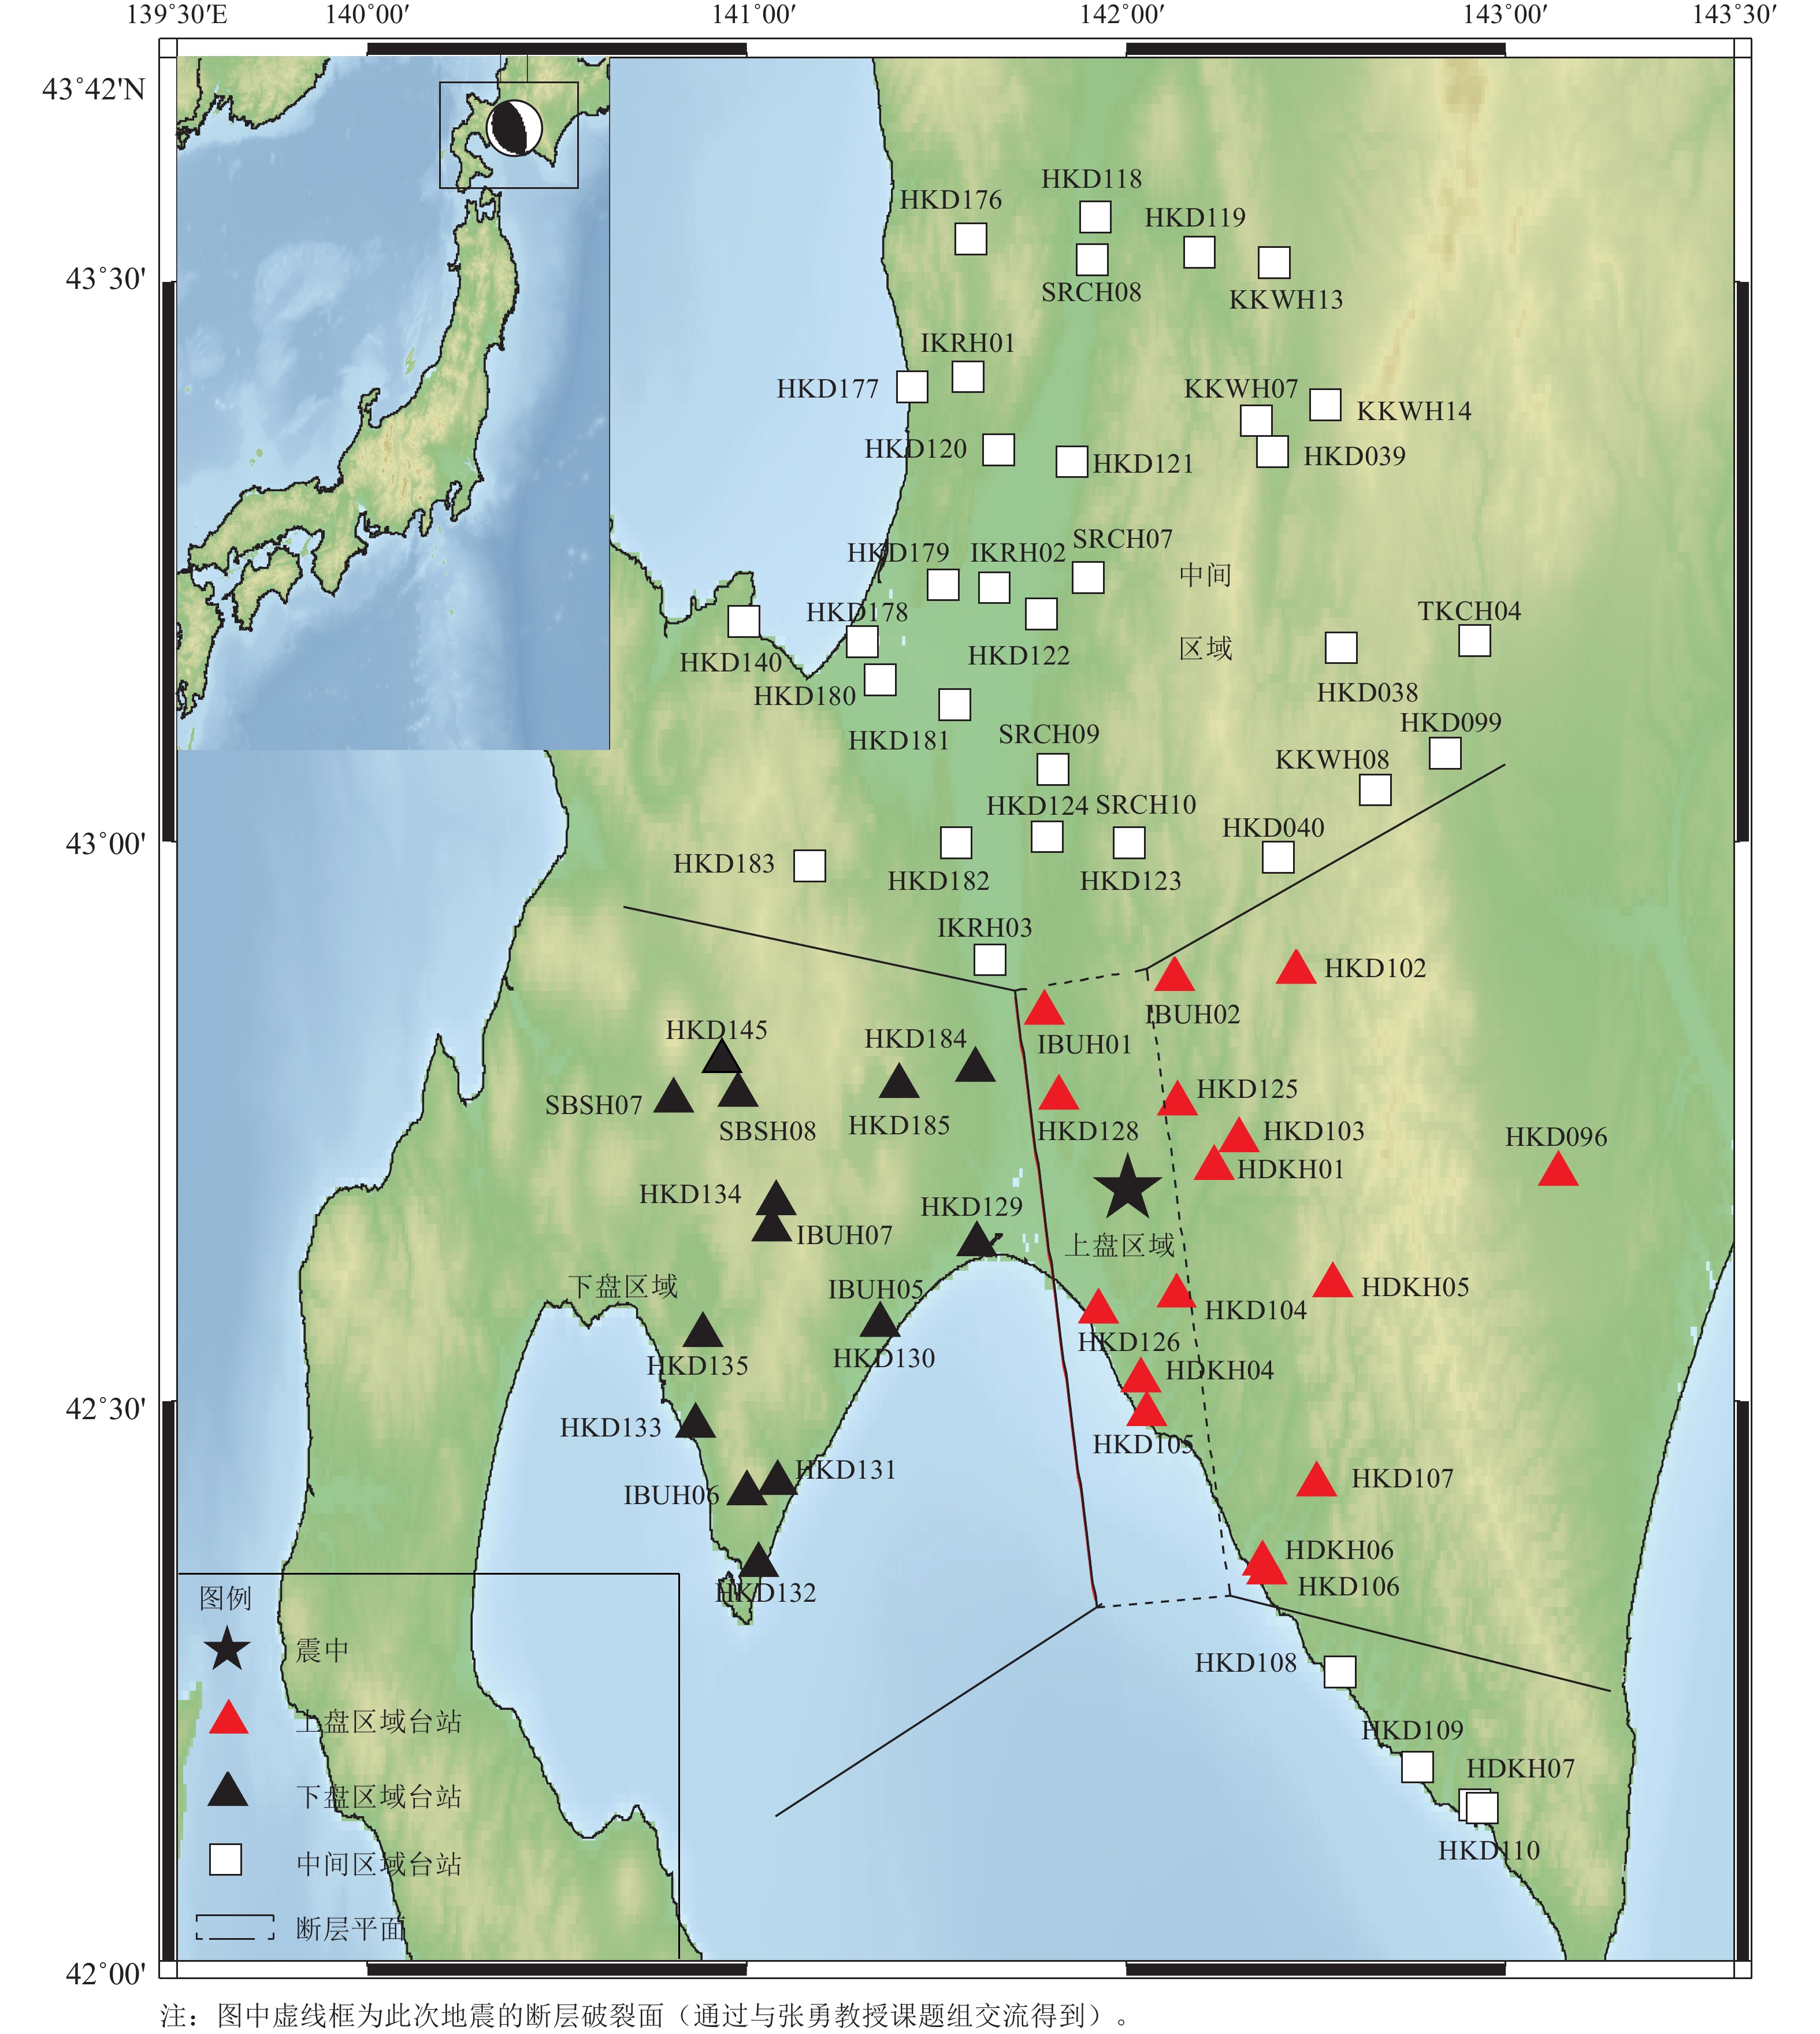
图 2 北海道胆振东部地震67个近场强震动台站的空间分布
Figure 2. Spatial distribution of 67 near-field strong ground motion stations during Hokkaido Eastern Iburi earthquake
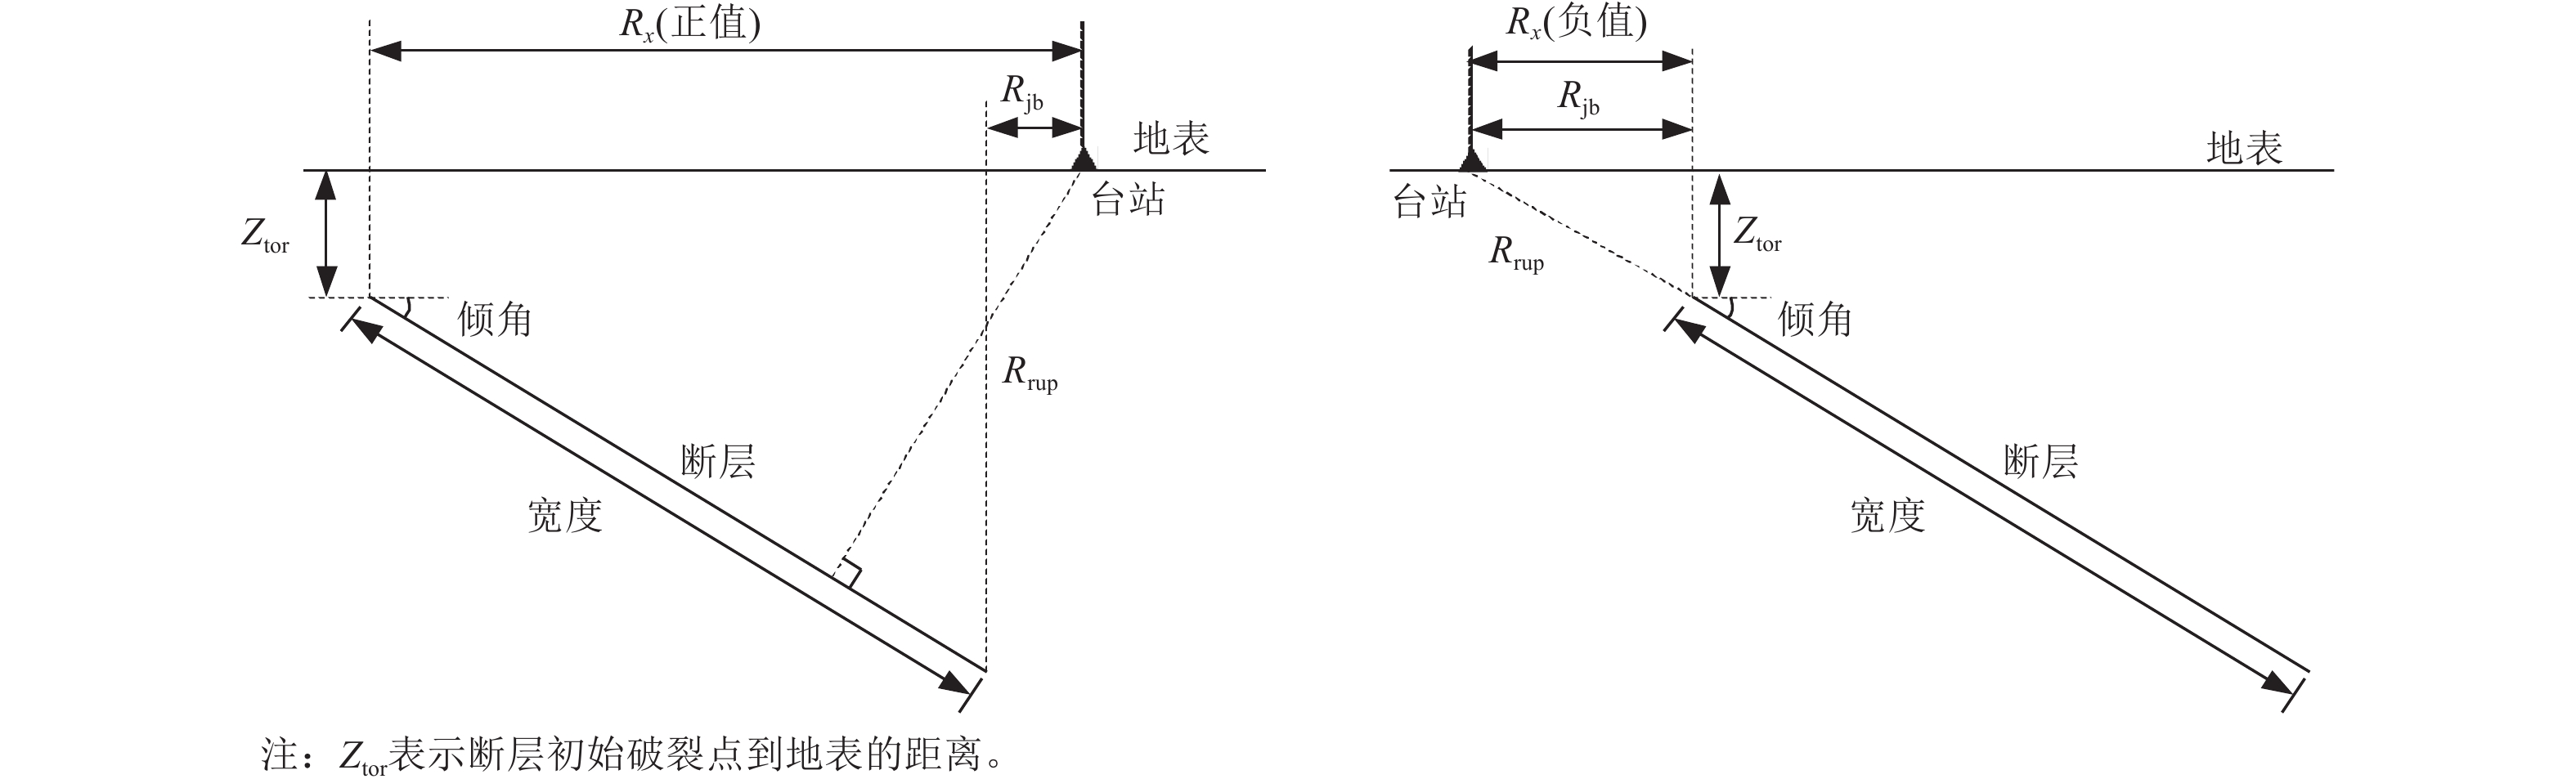
图 3 不同位置台站距离参数的示意图
Figure 3. The schematic diagram of distance parameters of stations at different locations
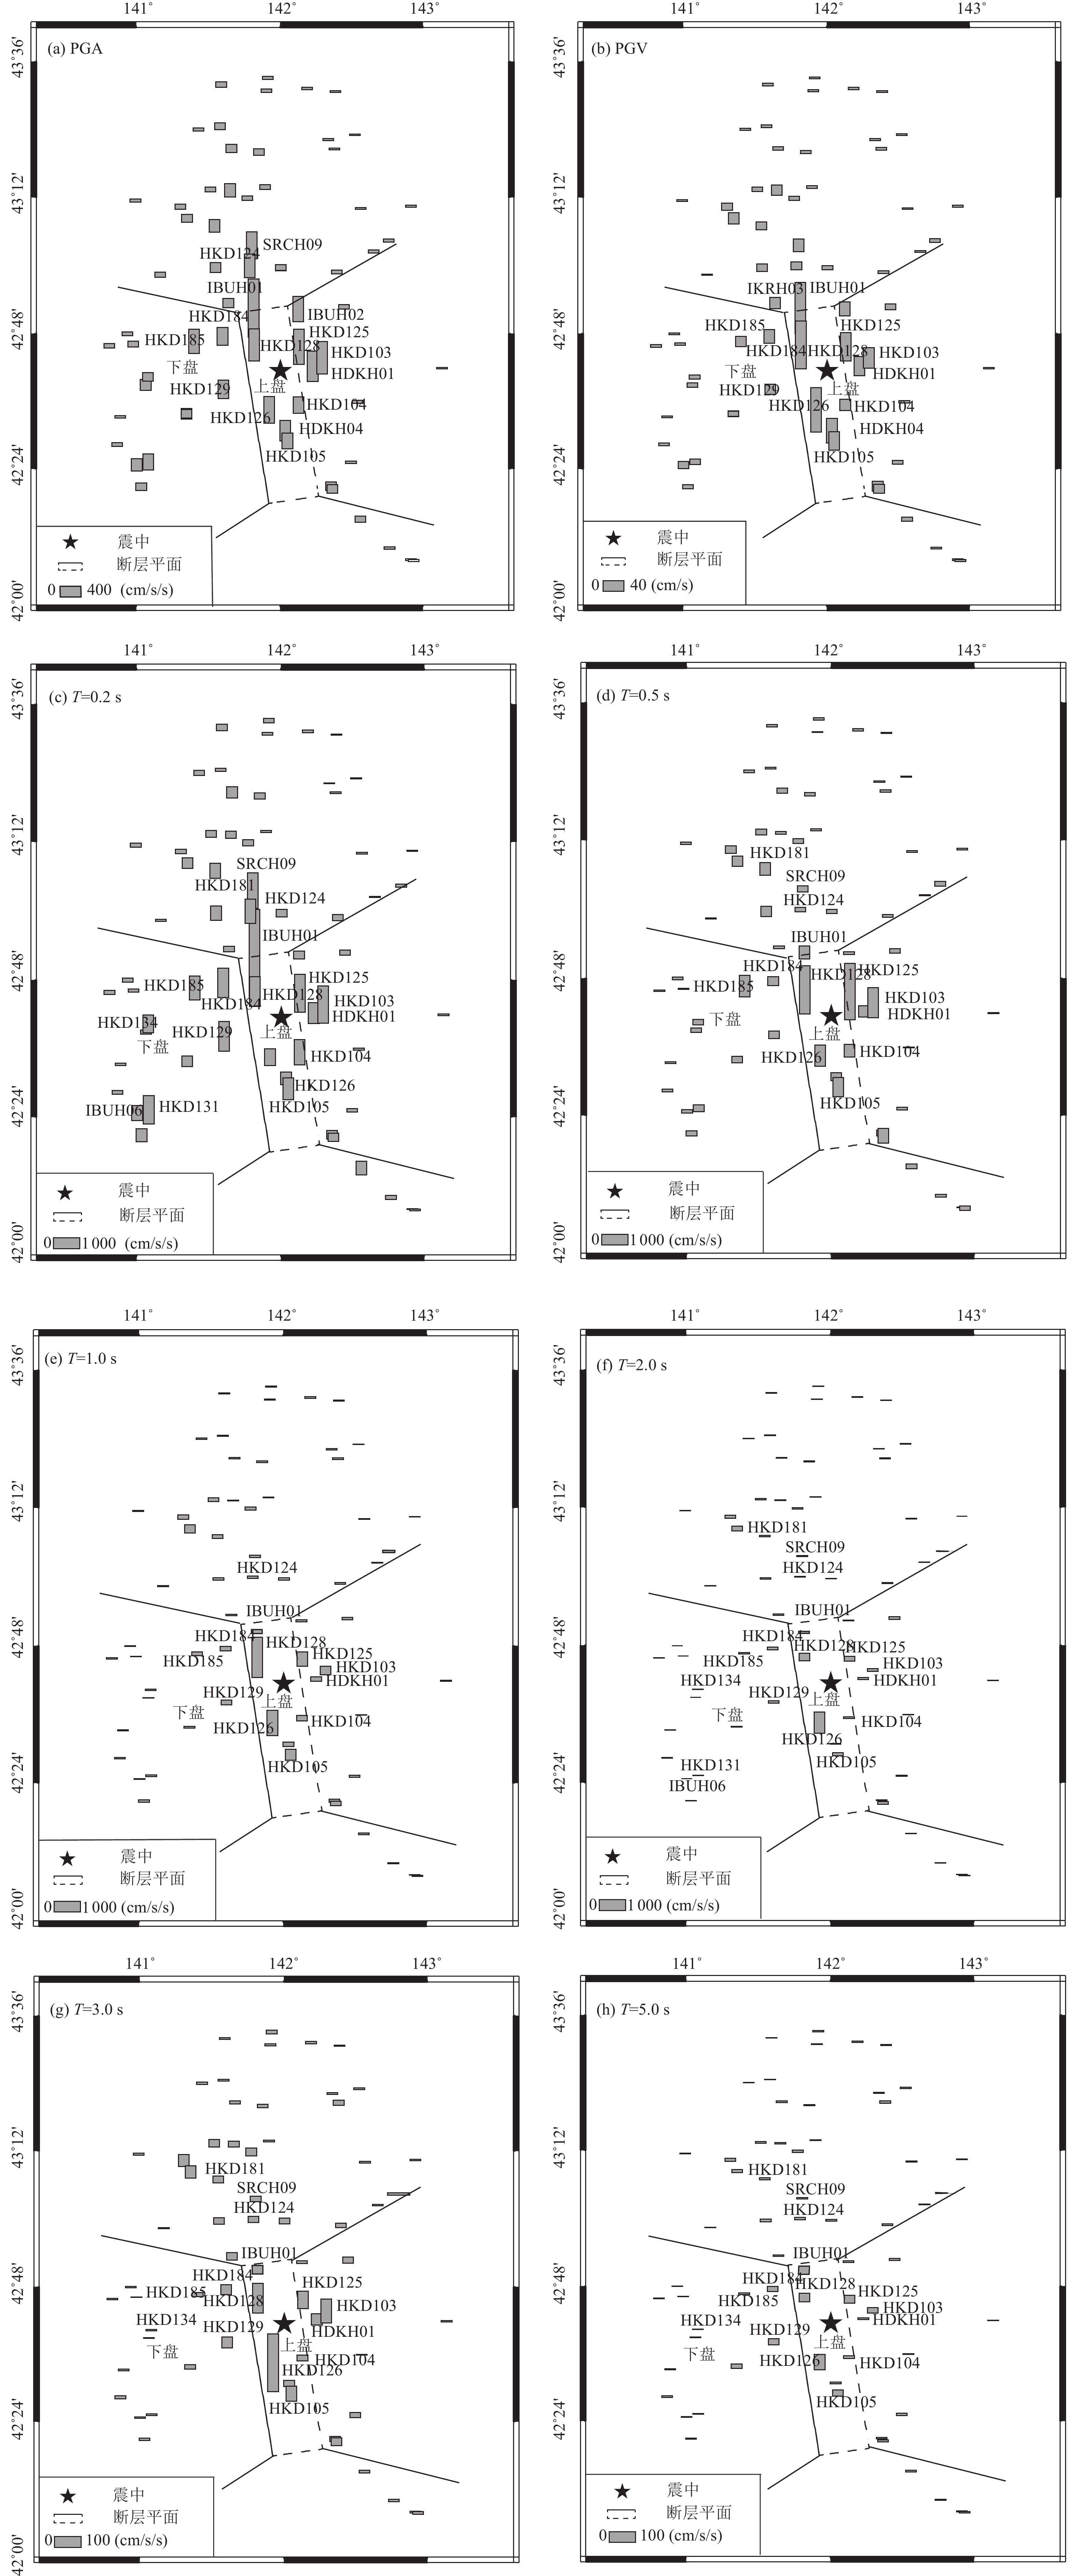
4 水平向PGA、PGV及不同周期对应的加速度反应谱值的空间分布
4. The spatial distributions of observed horizontal PGA、PGV and spectral accelerations at different periods
图 5 由北海道地震近断层强震记录得到PGA、PGV、对应于不同周期的上下盘水平加速度反应谱值随断层距的变化及与NGA-West2地震动经验预测模型的对比
Figure 5. Variation of horizontal PGA, PGV and spectral accelerations at different periods in hanging wall, footwall and neutral sites with Rrup and comparison with NGA-West2 models

图 6 位于上下盘的强震台站记录PGA、PGV及不同周期对应的加速度反应谱值对数残差
Figure 6. Residuals of PGA, PGV and spectral accelerations at different periods
图 7 上下盘强震记录PGA、PGV以及不同周期对应的加速度反应谱值与NGA-West2地震动模型对比情况
Figure 7. Comparison of horizontal PGA,PGV and spectral accelerations at different periods with those predictions of four next generation attenuation(NGA)empirical GMPE
8 基于NGA-West2模型计算的PGA、PGV和谱加速度在不同周期时上下盘事件内残差
8. The intraevent residuals of the hanging wall/footwall for PGA, PGV and spectral accelerations at different periods computed by different NGA-West2 models
表 1 北海道地震近断层67组地震动记录基本参数
Table 1. Parameters for the 67 strong ground motion recordings during the Hokkaido earthquake
编号 台站名 纬度
/(°)经度
/(°)Rrup
/kmRjb
/kmRx
/kmVS30
/(cm·s−1)台站位置 PGA/(cm·s−2) PGV/(cm·s−1) 1 HKD038 43.2 142.6 71.9 53.3 77.4 519.9 Neutral 34.1 2.71 2 HKD039 43.3 142.4 73.9 58.0 68.4 334.8 Neutral 31.0 5.44 3 HKD040 43.0 142.4 52.8 31.3 58.5 325.8 Neutral 71.6 5.46 4 HKD096 42.7 143.1 97.0 80.9 108.2 386.3 HW 26.2 2.28 5 HKD099 43.1 142.8 86.4 69.0 96.2 269.7 Neutral 60.9 6.73 6 HKD102 42.9 142.4 53.4 32.0 59.2 376.2 HW 86.7 10.67 7 HKD103 42.7 142.3 38.6 15.4 42.6 288.9 HW 617.9 38.83 8 HKD104 42.6 142.1 23.1 0.0 25.2 396.1 HW 310.3 20.75 9 HKD105 42.5 142.1 14.8 0.0 15.9 379.3 HW 306.1 35.13 10 HKD106 42.3 142.4 33.6 10.8 36.5 238.7 HW 157.3 16.71 11 HKD107 42.4 142.5 44.5 22.0 49.2 365.7 HW 52.8 7.44 12 HKD108 42.3 142.6 48.6 29.4 49.3 312.3 Neutral 115.4 7.71 13 HKD109 42.2 142.8 65.5 48.6 62.8 288.0 Neutral 42.0 3.18 14 HKD110 42.1 142.9 78.9 62.9 74.9 222.0 Neutral 35.4 3.16 15 HKD118 43.6 141.9 81.5 74.7 37.8 359.3 Neutral 63.1 3.63 16 HKD119 43.5 142.2 83.2 71.5 58.5 413.3 Neutral 46.8 4.57 17 HKD120 43.3 141.7 58.5 57.5 11.3 272.1 Neutral 149.9 6.27 18 HKD121 43.3 141.9 57.2 52.0 26.1 276.3 Neutral 116.4 6.02 19 HKD122 43.2 141.8 41.9 39.2 15.6 247.4 Neutral 88.3 7.27 20 HKD123 43.0 142.0 28.2 12.2 27.9 554.9 Neutral 111.6 7.55 21 HKD124 43.0 141.8 20.5 17.7 10.7 461.1 Neutral 446.0 14.71 22 HKD125 42.8 142.1 28.0 3.5 30.8 213.3 HW 666.4 54.10 23 HKD126 42.6 141.9 8.4 0.0 8.7 152.5 HW 506.6 84.51 24 HKD128 42.8 141.8 6.1 0.0 6.1 180.9 HW 609.4 90.72 25 HKD129 42.6 141.6 15.1 15.1 −15.1 445.0 FW 346.8 19.15 26 HKD130 42.6 141.3 37.6 37.5 −37.5 462.7 FW 161.8 10.37 27 HKD131 42.4 141.1 63.2 63.1 −63.1 438.4 FW 307.4 9.98 28 HKD132 42.3 141.0 69.3 69.3 −69.3 229.4 FW 147.9 7.66 29 HKD133 42.5 140.9 78.7 78.7 −78.7 335.5 FW 80.2 4.96 30 HKD134 42.7 141.1 55.7 55.7 −55.7 376.0 FW 165.0 7.69 31 HKD135 42.6 140.9 74.6 74.5 −74.5 214.1 FW 40.4 3.18 32 HKD140 43.2 141.0 73.1 73.1 −46.5 346.7 Neutral 58.4 3.62 33 HKD145 42.8 140.9 65.0 65.0 −63.1 271.7 FW 66.1 3.73 34 HKD176 43.5 141.6 80.0 79.2 11.4 337.5 Neutral 99.8 4.73 35 HKD177 43.4 141.4 68.9 68.9 −5.2 455.2 Neutral 60.3 3.56 36 HKD178 43.2 141.3 52.4 52.4 −22.5 214.4 Neutral 93.7 13.39 37 HKD179 43.2 141.5 48.2 48.2 −4.0 201.9 Neutral 94.4 8.77 38 HKD180 43.1 141.4 47.1 47.1 −19.8 128.0 Neutral 148.3 21.33 39 HKD181 43.1 141.5 36.2 36.2 −5.0 212.7 Neutral 242.6 15.49 40 HKD182 43.0 141.6 24.0 24.0 −8.3 310.9 Neutral 187.6 14.59 41 HKD183 43.0 141.2 49.2 49.2 −39.6 532.1 Neutral 93.7 2.45 42 HKD184 42.8 141.6 10.7 10.7 −10.7 291.0 FW 336.5 26.05 43 HKD185 42.8 141.4 27.0 27.0 −26.9 310.8 FW 463.5 19.39 44 HDKH01 42.7 142.2 33.2 9.3 36.5 368.3 HW 583.2 36.40 45 HDKH04 42.5 142.0 14.4 0.0 15.5 235.0 HW 389.0 47.35 46 HDKH05 42.6 142.5 52.5 31.0 58.3 766.2 HW 58.6 4.08 47 HDKH06 42.3 142.4 32.8 9.6 35.8 412.2 HW 163.1 18.23 48 HDKH07 42.1 142.9 77.4 61.3 73.5 459.1 Neutral 33.4 3.13 49 IBUH01 42.9 141.8 9.6 3.8 9.2 306.8 HW 1107.3 97.57 50 IBUH02 42.9 142.1 30.6 6.4 33.7 541.8 HW 485.8 26.84 51 IBUH05 42.6 141.3 37.6 37.5 −37.5 379.3 FW 207.4 11.11 52 IBUH06 42.4 141.0 69.8 69.8 −69.8 340.0 FW 238.4 13.80 53 IBUH07 42.6 141.1 57.6 57.6 −57.6 259.3 FW 208.9 8.19 54 IKRH01 43.4 141.6 66.6 66.2 6.9 404.7 Neutral 137.3 5.01 55 IKRH02 43.2 141.7 45.0 44.6 6.6 180.0 Neutral 256.3 19.52 56 IKRH03 42.9 141.6 10.5 10.4 −4.6 325.8 Neutral 180.6 21.47 57 KKWH07 43.4 142.3 74.3 59.1 65.7 403.0 Neutral 43.3 3.46 58 KKWH08 43.0 142.7 72.5 53.5 80.7 318.0 Neutral 56.5 3.44 59 KKWH13 43.5 142.4 88.9 75.2 74.0 800.0 Neutral 36.7 3.30 60 KKWH14 43.4 142.5 83.9 68.2 80.7 537.5 Neutral 21.8 3.04 61 SBSH07 42.8 140.8 75.8 75.8 −74.3 228.5 FW 80.7 4.71 62 SBSH08 42.8 141.0 61.9 61.9 −60.8 630.0 HW 106.9 4.91 63 SRCH07 43.2 141.9 46.7 40.0 26.3 620.0 Neutral 92.0 5.27 64 SRCH08 43.5 141.9 77.3 70.6 35.9 346.7 Neutral 68.4 4.36 65 SRCH09 43.1 141.8 27.1 23.8 13.8 240.5 Neutral 515.2 23.51 66 SRCH10 43.0 142.0 28.2 12.2 27.9 1026.8 Neutral 117.6 6.47 67 TKCH04 43.2 142.9 95.2 79.0 105.5 445.5 Neutral 41.4 4.38 注:Rrup为断层距,即台站至断层面的最短距离;Rjb为台站至断层破裂面表面投影的最近距离;Rx为台站至断层破裂顶部投影在地表的距离,均基于图2中的断层破裂面计算得到,不同位置台站的距离参数计算方法如图3所示;VS30为场地30 m剪切波速;HW代表台站位于上盘区域;FW代表台站位于下盘区域;Neutral代表台站位于中间区域。  下载: 导出CSV
表 2 各种地震动强度参数的衰减模型回归得到的衰减系数
Table 2. Regression results for attenuation of various intensity measure(IMs)
地震动强度表征参数 系数 R2 σlnY a b c d PGA 9.088 −1.144 8.420 −0.00286 0.686 0.560 PGV 5.987 −1.192 7.096 −0.00014 0.756 0.478 Sa(T=0.2 s) 8.500 −0.457 10.500 −0.02796 0.720 0.519 Sa(T=0.5 s) 9.262 −1.274 9.780 0 0.665 0.570 Sa(T=1.0 s) 8.141 −1.232 8.637 0 0.623 0.487 Sa(T=2.0 s) 7.498 −1.282 9.481 0 0.579 0.502 Sa(T=3.0 s) 5.670 −0.904 5.366 −0.00321 0.688 0.569 Sa(T=5.0 s) 5.508 −1.097 8.538 0 0.540 0.580
下载: 导出CSV
-
鲍鹏鹏, 崔玉龙, 许冲等, 2020.2018年日本北海道MW 6.6级地震滑坡分布分析. 河南城建学院学报, 29(2): 33—40Bao P. P. , Cui Y. L. , Xu C. , et al. , 2020. Analysis of landslide distribution caused by Hokkaido, Japan MW 6.6 earthquake in 2018. Journal of Henan University of Urban Construction, 29(2): 33—40. (in Chinese) 崔光耀, 伍修刚, 王明年等, 2018. 黏滑断层隧道减错措施参数对减错效果的影响分析. 震灾防御技术, 13(3): 502—511Cui G. Y. , Wu X. G. , Wang M. N. , et al. , 2018. Analysis of influence of parameters of reducing measures on the effect of reducing dislocation on tunnels crossing stick-slip faults. Technology for Earthquake Disaster Prevention, 13(3): 502—511. (in Chinese) 胡进军, 张艳静, 谢礼立, 2020. 上下盘地震动对我国核电厂抗震设计谱的影响. 振动与冲击, 39(19): 26—31Hu J. J. , Zhang Y. J. , Xie L. L. , 2020. Effects of hanging wall/footwall ground motion on aseismic design spectra of China nuclear power plants. Journal of Vibration and Shock, 39(19): 26—31. (in Chinese) 李爽, 谢礼立, 郝敏, 2006. 上盘效应对工程结构位移反应影响分析. 西安建筑科技大学学报(自然科学版), 38(6): 823—827Li S. , Xie L. L. , Hao M. , 2006. A study on the displacement response of structures due to hanging wall effects. Journal of Xi'an University of Architecture & Technology (Natural Science Edition), 38(6): 823—827. (in Chinese) 齐剑峰, 郝文拯, 王晓明等, 2019. 隐伏正断层错动致地表破裂变形特征的研究. 震灾防御技术, 14(3): 628—639Qi J. F. , Hao W. Z. , Wang X. M. , et al. , 2019. Study on feature of surface rupture and deformation caused by buried normal fault movement. Technology for Earthquake Disaster Prevention, 14(3): 628—639. (in Chinese) 吴帅, 崔玉龙, 鲍鹏鹏等, 2022. 基于GIS和CF模型的2018年日本北海道MW6.6地震滑坡危险性评价. 黑龙江工程学院学报, 36(2): 7—12Wu S. , Cui Y. L. , Bao P. P. , et al. , 2022. Risk assessment of landslides based on GIS and CF models in the 2018 Hokkaido MW6.6 earthquake. Journal of Heilongjiang Institute of Technology, 36(2): 7—12. (in Chinese) 郑绪君, 张勇, 马强等, 2018. 基于强震动资料的破裂过程快速反演及其自动化的可行性. 地球物理学报, 61(10): 4021—4036Zheng X. J. , Zhang Y. , Ma Q. , et al. , 2018. Fast inversion of rupture process based on strong motion data and the feasibility of its automation. Chinese Journal of Geophysics, 61(10): 4021—4036. (in Chinese) 気象庁, 2018a. 平成30年北海道胆振東部地震の評価. (2023-06-14). https://www.static.jishin.go.jp/resource/monthly/2018/20180906_iburi_3.pdf. 気象庁, 2018b. 「平成30年北海道胆振東部地震」について(第9報). (2023-06-14). http://www.jma.go.jp/jma/press/1809/20a/201809201500.html. Abrahamson N. A. , Somerville P. G. , 1996. Effects of the hanging wall and footwall on ground motions recorded during the Northridge earthquake. Bulletin of the Seismological Society of America, 86(1 B): S93—S99. doi: 10.1785/BSSA08601B0S93 Abrahamson N. A. , Silva W. J. , Kamai R, 2014. Summary of the ASK14 ground motion relation for active crustal regions. Earthquake Spectra, 30(3): 1025—1055. doi: 10.1193/070913EQS198M Ancheta T. D. , Darragh R. B. , Stewart J. P. , et al. , 2014. NGA-West2 database. Earthquake Spectra, 30(3): 989–1005. doi: 10.1193/070913EQS197M Bai Y. Z. , 2017. Comparison of strong ground motion recordings of the Lushan, China, earthquake of 20 April 2013 with the Next Generation Attenuation (NGA)-West2 ground-motion models. Bulletin of the Seismological Society of America, 107(4): 1724—1736. Boore D. M. , Atkinson G. M. , 2008. Ground-motion prediction equations for the average horizontal component of PGA, PGV, and 5%-damped PSA at spectral periods between 0.01 s and 10.0 s. Earthquake Spectra, 24(1): 99—138. doi: 10.1193/1.2830434 Boore D. M. , Thompson E. M. , Cadet H. , 2011. Regional correlations of VS30 and velocities averaged over depths less than and greater than 30 meters. Bulletin of the Seismological Society of America, 101(6): 3046—3059. doi: 10.1785/0120110071 Boore D. M. , Stewart J. P. , Seyhan E. , et al. , 2014. NGA-West2 equations for predicting PGA, PGV, and 5% damped PSA for shallow crustal earthquakes. Earthquake Spectra, 30(3): 1057—1085. doi: 10.1193/070113EQS184M Borcherdt R. D. , 1994. Estimates of site-dependent response spectra for design (methodology and justification). Earthquake Spectra, 10(4): 617—653. doi: 10.1193/1.1585791 Bozorgnia Y. , Abrahamson N. A. , Al Atik L. , et al. , 2014. NGA-West2 research project. Earthquake Spectra, 30(3): 973—987. doi: 10.1193/072113EQS209M Campbell K. W. , Bozorgnia Y. , 2014. NGA-West2 ground motion model for the average horizontal components of PGA, PGV, and 5% damped linear acceleration response spectra. Earthquake Spectra, 30(3): 1087—1115. doi: 10.1193/062913EQS175M Chang T. Y. , Cotton F. , Tsai Y. B. , et al. , 2004. Quantification of hanging-wall effects on ground motion: some insights from the 1999 Chi-Chi earthquake. Bulletin of the Seismological Society of America, 94(6): 2186—2197. doi: 10.1785/0120030233 Chiou B. S. J. , Youngs R. R. , 2014. Update of the Chiou and Youngs NGA model for the average horizontal component of peak ground motion and response spectra. Earthquake Spectra, 30(3): 1117—1153. doi: 10.1193/072813EQS219M Donahue J. L., Abrahamson N. A., 2013. Hanging-wall scaling using finite-fault simulations. Berkeley: Pacific Earthquake Engineering Research Center, 14. Ishikawa T. , Yoshimi M. , Isobe K. , et al. , 2021. Reconnaissance report on geotechnical damage caused by 2018 Hokkaido Eastern Iburi earthquake with JMA seismic intensity 7. Soils and Foundations, 61(4): 1151—1171. doi: 10.1016/j.sandf.2021.06.006 Katsumata K., Ichiyanagi M., Ohzono M., et al., 2019. The 2018 Hokkaido Eastern Iburi earthquake (MJMA=6.7) was triggered by a strike-slip faulting in a stepover segment: insights from the aftershock distribution and the focal mechanism solution of the main shock. Earth, Planets and Space, 71: 53. Kobayashi T., Hayashi K., Yarai H., 2019. Geodetically estimated location and geometry of the fault plane involved in the 2018 Hokkaido eastern Iburi earthquake. Earth, Planets and Space, 71: 62 Melgar D. , Bock Y. , Sanchez D. , et al. , 2013. On robust and reliable automated baseline corrections for strong motion seismology. Journal of Geophysical Research: Solid Earth, 118(3): 1177—1187. doi: 10.1002/jgrb.50135 Nakagawa N., Takai N., Shigefuji M., 2023. Examination of one-dimensional S-wave velocity structure using strong-motion data for high-seismic-intensity area during the 2018 Hokkaido Eastern Iburi earthquake. Earth, Planets and Space, 75: 42. Petersen M. D. , Bryant W. A. , Cramer C. H. , et al. , 1997. Seismic ground-motion hazard mapping incorporating site effects for Los Angeles, Orange, and Ventura counties, California: A geographical information system application. Bulletin of the Seismological Society of America, 87(1): 249—255. doi: 10.1785/BSSA0870010249 Ren C. M. , Yue H. , Wang T. , et al. , 2021. Source rupture model of the 2018 MW6.7 Iburi, Hokkaido earthquake from joint inversion of strong motion and InSAR observations. Earthquake Science, 34(1): 88—101. doi: 10.29382/eqs-2020-0065 Seyhan E. , Stewart J. P. , 2014. Semi-empirical nonlinear site amplification from NGA-West2 data and simulations. Earthquake Spectra, 30(3): 1241—1256. doi: 10.1193/063013EQS181M Shabestari K. T. , Yamazaki F. , 2003. Near-fault spatial variation in strong ground motion due to rupture directivity and hanging wall effects from the Chi-Chi, Taiwan earthquake. Earthquake Engineering & Structural Dynamics, 32(14): 2197–2219. Spudich P. A., Fletcher J. B., Hellweg M., et al., 1996. Earthquake ground motions in extensional tectonic regimes. Menlo Park: U. S. Geological Survey, 96—292, 351. Wang D. , Xie L. L. , Abrahamson A. N. , et al. , 2010. Comparison of strong ground motion from the Wenchuan, China, earthquake of 12 May 2008 with the Next Generation Attenuation (NGA) ground-motion models. Bulletin of the Seismological Society of America, 100(5 B): 2381–2395. doi: 10.1785/0120090009 Wang R. J. , Schurr B. , Milkereit C. , et al. , 2011. An improved automatic scheme for empirical baseline correction of digital strong-motion records. Bulletin of the Seismological Society of America, 101(5): 2029—2044. doi: 10.1785/0120110039 Wen R. Z. , Ren Y. F. , 2014. Strong-motion observations of the Lushan earthquake on 20 April 2013. Seismological Research Letters, 85(5): 1043—1055. doi: 10.1785/0220140006 Xie J. J. , Li X. J. , Wen Z. P. , et al. , 2014. Near-source vertical and horizontal strong ground motion from the 20 April 2013 MW 6.8 Lushan Earthquake in China. Seismological Research Letters, 85(1): 23—33. doi: 10.1785/0220130121 -

 点击查看大图
计量
- 文章访问数: 347
- HTML全文浏览量: 55
- PDF下载量: 35
- 被引次数: 0
