
Analysis of Seismic Response of Bridge across Earthquake Fault with Different Input Modes of Seismic Action
-
摘要: 大地震在近断层场地产生强烈地震动的同时,还会由于断层错动直接导致基岩甚至上覆土层破裂,在断层两侧产生显著差异性永久位移,造成位于断层附近或跨越断层的工程结构破坏。因此,跨断层桥梁面对的地震作用是断层两侧桥墩处场地的不同地震动,包括存在永久性位移的地震动。本文以垂直跨越走滑断层的多跨简支梁桥为例,基于OpenSees有限元模拟平台建立了桥梁结构的三维计算模型,计算分析了不同地震作用输入模式下桥梁结构的地震反应及其差异。考虑的地震作用模式包括:(1)断层两侧场地的地震作用视为相同的无永久位移的地震动,即无永久位移的一致地震动作用模式;(2)断层主动盘一侧场地的地震作用具有永久位移地震动,被动盘一侧采用无永久位移地震动,即具有永久位移的非一致地震动作用模式;(3)在断层主动盘一侧场地以静力方式施加断层错动位移,而被动盘一侧场地固定不动,即断层错动位移静力作用模式。计算结果分析表明,不考虑永久位移的一致地震动作用模式的地震动输入会导致严重低估桥梁反应计算结果,这也说明地震动的断层两侧永久性位移差异会显著增大桥梁结构反应;而一致地震动作用叠加断层错动永久位移静力作用的结果与非一致地震动作用模式的结果非常接近。为此,在某种程度上说,跨断层桥梁结构地震反应可采用一致地震动作用叠加断层错动位移静力作用的桥梁结构反应来近似模拟。Abstract: A large earthquake can produce strong ground motion at the near-fault site, and at the same time, it may directly break up the bedrock and even the overlying soil layers due to fault rupture, which leads to significant differential permanent displacement on both sides of the fault, and results in severe damage of the structure located near or crossing fault. Therefore, the seismic action on the bridge across fault is different on both sides of the fault, including the ground motion with permanent displacement. A simply supported girder bridge vertically across strike-slip fault is taken as an example, and a three-dimensional fnite-element model is developed using the earthquake engineering simulation software framework OpenSees (Open System for Earthquake Engineering Simulation). The seismic response of the bridge structure under different modes of seismic action is analyzed. The modes of seismic action considered include: (1) Seismic action of sites on both sides of the fault is regarded as the same ground motion without permanent displacement, that is, a consistent ground motion mode of seismic action without permanent displacement; (2) Seismic action of sites is regarded as a ground motion with permanent displacement on the active side of the fault, and a ground motion without permanent displacement on the passive side of the fault, that is, a non-consistent ground motion mode of seismic action with permanent displacement; (3) Fault dislocation displacement is applied to the site on the active side of fault, while the site on the passive side is fixed, that is, a static force mode of seismic action with fault dislocation displacement. The analysis results show that a consistent ground motion mode of seismic action without permanent displacement leads to a significant underestimation of the bridge structure responses, which indicates that the difference of permanent displacements of ground motions on both sides of the fault significantly increases the bridge structure response; The result from the superposition of the consistent ground motion mode and static force mode of fault dislocation permanent displacement is very close to the result from the non-consistent ground motion mode. Therefore, to a certain extent, the seismic response of cross-fault bridge structures can be approximately simulated by combining a consistent ground motion mode and a static force mode of fault dislocation displacement.
-
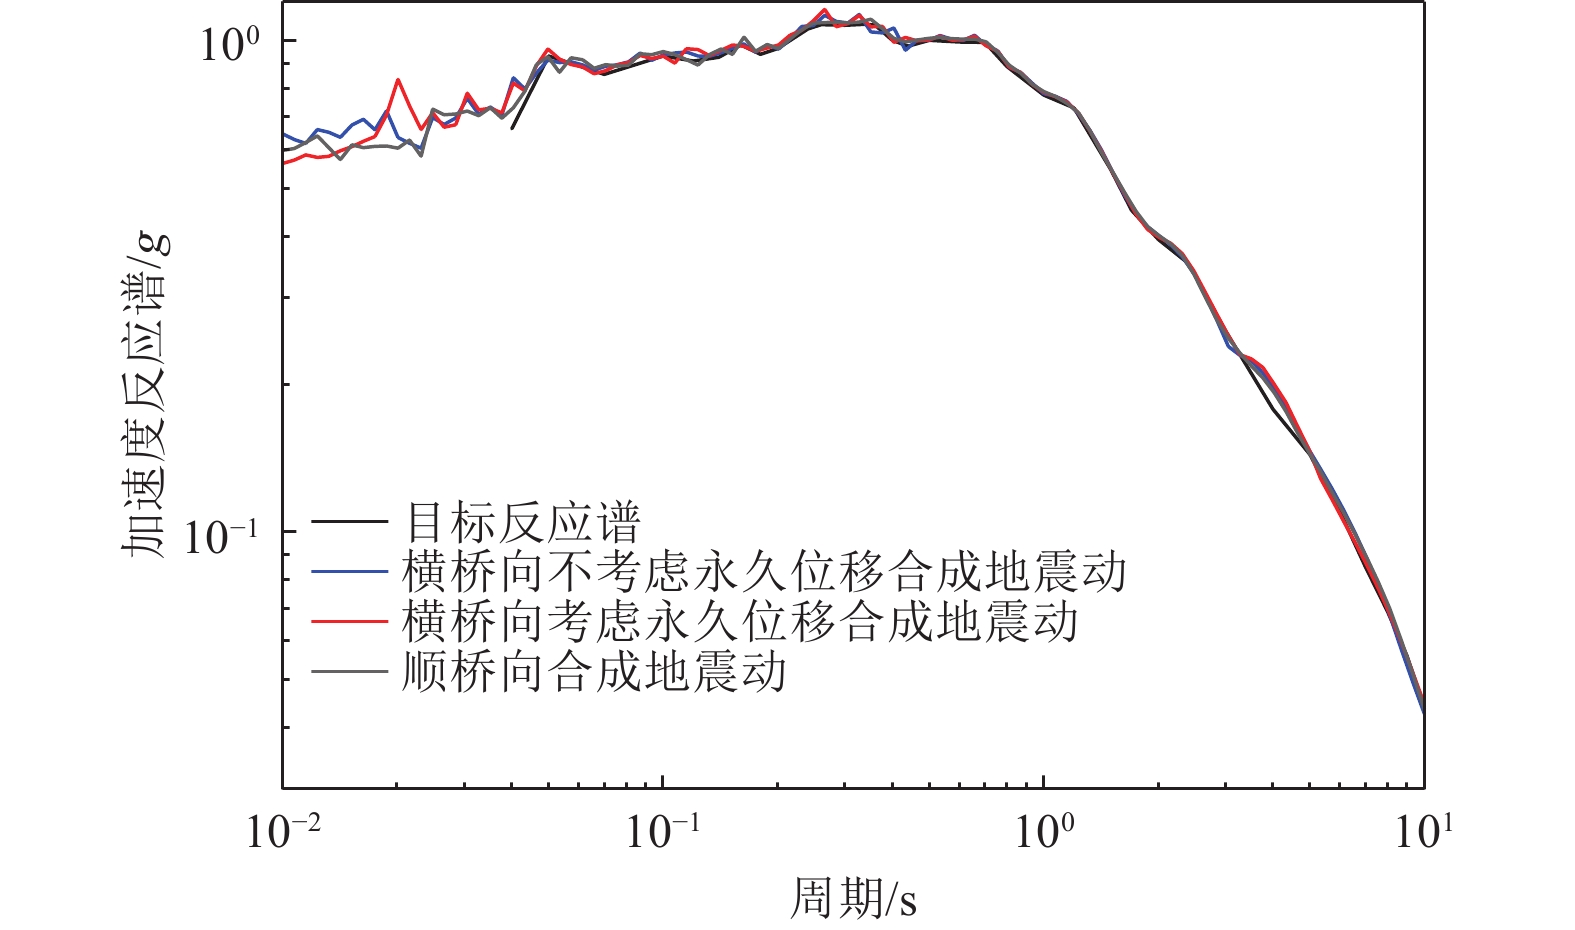
图 3 场地基岩水平向地震加速度反应谱
Figure 3. Horizontal seismic acceleration response spectrum of rock site
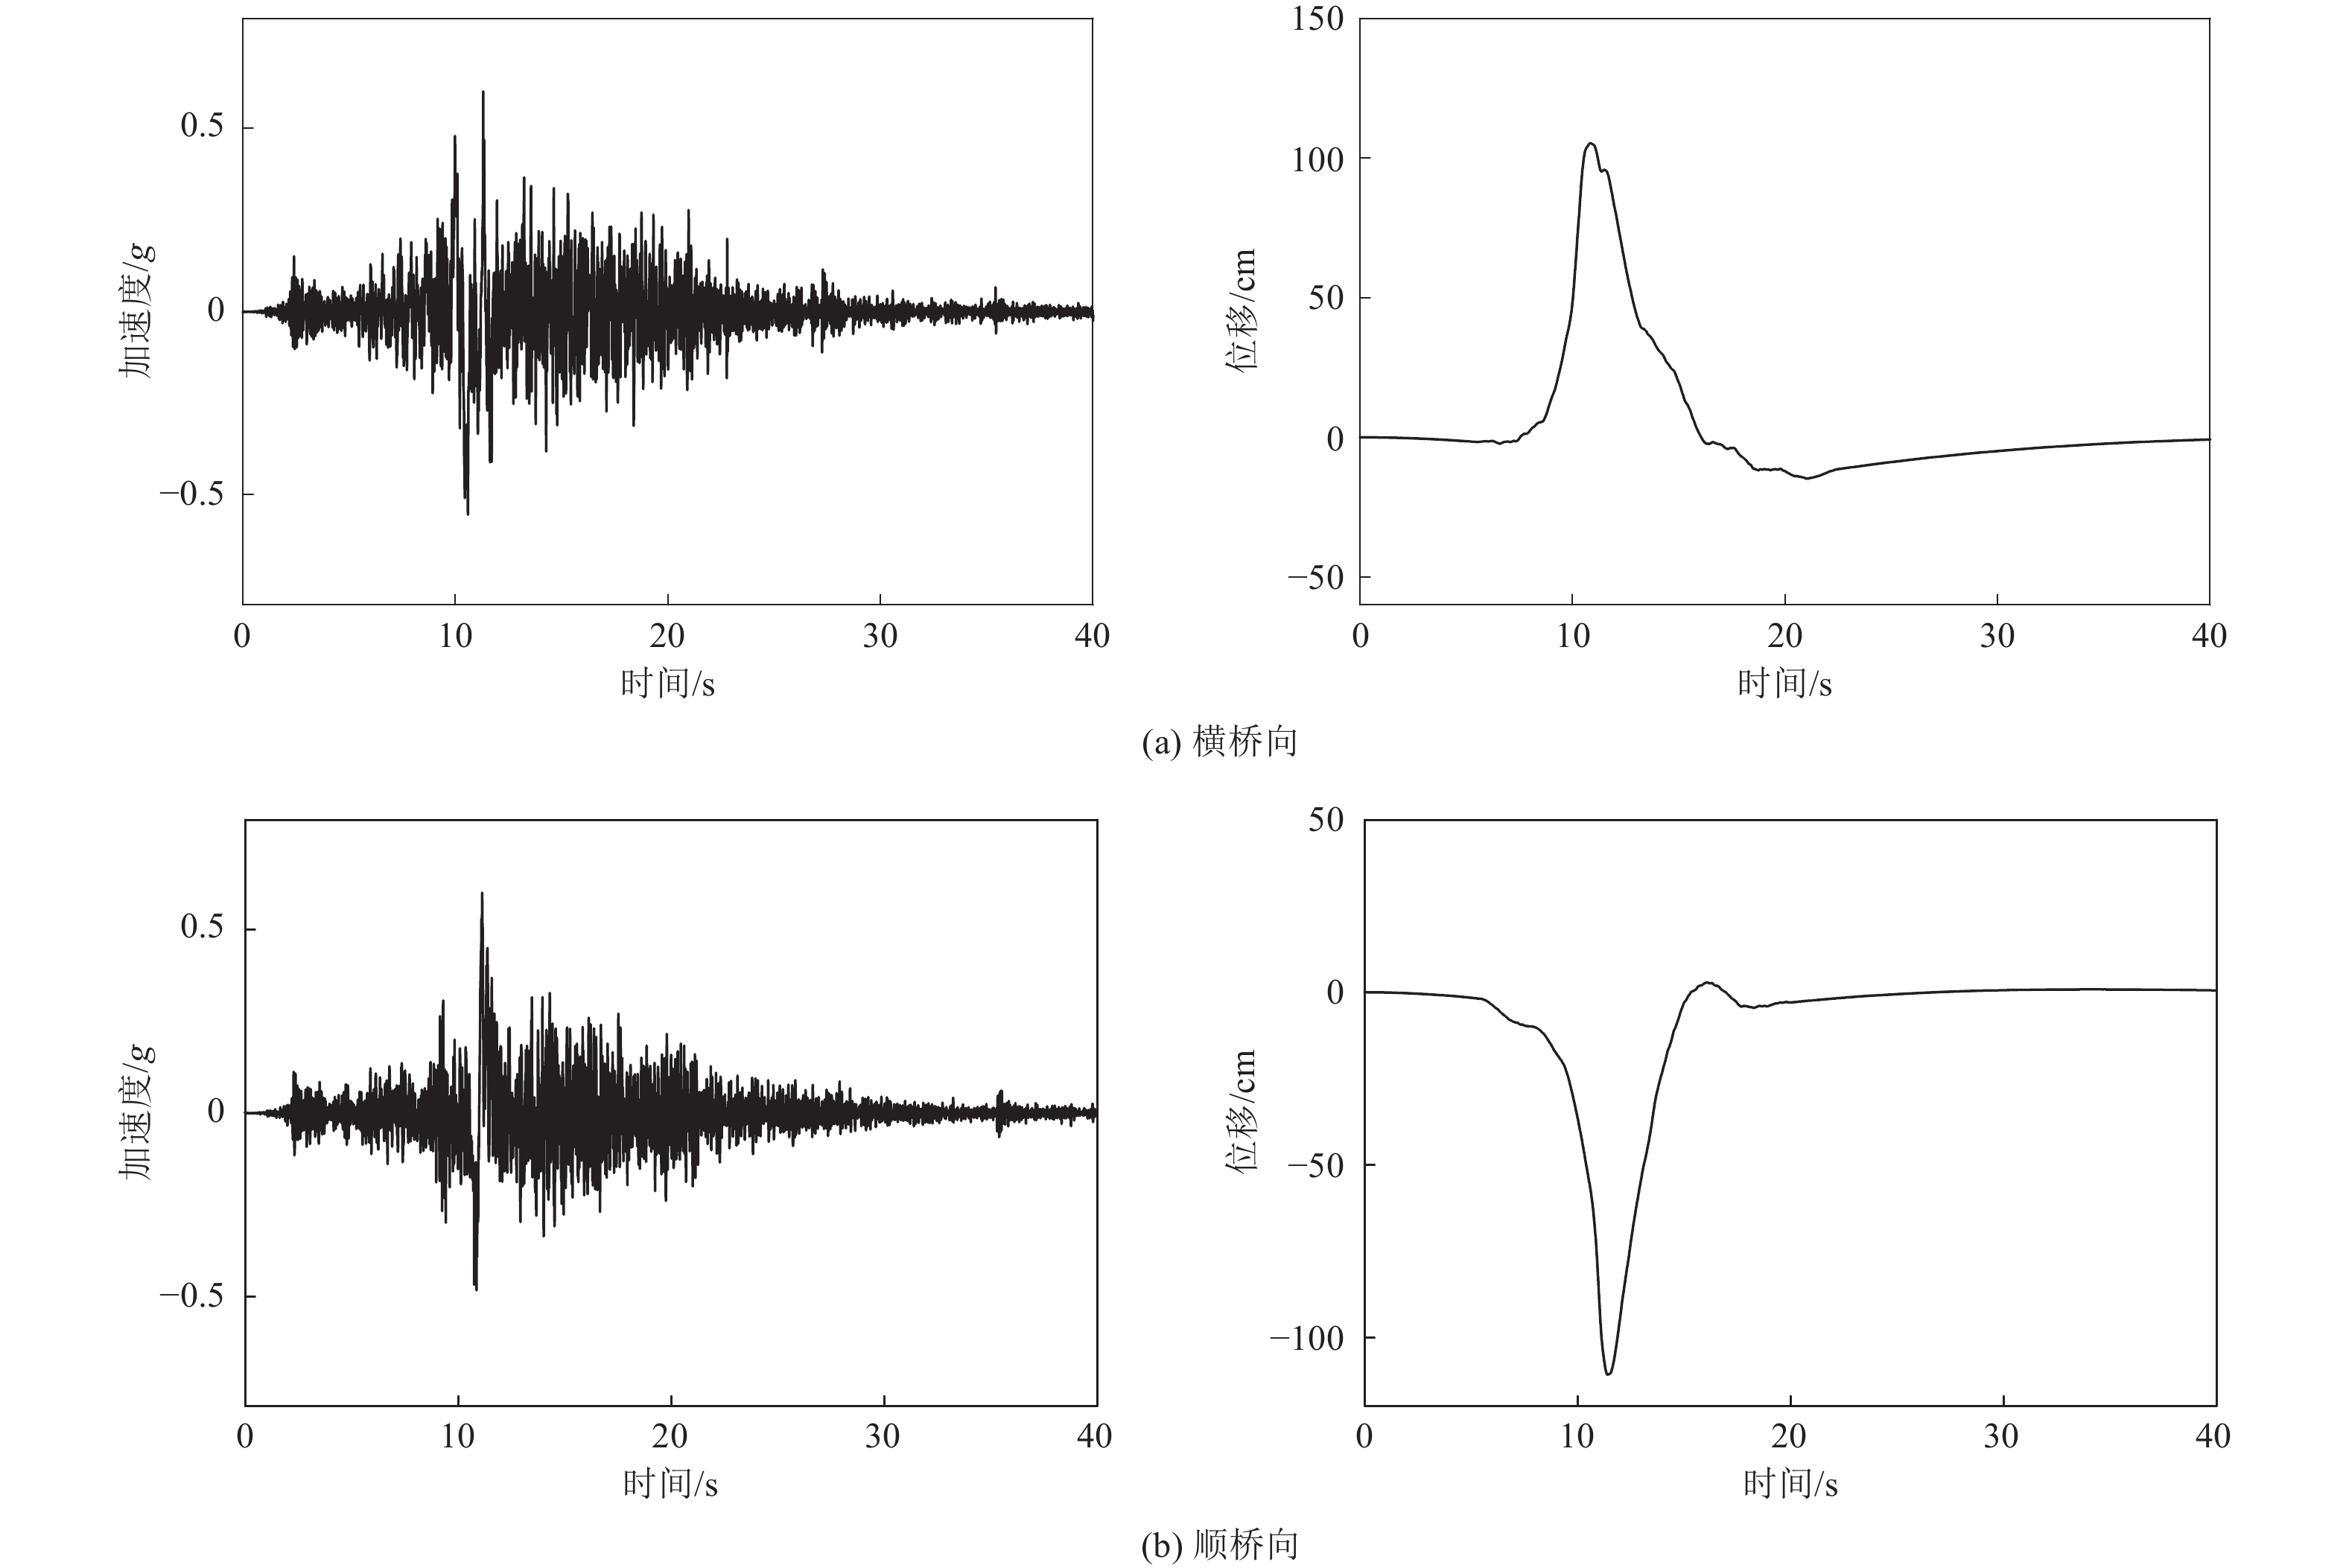
图 4 不考虑永久位移的人工合成地震动时程
Figure 4. Synthetic ground motion time histories without considering permanent displacement
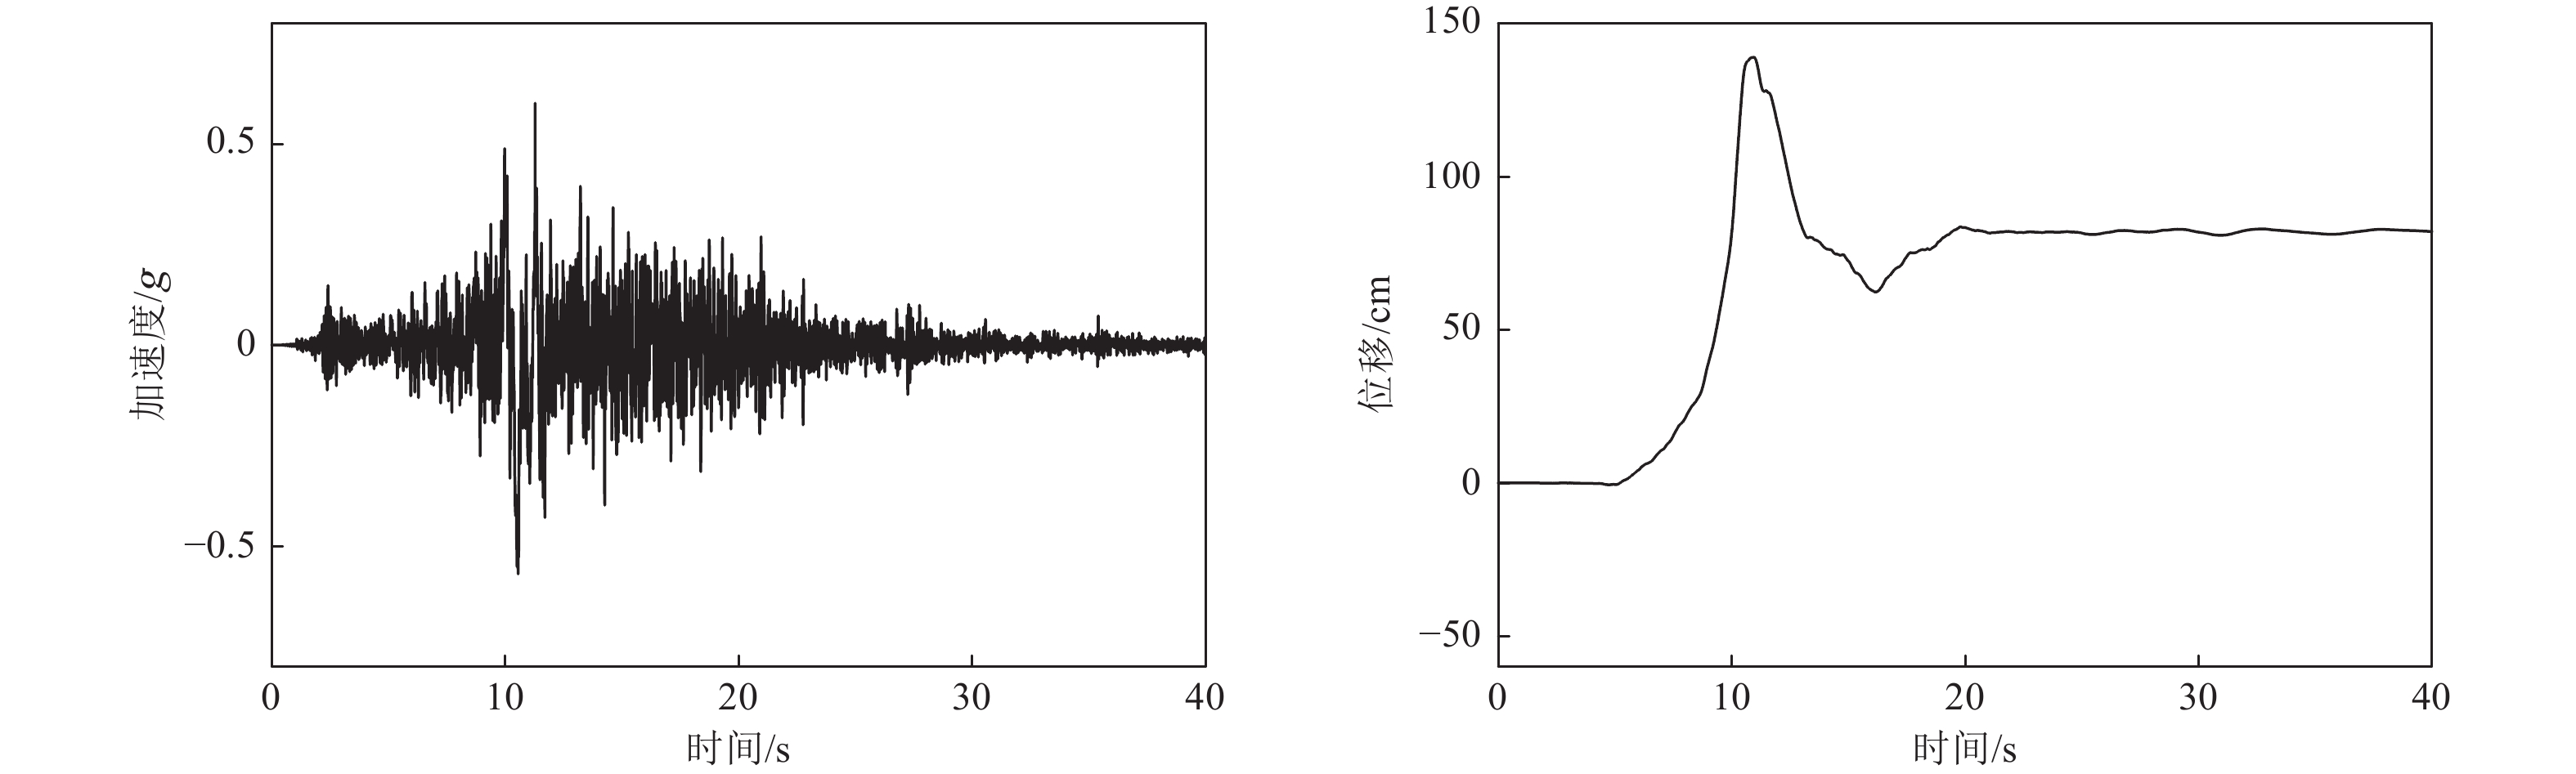
图 5 横桥向考虑永久位移的人工合成地震动时程
Figure 5. Synthetic ground motion time history considering permanent displacement in the transverse direction

图 6 横桥向P3和P4墩顶相对位移时程
Figure 6. Relative displacement time histories on the top of pier P3 and P4 in the transverse direction
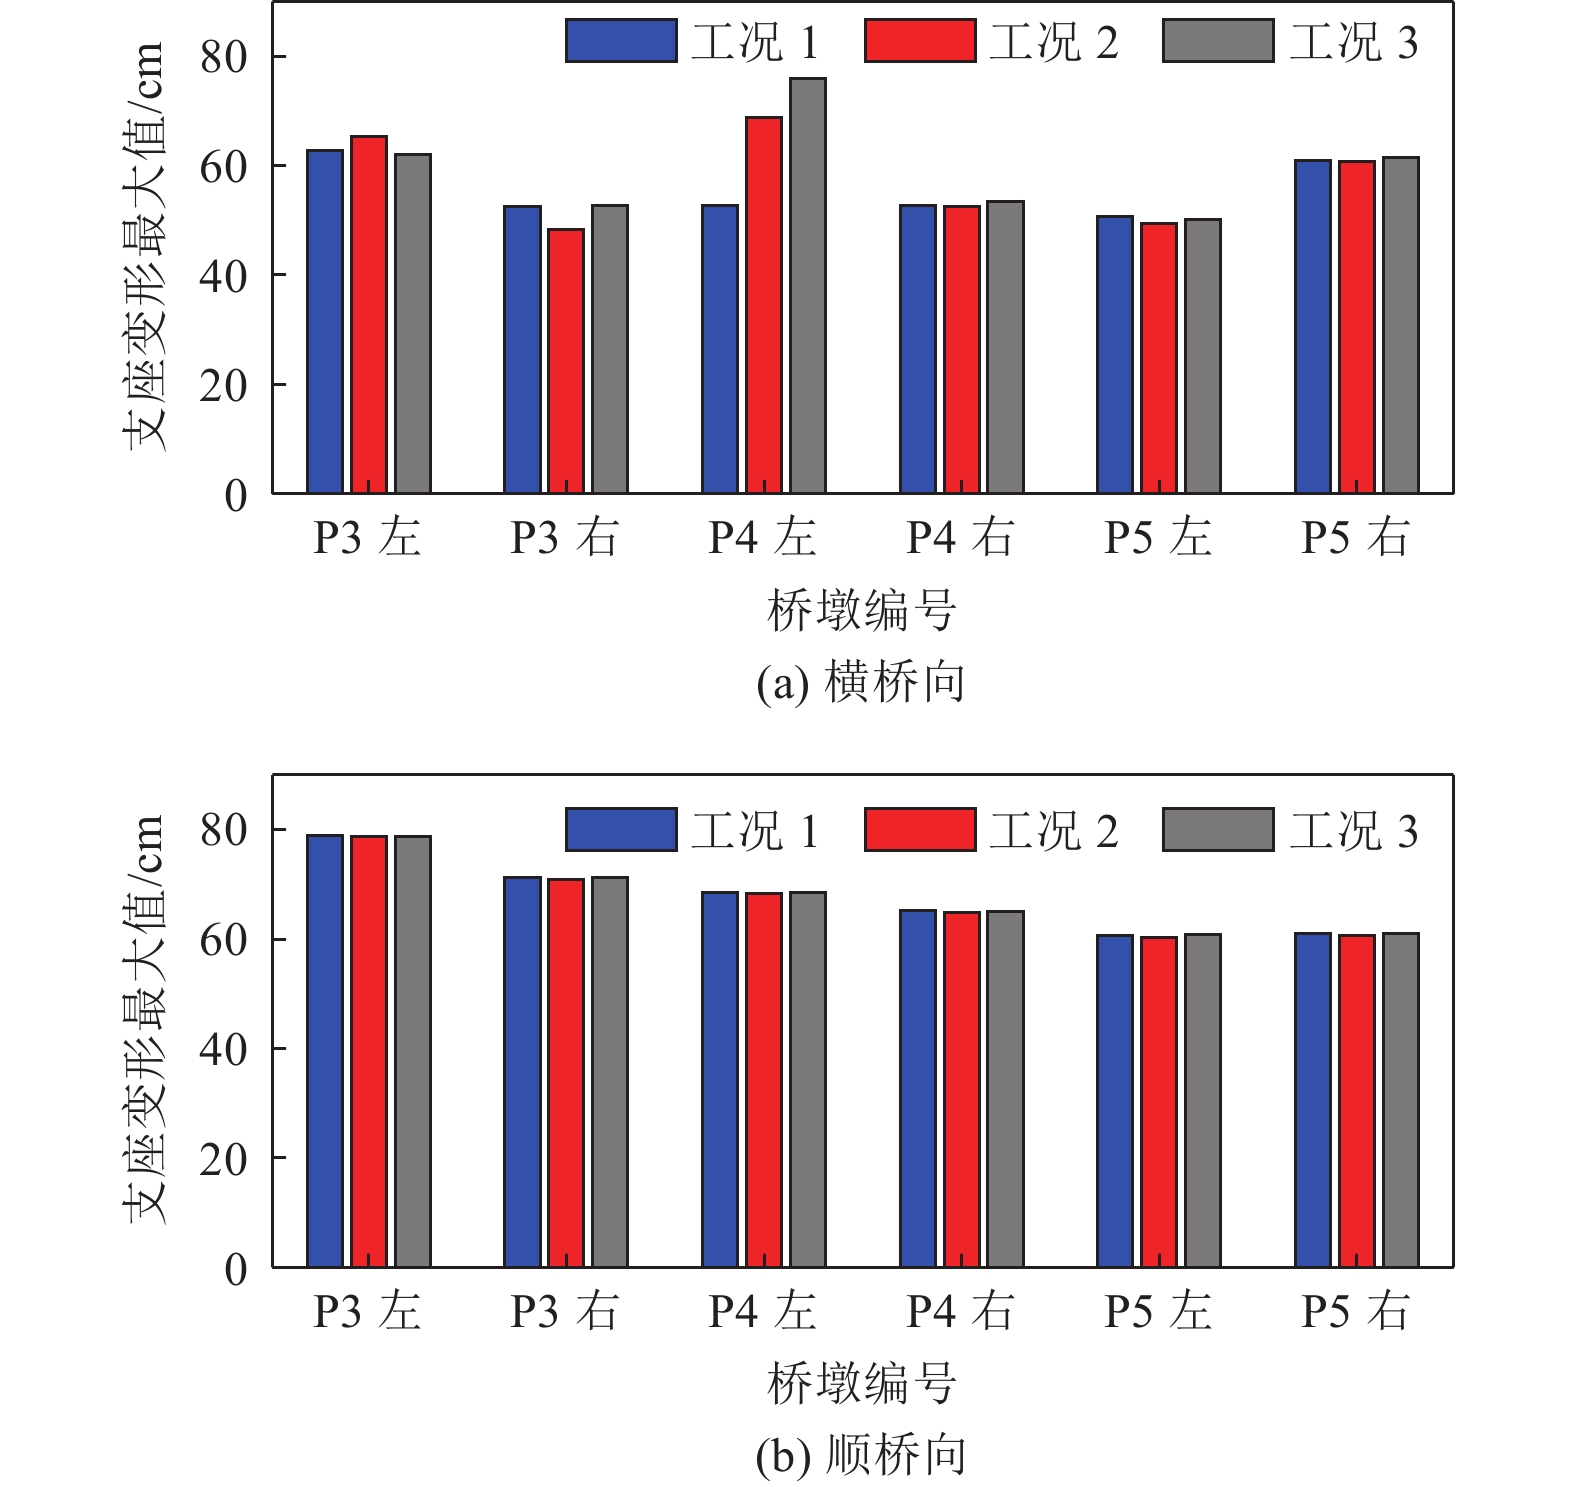
图 7 横桥向和顺桥向桥墩支座变形最大值
Figure 7. Maximum deformation of bearing in the transverse direction and longitudinal direction
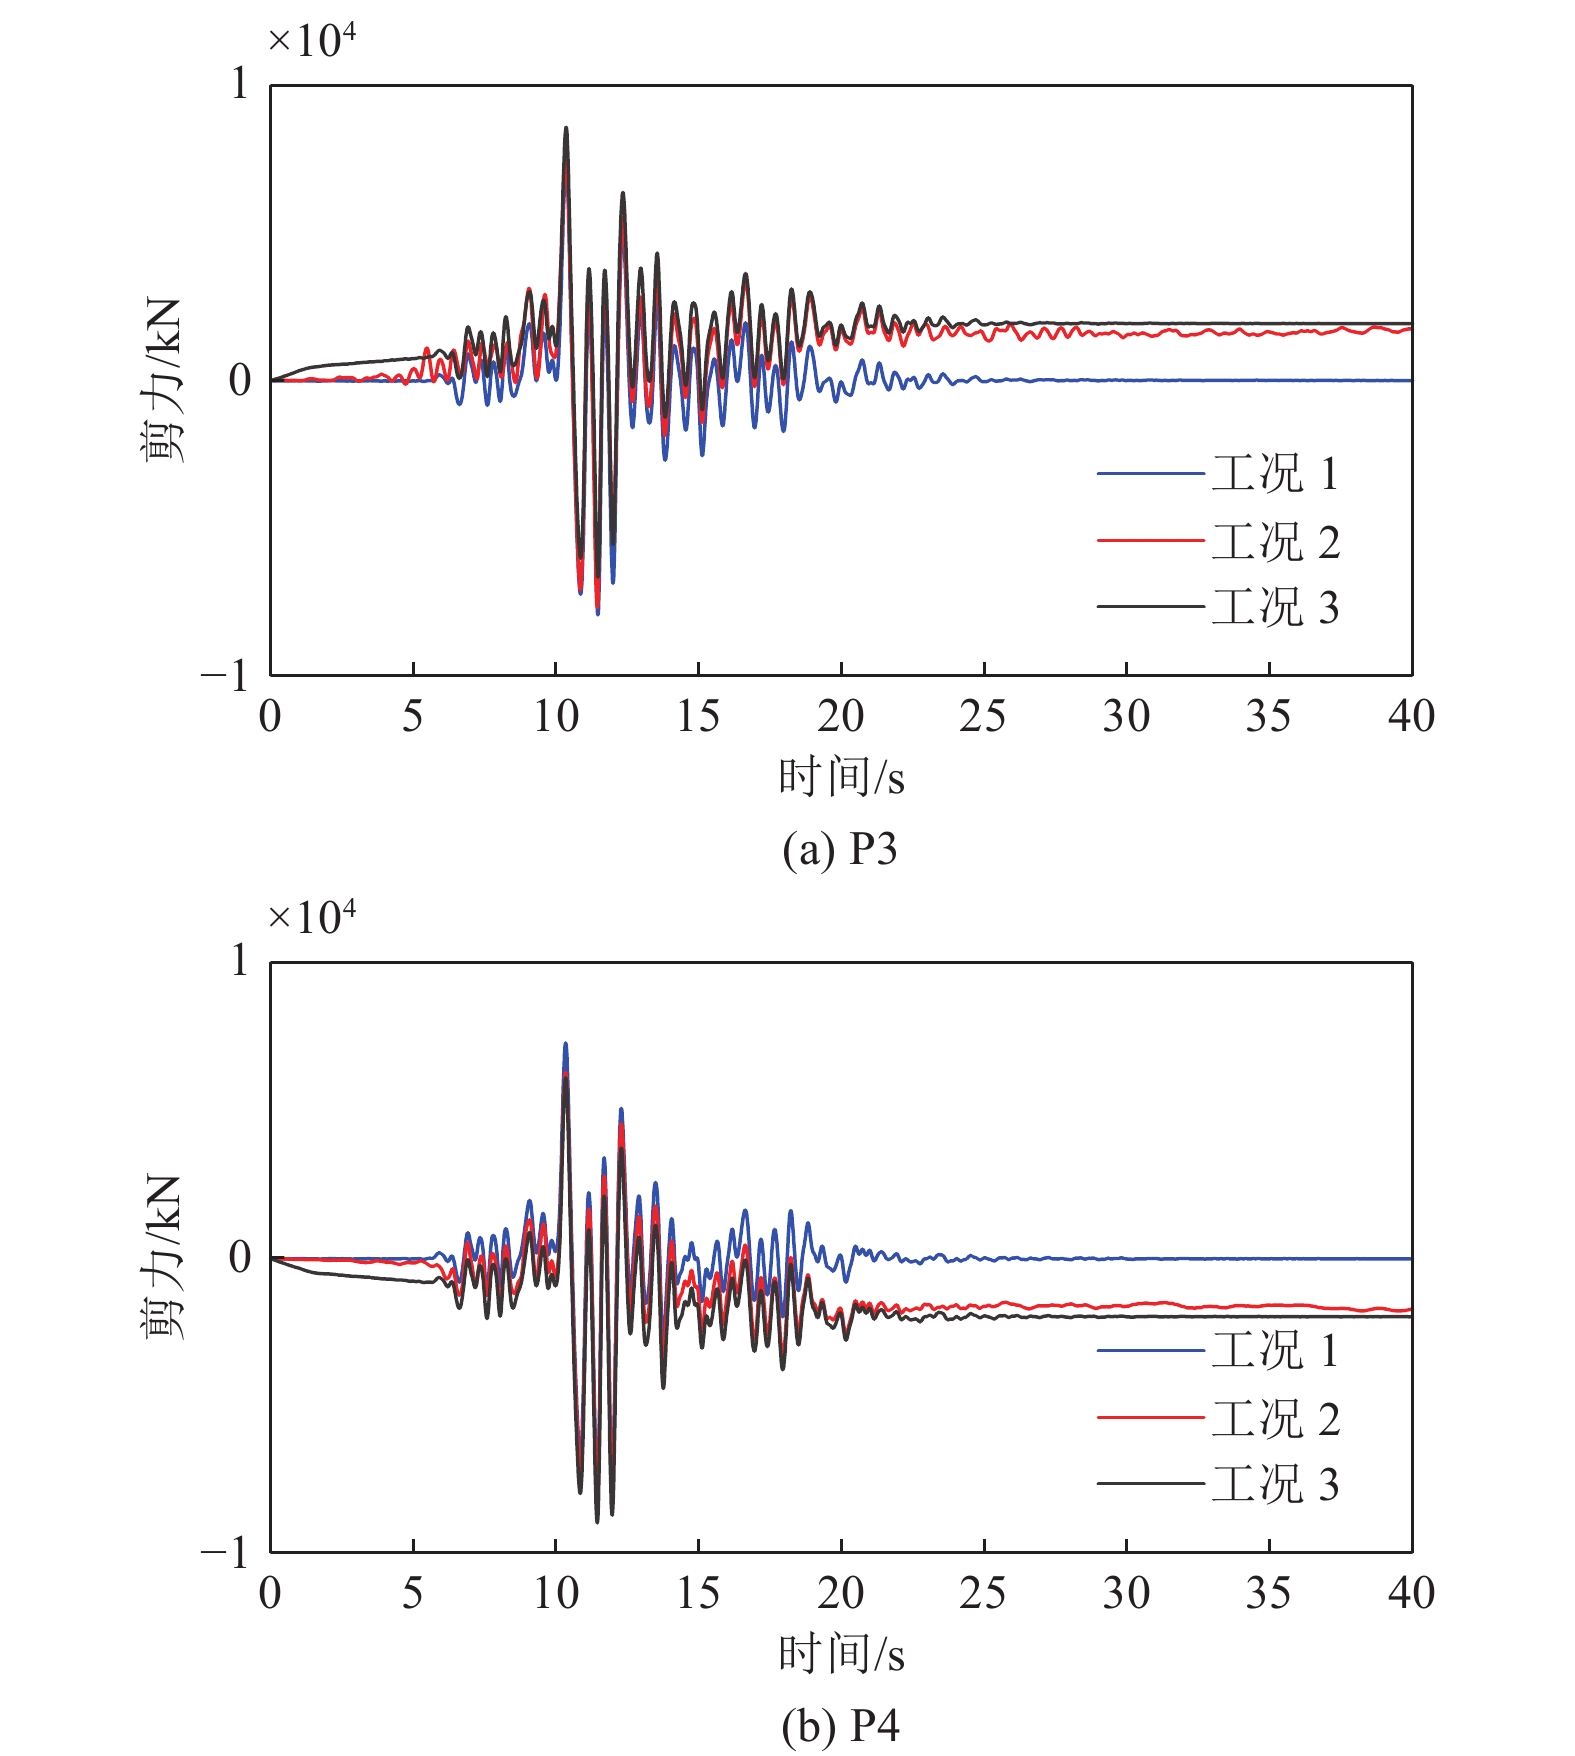
图 8 横桥向P3和P4墩底剪力时程
Figure 8. Shear force time histories at the bottom of the pier P3 and P4 in the transverse direction
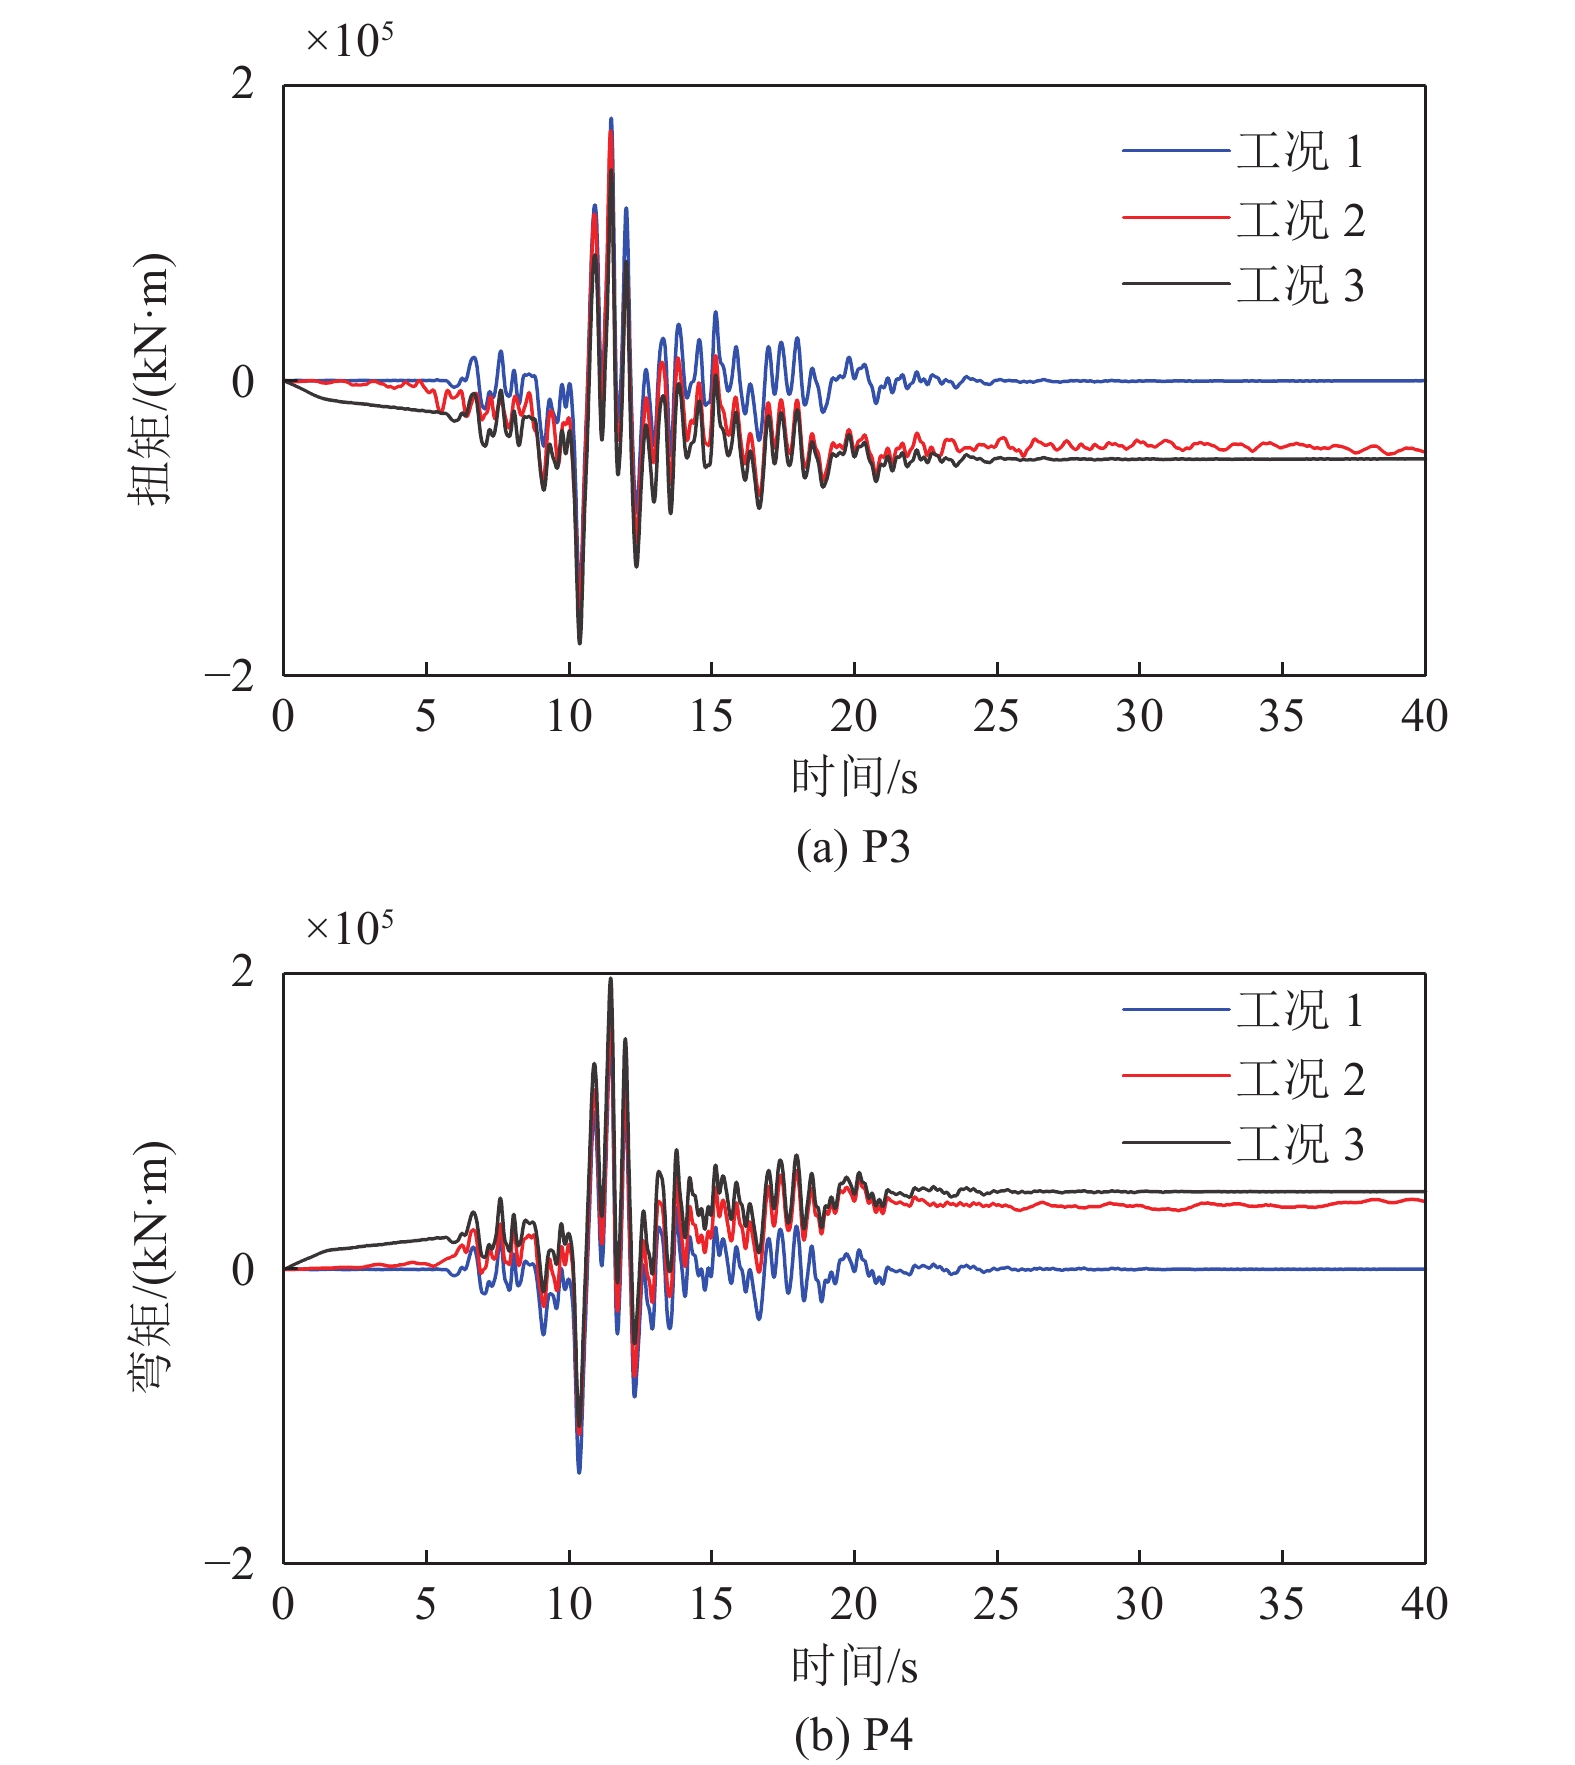
图 9 横桥向P3和P4墩底弯矩时程
Figure 9. Bending moment time histories of at the bottom of the pier P3 and P4 in the transverse direction
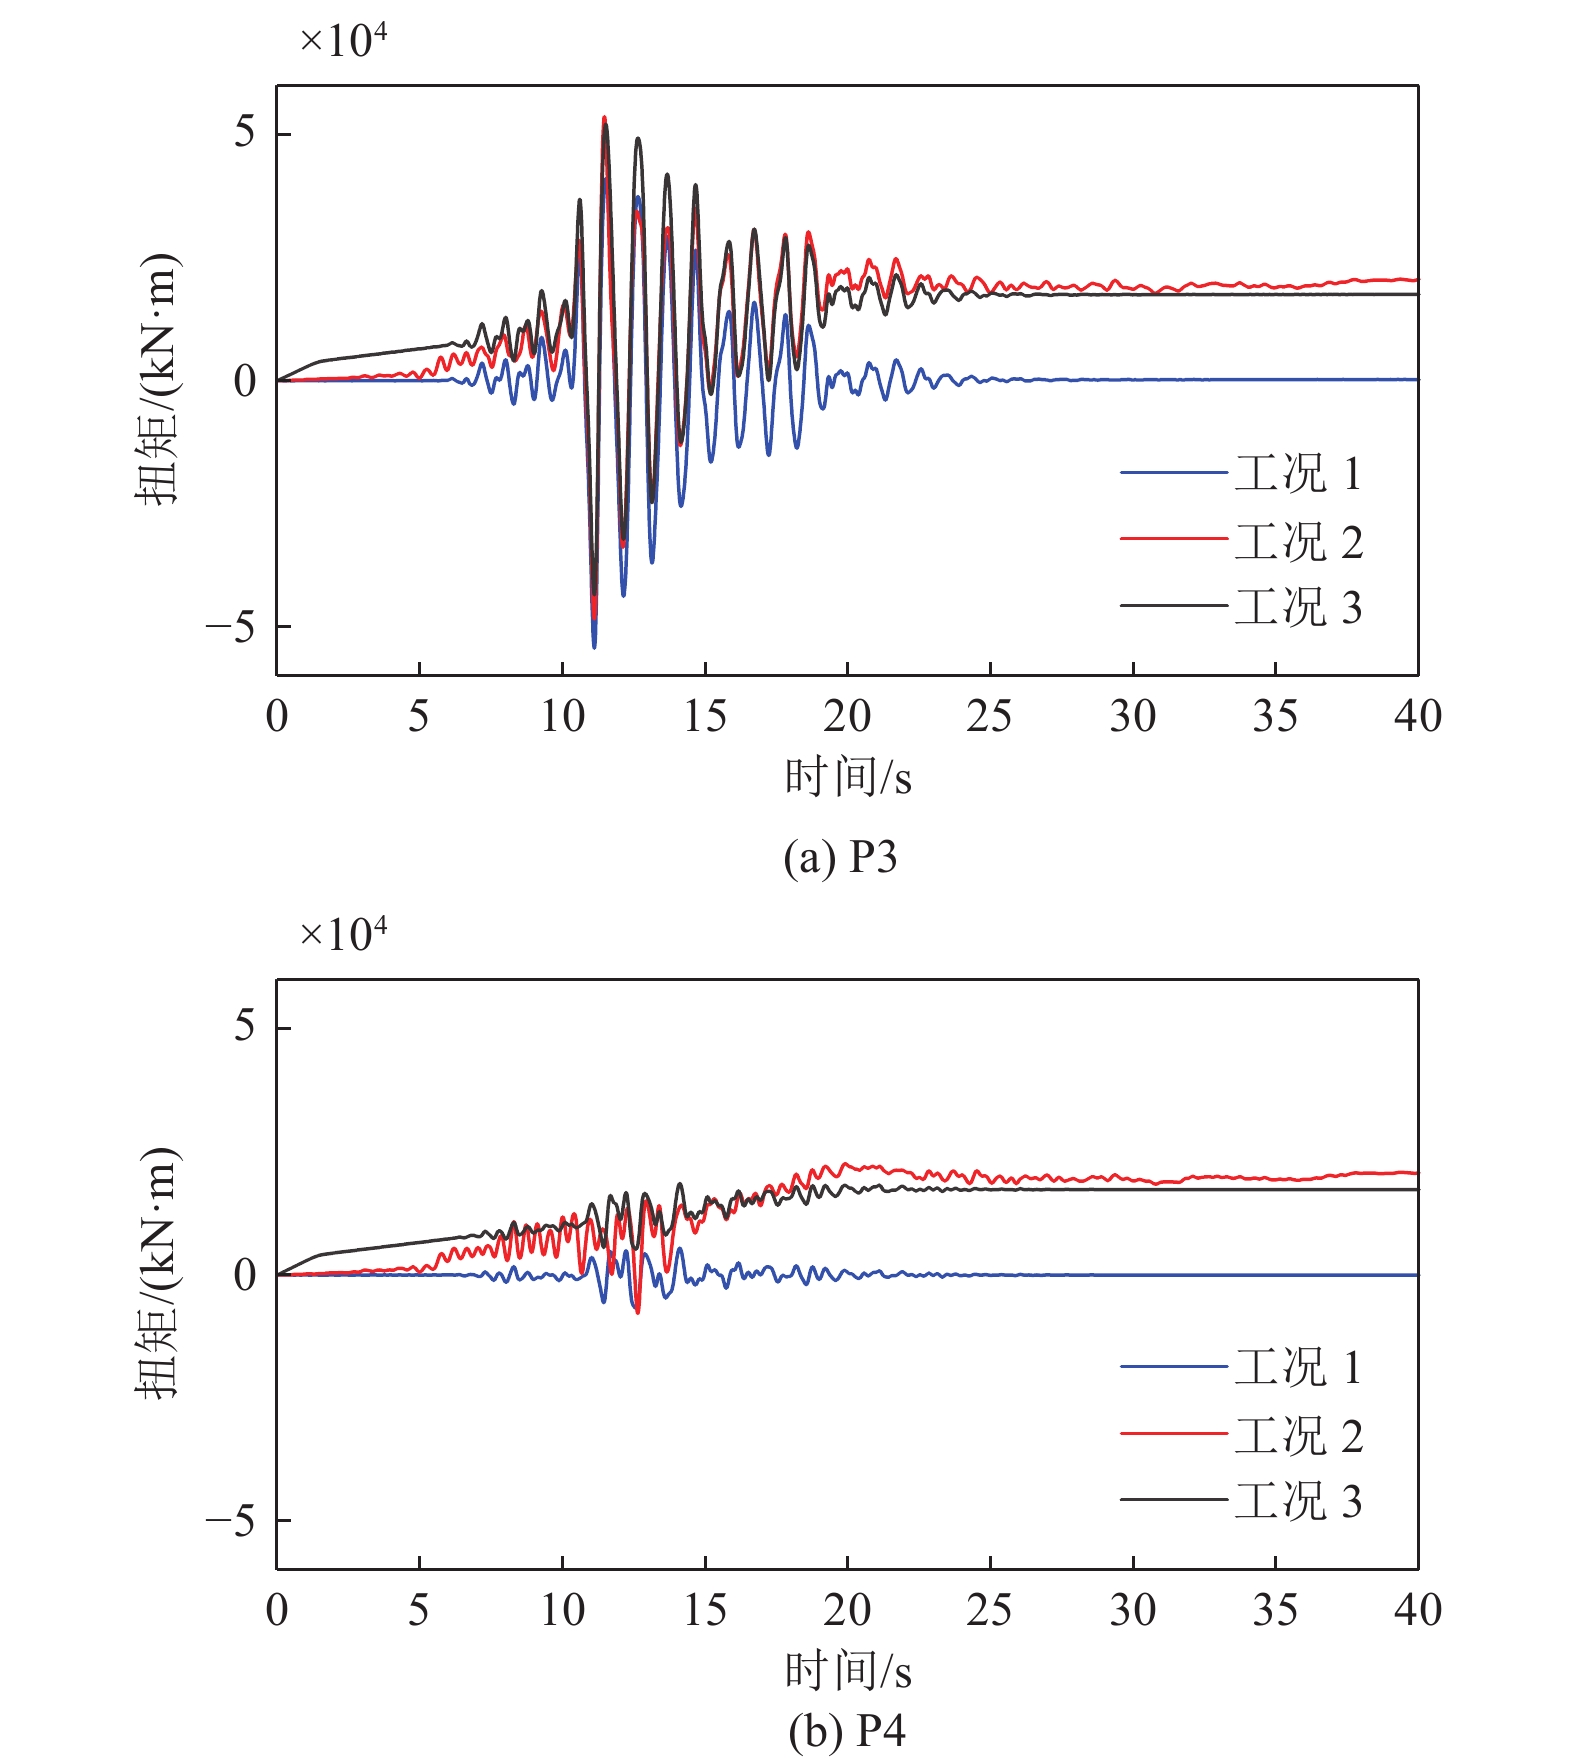
图 10 P3和P4墩底扭矩时程
Figure 10. Torque time histories of at the bottom of the pier P3 and P4 in the transverse direction
表 1 原始地震动时程信息
Table 1. Original ground motion parameters
方向 PGA /g PGV/(cm·s−1) PGD/cm 横桥向 0.73 133.33 113.87 顺桥向 0.79 28.09 25.52  下载: 导出CSV
表 2 合成的地震动时程信息
Table 2. Synthetic ground motion parameters
类别 PGA /g PGV /(cm·s−1) PGD /cm 横桥向不考虑永久位移 0.60 111.97 105.39 横桥向考虑永久位移 0.60 117.79 138.88 顺桥向不考虑永久位移 0.60 118.89 110.84
下载: 导出CSV
表 3 横桥向P3和P4墩顶相对位移最大值和残余值
Table 3. Maximum and residual relative displacement of the pier top at P3 and P4 in the transverse direction
工况 最大值/cm
(残余值/cm)P2 P3 P4 P5 P6 1 9.0580
(−0.1654)4.6155
(−0.0405)3.8598
(−0.0254)6.4269
(−0.1254)5.5834
(−0.1095)2 9.8470
(0.2830)4.4210
(−1.2270)4.1927
(1.1377)6.3951
(−0.0789)5.5772
(−0.0757)3 9.2286
(0.1558)4.7349
(−1.4285)4.7175
(1.2923)6.4440
(−0.1007)5.5611
(−0.1431)
下载: 导出CSV
表 4 横桥向P3和P4墩底剪力最大值和残余值
Table 4. The maximum and residual shear force at the bottom of pier P3 and P4 in the transverse direction
工况 剪力最大值/kN 残余剪力/kN P3 P4 P3 P4 1 7.9340$ \times {10}^{3} $ 7.6760$ \times {10}^{3} $ 0.0044$ \times {10}^{3} $ −0.0084$ \times {10}^{3} $ 2 7.6930$ \times {10}^{3} $ 8.1211$ \times {10}^{3} $ 1.7479$ \times {10}^{3} $ −1.7280$ \times {10}^{3} $ 3 8.5876$ \times {10}^{3} $ 8.9535$ \times {10}^{3} $ 1.9306$ \times {10}^{3} $ −1.9704$ \times {10}^{3} $
下载: 导出CSV
表 5 横桥向P3和P4墩底弯矩最大值和残余值
Table 5. The maximum and residual bending moment at the bottom of pier P3 and P4 in the transverse direction
工况 弯矩最大值 /(kN∙m) 残余弯矩 /(kN∙m) P3 P4 P3 P4 1 1.7790$ \times {10}^{5} $ 1.6317$ \times {10}^{5} $ 0.0016$ \times {10}^{4} $ 0.0328$ \times {10}^{4} $ 2 1.6921$ \times {10}^{5} $ 1.7596$ \times {10}^{5} $ 4.7504$ \times {10}^{4} $ 4.6370$ \times {10}^{4} $ 3 1.7830$ \times {10}^{5} $ 1.9733$ \times {10}^{5} $ 5.2868$ \times {10}^{4} $ 5.2781$ \times {10}^{4} $
下载: 导出CSV
表 6 P3和P4墩底扭矩最大值和残余值
Table 6. The maximum and residual torque at the bottom of pier P3 and P4 in the transverse direction
工况 扭矩最大值 /(kN∙m) 残余扭矩 /(kN∙m) P3 P4 P3 P4 1 5.4362$ \times {10}^{4} $ 0.6780$ \times {10}^{4} $ 0.0225$ \times {10}^{4} $ 0.0054$ \times {10}^{4} $ 2 5.3635$ \times {10}^{4} $ 2.2612$ \times {10}^{4} $ 2.0436$ \times {10}^{4} $ 2.0624$ \times {10}^{4} $ 3 5.2122$ \times {10}^{4} $ 1.8589$ \times {10}^{4} $ 1.7523$ \times {10}^{4} $ 1.7337$ \times {10}^{4} $
下载: 导出CSV
-
陈令坤, 张楠, 夏禾, 2016. 方向脉冲及竖向效应对高铁桥梁地震响应影响. 振动工程学报, 29(4): 704—713Chen L. K. , Zhang N. , Xia H. , 2016. Effects of directivity pulse and vertical earthquake on seismic response of high-speed railway bridge. Journal of Vibration Engineering, 29(4): 704—713. (in Chinese) 杜修力, 韩强, 李忠献等, 2008.5. 12汶川地震中山区公路桥梁震害及启示. 北京工业大学学报, 34(12): 1270—1279Du X. L. , Han Q. , Li Z. X. , et al. , 2008. The seismic damage of bridges in the 2008 Wenchuan earthquake and lessons from its damage. Journal of Beijing University of Technology, 34(12): 1270—1279. (in Chinese) 管仲国, 游瀚, 郭河, 2016. 近断层斜拉桥弹塑性索与阻尼器组合横向减震. 同济大学学报(自然科学版), 44(11): 1653—1659Guan Z. G. , You H. , Guo H. , 2016. Responses of cable-stayed bridge transversely isolated with elasto-plastic cable pairs and fluid viscous damper subjected to near fault ground motions. Journal of Tongji University (Natural Science), 44(11): 1653—1659. (in Chinese) 惠迎新, 王克海, 李冲, 2014. 跨断层地表破裂带桥梁震害研究及抗震概念设计. 公路交通科技, 31(10): 51—57 doi: 10.3969/j.issn.1002-0268.2014.10.009Hui Y. X. , Wang K. H. , Li C. , 2014. Study of seismic damage and seismic conceptual design of bridges across fault surface rupture zones. Journal of Highway and Transportation Research and Development, 31(10): 51—57. (in Chinese) doi: 10.3969/j.issn.1002-0268.2014.10.009 惠迎新, 王克海, 2015 a. 基于多点激励位移输入模型的跨断层桥梁地震动输入方法. 东南大学学报(自然科学版), 45(3): 557—562Hui Y. X. , Wang K. H. , 2015 a. Earthquake motion input method for bridges crossing fault based on multi-support excitation displacement input model. Journal of Southeast University (Natural Science Edition), 45(3): 557—562. (in Chinese) 惠迎新, 王克海, 2015 b. 跨断层桥梁地震响应特性研究. 桥梁建设, 45(3): 70—75Hui Y. X. , Wang K. H. , 2015 b. Study of seismic response features of bridges crossing faults. Bridge Construction, 45(3): 70—75. (in Chinese) 惠迎新, 王克海, 吴刚等, 2015 c. 跨断层桥梁地震响应分析及合理跨越角度研究. 振动与冲击, 34(13): 6—11, 17Hui Y. X. , Wang K. H. , Wu G. , et al. , 2015 c. Seismic responses of bridges crossing faults and their best crossing angles. Journal of Vibration and Shock, 34(13): 6—11, 17. (in Chinese) 惠迎新, 台玉吉, 王克海等, 2017. 跨断层桥梁抗震若干问题探讨. 地震工程学报, 39(5): 870—875, 889Hui Y. X. , Tai Y. J. , Wang K. H. , et al. , 2017. Discussion about earthquake resistance of the bridges crossing the active fault. China Earthquake Engineering Journal, 39(5): 870—875, 889. (in Chinese) 江辉, 朱晞, 倪永军, 2011. 基于谱分析与RC梁桥检验的脉冲型近场地震动强度度量指标. 铁道学报, 33(3): 91—99 doi: 10.3969/j.issn.1001-8360.2011.03.016Jiang H. , Zhu X. , Ni Y. J. , 2011. Intensity indice of impulsive near-fault earthquake ground motion based on spectra analysis and RC bridge check. Journal of the China Railway Society, 33(3): 91—99. (in Chinese) doi: 10.3969/j.issn.1001-8360.2011.03.016 李鸿晶, 陆鸣, 温增平等, 2009. 汶川地震桥梁震害的特征. 南京工业大学学报(自然科学版), 31(1): 24—29Li H. J. , Lu M. , Wen Z. P. , et al. , 2009. Characteristics of bridge damages in Wenchuan earthquake. Journal of Nanjing University of Technology (Natural Science Edition), 31(1): 24—29. (in Chinese) 李建中, 管仲国, 2011. 基于性能桥梁抗震设计理论发展. 工程力学, 28(S2): 24—30, 53Li J. Z. , Guan Z. G. , 2011. Performance-based seismic design for bridges. Engineering Mechanics, 28(S2): 24—30, 53. (in Chinese) 李帅, 张凡, 颜晓伟等, 2017. 近断层地震动合成方法及其对超大跨斜拉桥地震响应影响. 中国公路学报, 30(2): 86—97, 106Li S. , Zhang F. , Yan X. W. , et al. , 2017. Synthetic method for near-fault ground motions and its influence on seismic response of super-span cable-stayed bridge. China Journal of Highway and Transport, 30(2): 86—97, 106. (in Chinese) 李小军, 1992. 场地土层对地震地面运动影响的分析方法. 世界地震工程, 8(2): 49—60. 李小军, 彭青, 2001. 不同类别场地地震动参数的计算分析. 地震工程与工程振动, 21(1): 29—36Li X. J. , Peng Q. , 2001. Calculation and analysis of earthquake ground motion parameters for different site categories. Earthquake Engineering and Engineering Vibration, 21(1): 29—36. (in Chinese) 李小军, 贺秋梅, 亓兴军, 2012. 地震动速度脉冲对大跨斜拉桥减震控制的影响. 应用基础与工程科学学报, 20(2): 272—285Li X. J. , He Q. M. , Qi X. J. , 2012. Seismic mitigation control effects of long-span cable-stayed bridges to ground motions with velocity pulse. Journal of Basic Science and Engineering, 20(2): 272—285. (in Chinese) 刘爱文, 夏珊, 徐超, 2008. 汶川地震交通系统震害及震后抢修. 震灾防御技术, 3(3): 243—450.Liu A. W., Xia S., Xu C., 2008. Damage and emergency recovery of the transportation systems after Wenchuan earthquake. Technology for Earthquake Disaster Prevention, 3(3): 243–250. (in Chinese) 刘启方, 袁一凡, 金星等, 2006. 近断层地震动的基本特征. 地震工程与工程振动, 26(1): 1—10Liu Q. F. , Yuan Y. F. , Jin X. , et al. , 2006. Basic characteristics of near-fault ground motion. Earthquake Engineering and Engineering Vibration, 26(1): 1–10. (in Chinese) 石岩, 王东升, 孙治国, 2014. 近断层地震动下减隔震桥梁地震反应分析. 桥梁建设, 44(3): 19—24Shi Y. , Wang D. S. , Sun Z. G. , 2014. Analysis of seismic response of seismically mitigated and isolated bridge subjected to near-fault ground motion. Bridge Construction, 44(3): 19—24. (in Chinese) 王东升, 杨海红, 王国新, 2005. 考虑邻梁碰撞的多跨长简支梁桥落梁震害分析. 中国公路学报, 18(3): 54—59Wang D. S. , Yang H. H. , Wang G. X. , 2005. Seismic analysis of girders falling down in multi-span long simply supported bridges with adjacent pounding effects. China Journal of Highway and Transport, 18(3): 54—59. (in Chinese) 王东升, 郭迅, 孙治国等, 2009. 汶川大地震公路桥梁震害初步调查. 地震工程与工程振动, 29(3): 84—94Wang D. S. , Guo X. , Sun Z. G. , et al. , 2009. Damage to highway bridges during Wenchuan earthquake. Journal of Earthquake Engineering and Engineering Vibration, 29(3): 84—94. (in Chinese) 王东升, 孙治国, 李晓莉等, 2010. 汶川大地震曲线梁桥震害及破坏机理分析. 防灾减灾工程学报, 30(5): 572—579Wang D. S. , Sun Z. G. , Li X. L. , et al. , 2010. Seismic damage investigation and failure mechanism analysis of curved bridges in Wenchuan earthquake. Journal of Disaster Prevention and Mitigation Engineering, 30(5): 572—579. ( in Chinese 杨怀宇, 李建中, 2015. 断层地震动对隔震桥梁地震响应的影响. 同济大学学报(自然科学版), 43(8): 1144—1152Yang H. Y. , Li J. Z. , 2015. Response analysis of seismic isolated bridge under influence of fault-crossing groundmotions. Journal of Tongji University (Natural Science), 43(8): 1144—1152. (in Chinese) 袁一凡, 田启文, 2012. 工程地震学. 北京: 地震出版社. 中华人民共和国交通运输部, 2014. JTG B02—2013 公路工程抗震规范. 北京: 人民交通出版社.Ministry of Transport of the People's Republic of China, 2014. JTG B02—2013 Specification of seismic design for highway engineering. Beijing: China Communications Press. (in Chinese) 中华人民共和国交通运输部, 2020. JTG/T 2231-01—2020 公路桥梁抗震设计规范. 北京: 人民交通出版社.Ministry of Transport of the People's Republic of China, 2020. JTG/T2231-01—2020 Specifications for seismic design of highway bridges. Beijing: China Communications Press. (in Chinese) 中华人民共和国住房和城乡建设部, 中华人民共和国国家质量监督检验检疫总局, 2010. GB 50011—2010 建筑抗震设计规范. 北京: 中国建筑工业出版社.Ministry of Housing and Urban-Rural Development of the People’s Republic of China, General Administration of Quality Supervision, Inspection and Quarantine of the People’s Republic of China, 2010. GB 50011—2010 Code for seismic design of buildings. Beijing: China Architecture & Building Press. (in Chinese) 周正华, 张艳梅, 孙平善等, 2003. 断层场地震害研究综述. 地震工程与工程振动, 23(5): 38—41 doi: 10.3969/j.issn.1000-1301.2003.05.006Zhou Z. H. , Zhang Y. M. , Sun P. S. , et al. , 2003. A summary of damage study on fault site. Earthquake Engineering and Engineering Vibration, 23(5): 38—41. (in Chinese) doi: 10.3969/j.issn.1000-1301.2003.05.006 Byers W. G. , Edwards C. , Tang A. , et al. , 2000. Performance of transportation systems after the 1999 Kocaeli earthquake. Earthquake Spectra, 16(S1): 403—410. Caltrans, 2012. Bridge design practice . Sacramento: California Department of Transportation. Caltrans, 2019. Seismic design criteria: version 2.0. Sacramento: California Department of Transportation. CEN, 2004. EN 1998-5—2004 Eurocode 8: design of structures for earthquake resistance Part 5: foundation, retaining structures and geotechnical aspects. Brussels: European Committee for Standardization, 14—20. Chang K. C. , Chang D. W. , Tsai M. H. , et al. , 2000. Seismic performance of highway bridges. Earthquake Engineering and Engineering Seismology, 2(1): 55—77. Elgamal A., Lu J., Mackie K., 2014. MSBrindge: OpenSees pushover and earthquake analysis of multi-span bridges - User Manual. San Diego: Department of Structural Engineering, University of California. Ghasemi H., Cooper J. D., Imbsen R., et al., 2000. The November 1999 Duzce earthquake: post-earthquake investigation of the structures on the TEM. Washington: Federal Highway Administration. Goel R. , Qu B. , Tures J. , et al. , 2014. Validation of fault rupture-response spectrum analysis method for curved bridges crossing strike-slip fault rupture zones. Journal of Bridge Engineering, 19(5): 06014002. doi: 10.1061/(ASCE)BE.1943-5592.0000602 Goel R. K., Chopra A. K., 2008. Analysis of ordinary bridges crossing fault-rupture zones. In: The 14 th World Conference on Earthquake Engineering. Beijing. Goel R. K. , Chopra A. K. , 2009 a. Linear analysis of ordinary bridges crossing fault-rupture zones. Journal of Bridge Engineering, 14(3): 203—215. doi: 10.1061/(ASCE)1084-0702(2009)14:3(203) Goel R. K. , Chopra A. K. , 2009 b. Nonlinear analysis of ordinary bridges crossing fault-rupture zones. Journal of Bridge Engineering, 14(3): 216—224. doi: 10.1061/(ASCE)1084-0702(2009)14:3(216) Güney D. , Acar M. , Özlüdemir M. T. , et al. , 2010. Investigation of post-earthquake displacements in viaducts using Geodetic and Finite Element Methods. Natural Hazards and Earth System Sciences, 10(12): 2579—2587. doi: 10.5194/nhess-10-2579-2010 He W. L. , Agrawal A. K. , 2008. Analytical model of ground motion pulses for the design and assessment of seismic protective systems. Journal of Structural Engineering, 134(7): 1177—1188. doi: 10.1061/(ASCE)0733-9445(2008)134:7(1177) Hsu Y. T. , Fu C. C. , 2004. Seismic effect on highway bridges in Chi Chi earthquake. Journal of Performance of Constructed Facilities, 18(1): 47—53. doi: 10.1061/(ASCE)0887-3828(2004)18:1(47) Imbsen R. A. , Roblee C. J. , Yashinsky M. , et al. , 2000. Impact on highway structures. Earthquake Spectra, 16(S1): 411—435. Kitagawa Y. , Hiraishi H. , 2004. Overview of the 1995 Hyogo-Ken Nanbu earthquake and proposals for earthquake mitigation measures. Journal of Japan Association for Earthquake Engineering, 4 (3): 1—29. doi: 10.5610/jaee.4.3_1 Li S. , Zhang F. , Wang J. Q. , et al. , 2017. Effects of near-fault motions and artificial pulse-type ground motions on super-span cable-stayed bridge systems. Journal of Bridge Engineering, 22(3): 04016128. doi: 10.1061/(ASCE)BE.1943-5592.0001008 Mackie K. R. , Lu J. C. , Elgamal A. , 2012. Performance-based earthquake assessment of bridge systems including ground-foundation interaction. Soil Dynamics and Earthquake Engineering, 42: 184—196. doi: 10.1016/j.soildyn.2012.05.023 Makris N. , Chang S. P. , 2000. Effect of viscous, viscoplastic and friction damping on the response of seismic isolated structures. Earthquake Engineering & Structural Dynamics, 29(1): 85—107. Mavroeidis G. P. , Papageorgiou A. S. , 2003. A mathematical representation of near-fault ground motions. Bulletin of the Seismological Society of America, 93(3): 1099—1131. doi: 10.1785/0120020100 Park S. W. , Ghasemi H. , Shen J. , et al. , 2004. Simulation of the seismic performance of the Bolu Viaduct subjected to near‐fault ground motions. Earthquake Engineering & Structural Dynamics, 33(13): 1249—1270. Roussis P. C. , Constantinou M. C. , Erdik M. , et al. , 2003. Assessment of performance of seismic isolation system of bolu viaduct. Journal of Bridge Engineering, 8(4): 182—190. doi: 10.1061/(ASCE)1084-0702(2003)8:4(182) Sehhati R. , Rodriguez-Marek A. , ElGawady M. , et al. , 2011. Effects of near-fault ground motions and equivalent pulses on multi-story structures. Engineering Structures, 33(3): 767—779. doi: 10.1016/j.engstruct.2010.11.032 Sengupta A. , Quadery L. , Sarkar S. , et al. , 2016. Influence of bidirectional near-fault excitations on RC bridge piers. Journal of Bridge Engineering, 21(7): 04016034. doi: 10.1061/(ASCE)BE.1943-5592.0000836 Somerville P. G., 2003. Magnitude scaling of the near fault rupture directivity pulse. Physics of the Earth and Planetary Interiors, 137(1—4): 201—212. Wang N. , Elgamal A. , Shantz T. , 2017. Recorded seismic response of the Samoa Channel Bridge-foundation system and adjacent downhole array. Soil Dynamics and Earthquake Engineering, 92: 358—376. doi: 10.1016/j.soildyn.2016.09.034 Yan G. Y. , Chen F. Q. , 2015. Seismic performance of midstory isolated structures under near-field pulse-like ground motion and limiting deformation of isolation layers. Shock and Vibration, 2015: 730612. Yang S. , Mavroeidis G. P. , 2018. Bridges crossing fault rupture zones: a review. Soil Dynamics and Earthquake Engineering, 113: 545—571. doi: 10.1016/j.soildyn.2018.03.027 -

 点击查看大图

计量
- 文章访问数: 309
- HTML全文浏览量: 159
- PDF下载量: 99
- 被引次数: 0
