
Research on Building Area Extraction Method of SAR Image Integrating ULBP and Gabor Texture Features
-
摘要: 建筑区提取对于地震灾情快速评估和地震灾害风险识别至关重要,合成孔径雷达(SAR)影像的纹理特征研究可在建筑区提取方面发挥重要作用。利用全极化SAR影像,提出综合使用ULBP纹理特征和Gabor纹理特征的建筑区提取方法。在SAR数据预处理的基础上,首先对基于Gabor滤波的纹理特征影像进行主成分分析,保留前2个最优主成分纹理特征影像;然后与ULBP纹理特征进行波段组合;最后利用支持向量机监督分类方法对组合后的影像进行分类,获得建筑区。研究结果表明,综合使用ULBP纹理特征和Gabor纹理特征可得到更高的建筑区提取精度,总体分类精度达90%,Kappa系数为0.78。Abstract: Building area extraction is very important for the rapid assessment of earthquake disasters and the identification of earthquake disaster risks. Research on texture features of synthetic aperture radar ( SAR ) images can play an important role in building area extraction. Using fully polarimetric SAR images, a building area extraction method using ULBP texture features and Gabor texture features is proposed. On the basis of SAR data preprocessing, the texture feature image based on the Gabor filter is analyzed by principal component analysis, the first two optimal principal component texture feature images are retained. Then, band combination is performed with ULBP texture features. Finally, the support vector machine supervised classification method is used to classify the combined image to obtain the building area. The results show that the comprehensive use of the ULBP texture feature and Gabor texture features can obtain higher building area extraction accuracy, the overall classification accuracy is 90 %, and the Kappa coefficient is 0.78.
-
Key words:
- SAR image /
- ULBP texture feature /
- Gabor texture feature /
- Building area extraction
-
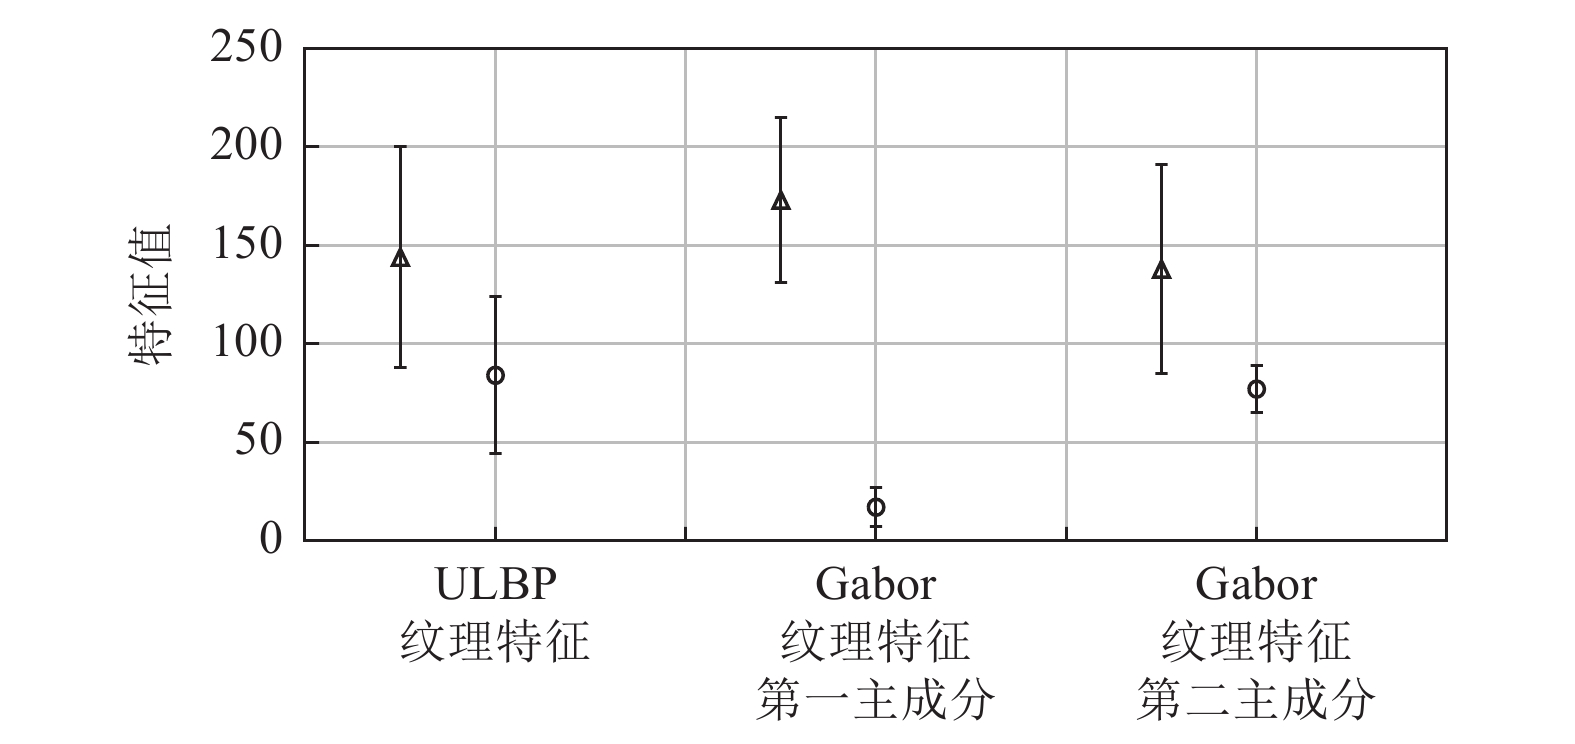
图 6 纹理特征影像的建筑区与非建筑区均值-方差分布
Figure 6. The mean-variance distribution diagram of texture feature image in building area and no-building area
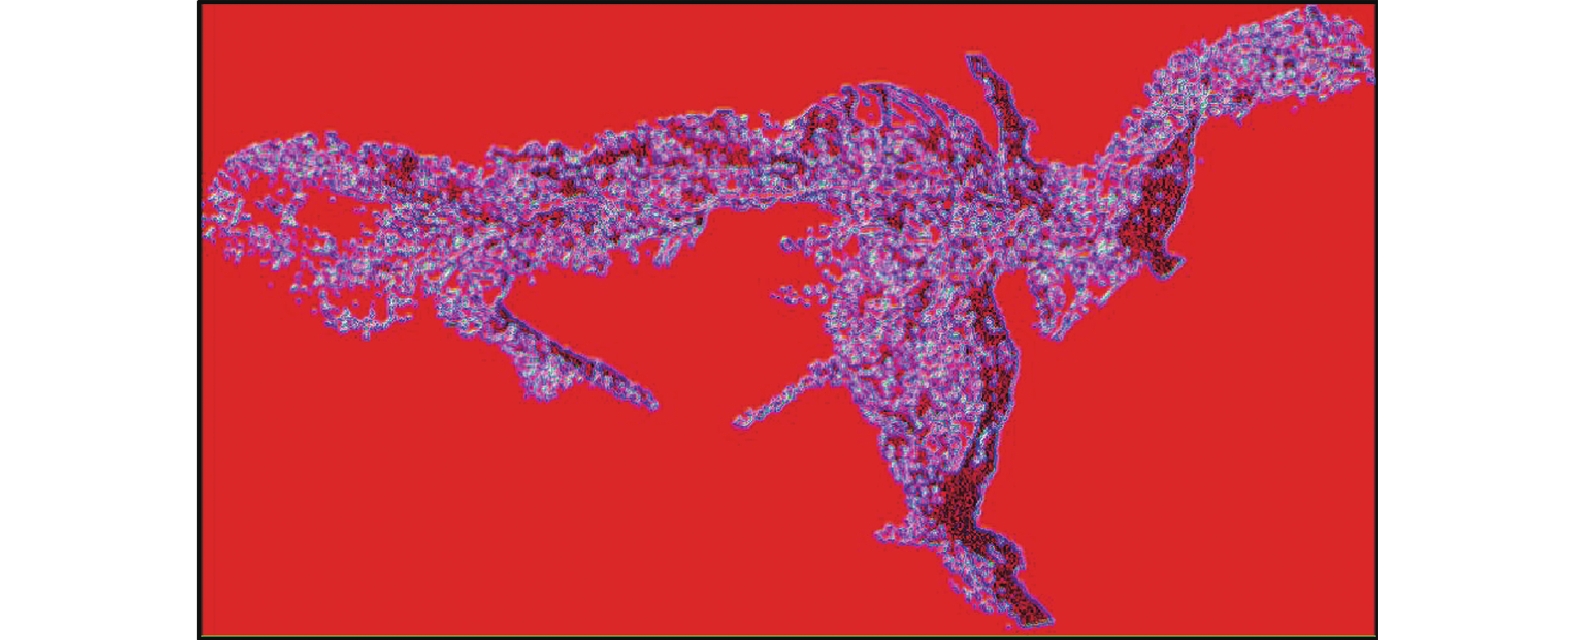
图 8 综合LBP、Gabor纹理特征主成分的特征组合影像
Figure 8. Feature combination image combining LBP and Gabor texture feature principal components
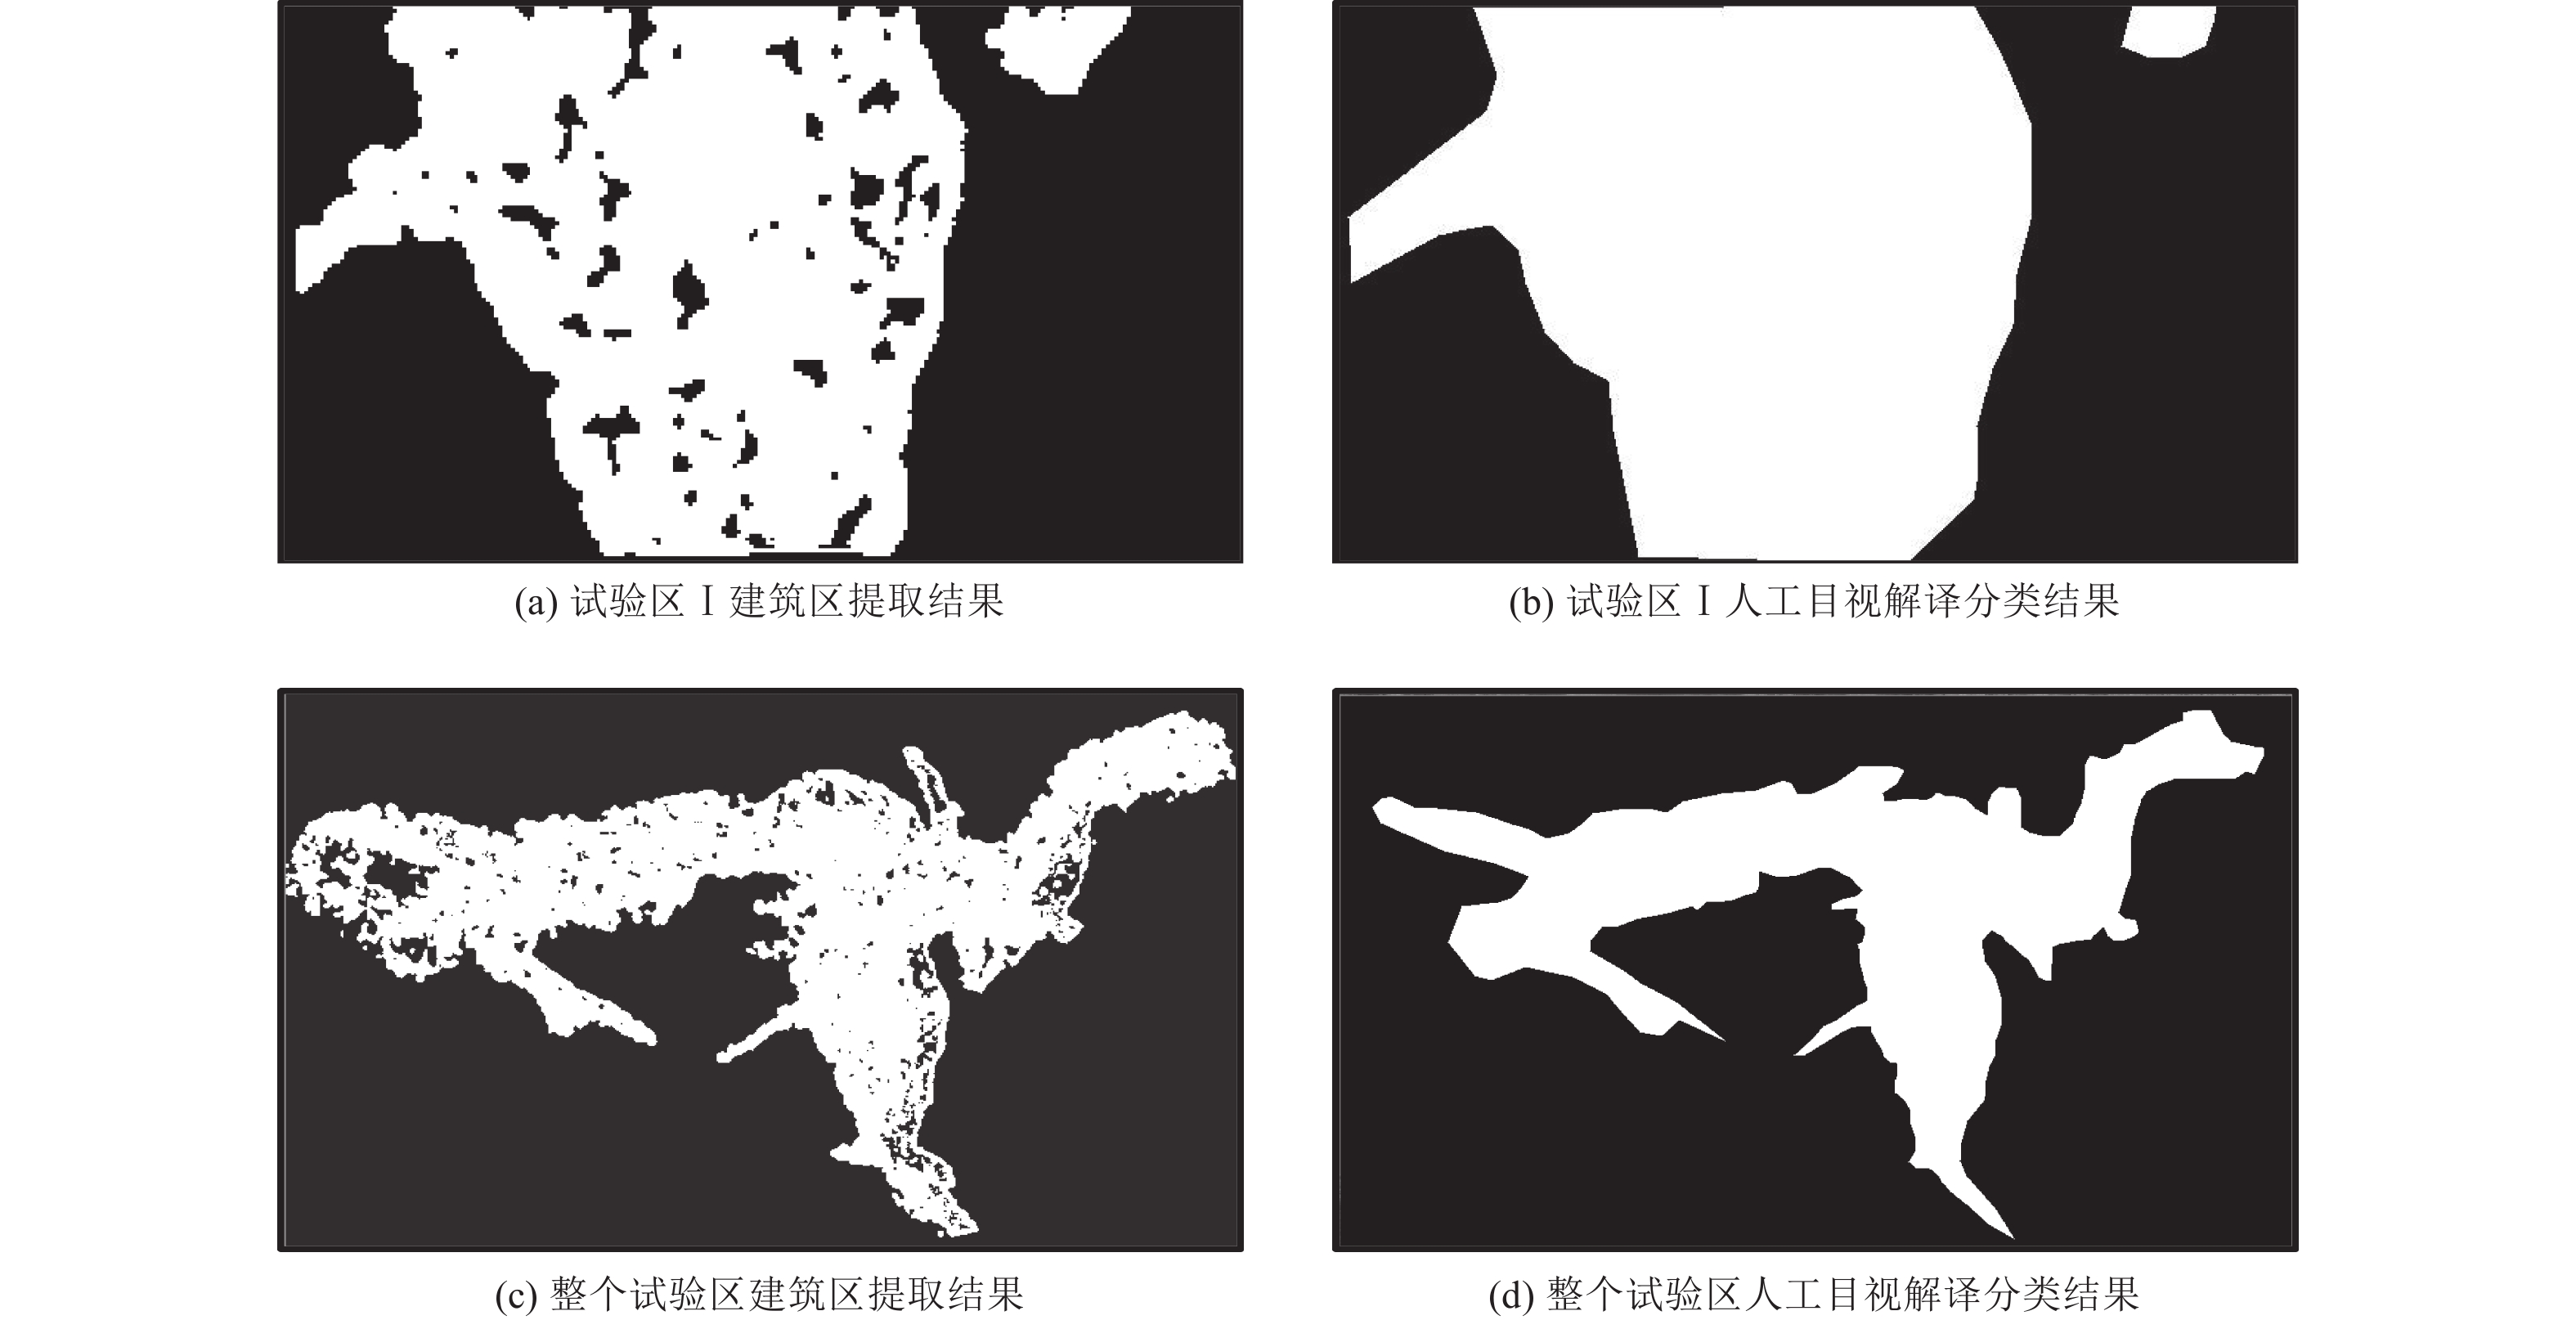
图 9 综合LBP、Gabor纹理特征主成分的建筑区提取结果
Figure 9. Extraction results of building area based on LBP and Gabor texture features principal components
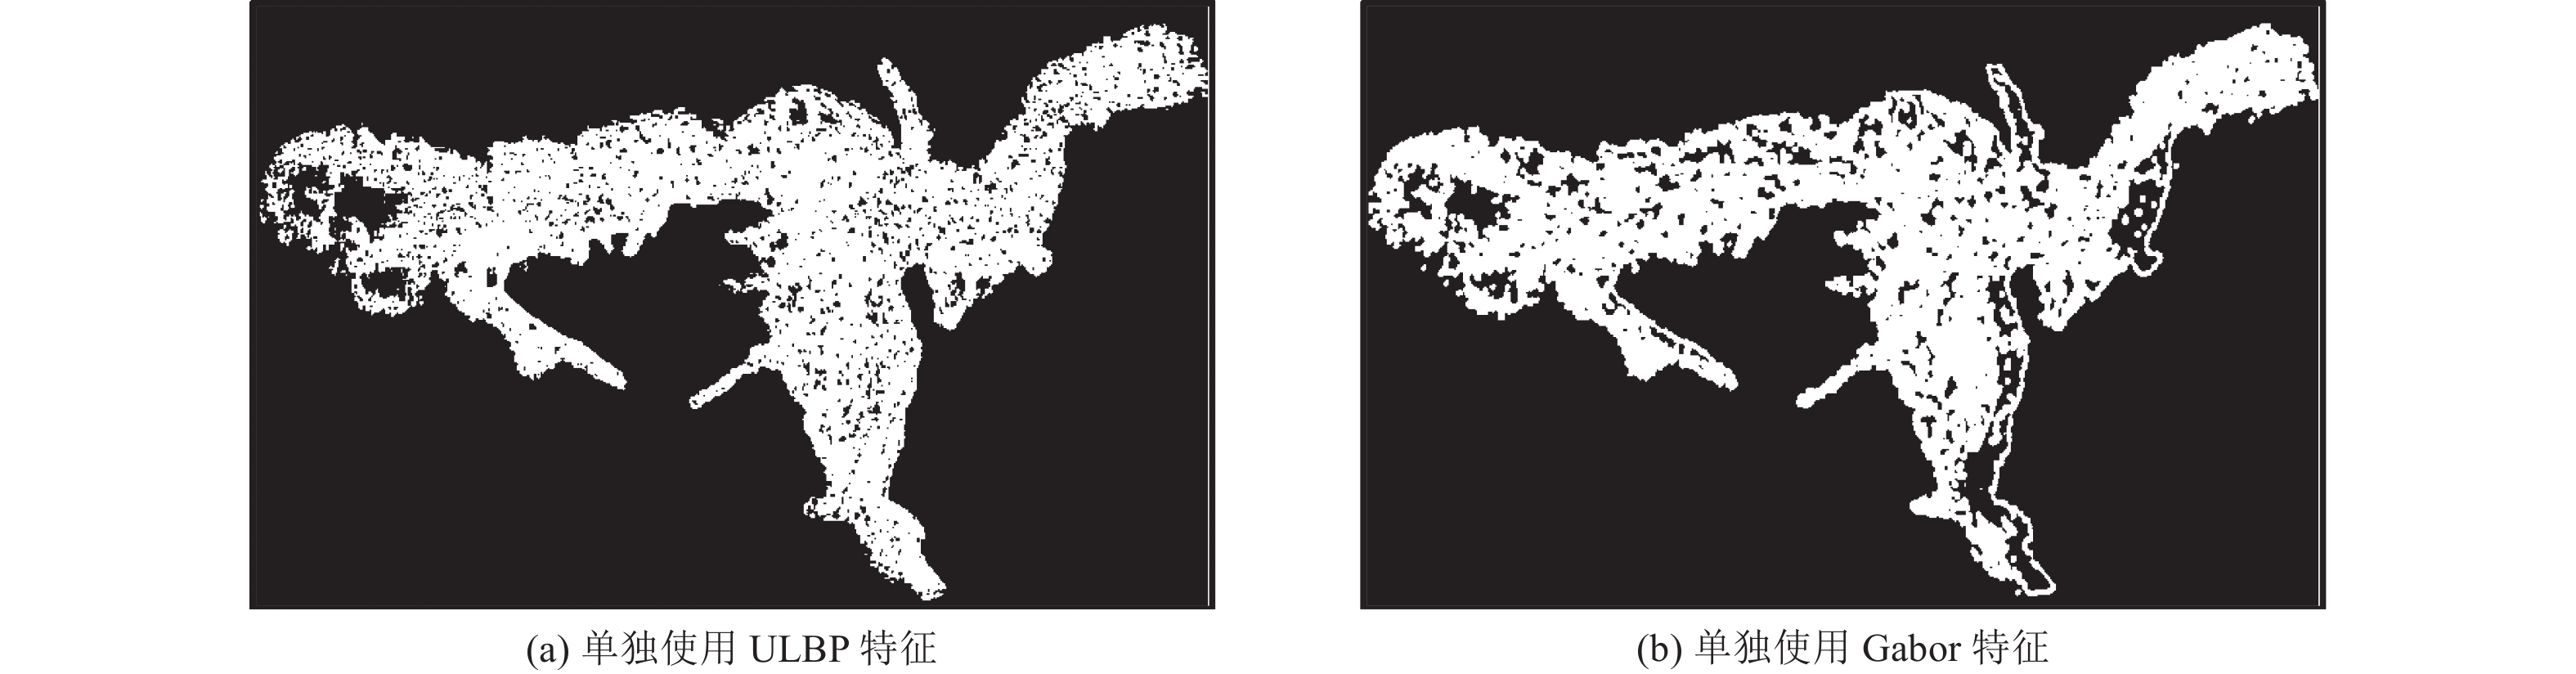
图 10 单独使用ULBP、Gabor纹理特征的建筑区提取结果
Figure 10. Extraction results of building area using LBP and Gabor texture features alone
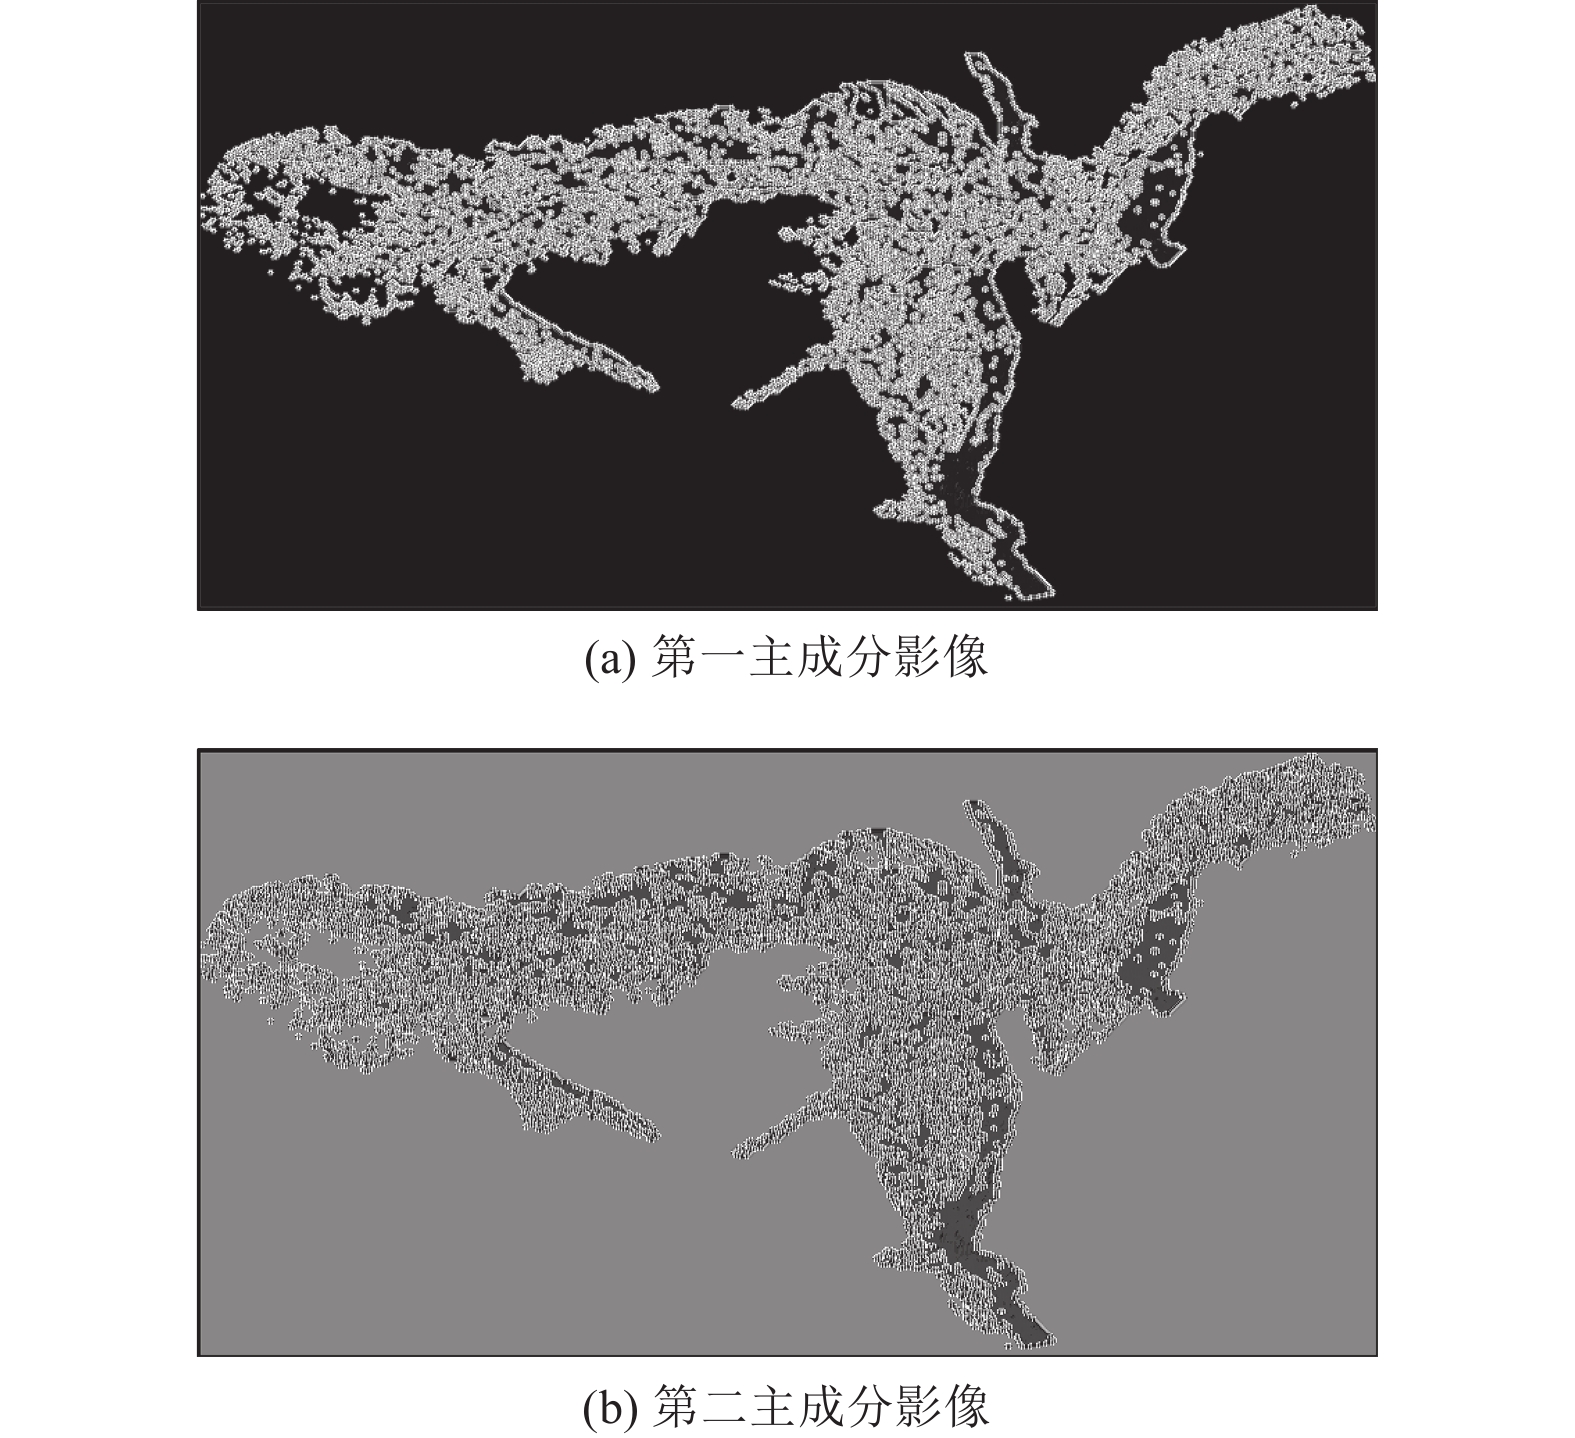
表 1 Gabor纹理特征主成分分析的特征值和累计贡献率
Table 1. Eigenvalue and cumulative contribution rate of Gabor texture feature principal component analysis
主分量序号 特征值 累计贡献率/% 1 169 895.662 9 78.57 2 35 276.230 6 94.89 3 4 141.754 3 96.80 4 3 023.798 2 98.20 5 2 138.256 2 99.19 6 1 011.151 3 99.66 7 527.956 9 99.90 8 180.849 1 100.00  下载: 导出CSV
表 2 试验区混淆矩阵及精度评价
Table 2. Confusion matrix and accuracy evaluation of experimental area
方法 类别 非建筑区/ m2 建筑区/ m2 总数/ m2 错分率/% 误分率/% 生产者精度 /% 用户精度/% Kappa系数 综合使用ULBP、Gabor纹理特征 非建筑区 258 436 25 560 283 996 8 6 94 91 0.78 建筑区 17 933 120 017 137 950 13 18 82 87 总体精度/% 90 单独使用ULBP纹理特征 非建筑区 238 958 75 461 314 419 24 5 95 76 0.57 建筑区 11 233 113 576 124 809 9 40 60 91 总体精度/% 80 单独使用Gabor纹理特征 非建筑区 259 773 53 207 312 980 17 4 96 83 0.64 建筑区 13 295 112 894 126 189 11 32 68 89 总体精度/% 84
下载: 导出CSV
-
邓鸿儒, 崔宸洋, 单文龙等, 2018. 基于高分三号卫星SAR影像的城市建筑区提取. 地理信息世界, 25(6): 79—84 doi: 10.3969/j.issn.1672-1586.2018.06.015Deng H. R. , Cui C. Y. , Shan W. L. , et al. , 2018. Urban building area extraction based on GF-3 satellite SAR images. Geomatics World, 25(6): 79—84. (in Chinese) doi: 10.3969/j.issn.1672-1586.2018.06.015 邓磊, 李京, 聂娟等, 2008. 抑制斑点噪声的SAR与多光谱图像融合方法. 自然灾害学报, 17(6): 87—90 doi: 10.3969/j.issn.1004-4574.2008.06.018Deng L. , Li J. , Nie J. , et al. , 2008. A method fusing SAR with multi-spectral image and reducing speckle noise. Journal of Natural Disasters, 17(6): 87—90. (in Chinese) doi: 10.3969/j.issn.1004-4574.2008.06.018 杜妍开, 龚丽霞, 李强等, 2021. 基于多纹理特征融合的震后SAR图像倒塌建筑物信息提取. 遥感技术与应用, 36(4): 865—872Du Y. K. , Gong L. X. , Li Q. , et al. , 2021. Earthquake induced building damage assessment on SAR multi-texture feature fusion. Remote Sensing Technology and Application, 36(4): 865—872. (in Chinese) 李向辉, 陈一祥, 王海斌等, 2015. 基于Gabor滤波和局部特征点密度的居民区提取. 国土资源遥感, 27(3): 59—64Li X. H. , Chen Y. X. , Wang H. B. , et al. , 2015. Urban area detection based on Gabor filtering and density of local feature points. Remote Sensing for Land & Resources, 27(3): 59—64. (in Chinese) 刘康, 2012. 基于高分辨率SAR影像提取建筑物高度的研究. 武汉: 武汉大学.Liu K., 2012. Advanced methods for building height extraction from high resolution SAR images. Wuhan: Wuhan University. (in Chinese) 孙萍, 2013. 极化SAR图像建筑物提取方法研究. 北京: 首都师范大学. 谭衢霖, 2002. 鄱阳湖湿地生态环境遥感变化监测研究. 北京: 中国科学院研究生院(遥感应用研究所).Tan Q. L., 2002. Study on remote sensing change detection and its application to Poyang international importance wetland. Beijing: Graduate University of Chinese Academy of Sciences Institute of Remote Sensing Applications. (in Chinese) 王军敏, 李宁, 王艳辉, 2019. 基于Gabor特征和局部二值模式融合的纹理图像识别. 平顶山学院学报, 34(5): 32—36 doi: 10.3969/j.issn.1673-1670.2019.05.007Wang J. M. , Li N. , Wang Y. H. , 2019. Texture image recognition based on the fusion of Gabor features and local binary patterns. Journal of Pingdingshan University, 34(5): 32—36. (in Chinese) doi: 10.3969/j.issn.1673-1670.2019.05.007 吴樊, 王超, 张红, 2005. 基于纹理特征的高分辨率SAR影像居民区提取. 遥感技术与应用, 20(1): 148—152 doi: 10.3969/j.issn.1004-0323.2005.01.027Wu F. , Wang C. , Zhang H. , 2005. Residential areas extraction in high resolution SAR image based on texture features. Remote Sensing Technology and Application, 20(1): 148—152. (in Chinese) doi: 10.3969/j.issn.1004-0323.2005.01.027 徐佳, 陈媛媛, 黄其欢等, 2012. 综合灰度与纹理特征的高分辨率星载SAR图像建筑区提取方法研究. 遥感技术与应用, 27(5): 692—698 doi: 10.11873/j.issn.1004-0323.2012.5.692Xu J. , Chen Y. Y. , Huang Q. H. , et al. , 2012. Built-up areas extraction in high resolution spaceborne SAR image based on the integration of grey and texture features. Remote Sensing Technology and Application, 27(5): 692—698. (in Chinese) doi: 10.11873/j.issn.1004-0323.2012.5.692 赵凌君, 秦玉亮, 高贵等, 2009. 利用GLCM纹理分析的高分辨率SAR图像建筑区检测. 遥感学报, 13(3): 483—490 doi: 10.11834/jrs.20090311Zhao L. J. , Qin Y. L. , Gao G. , et al. , 2009. Detection of built-up areas from high-resolution SAR images using the GLCM textural analysis. Journal of Remote Sensing, 13(3): 483—490. (in Chinese) doi: 10.11834/jrs.20090311 Gabor D. , 1946. Theory of communication. Part 1: The analysis of information. Journal of the Institution of Electrical Engineers - Part III: Radio and Communication Engineering, 93(26): 429—441. doi: 10.1049/ji-3-2.1946.0074 Hu D. Y., Li X. J., Zhao W. J., et al., 2009. Texture analysis and its application for single-band SAR thematic information extraction. In: 2008 IEEE International Geoscience and Remote Sensing Symposium. Boston: IEEE. Ojala T. , Pietikainen M. , Harwood D. , 1996. A comparative study of texture measures with classification based on featured distributions. Pattern Recognition, 29(1): 51—59. doi: 10.1016/0031-3203(95)00067-4 Ojala T. , Pietikainen M. , Maenpaa T. , 2002. Multiresolution gray-scale and rotation invariant texture classification with local binary patterns. IEEE Transactions on Pattern Analysis and Machine Intelligence, 24(7): 971—987. doi: 10.1109/TPAMI.2002.1017623 Tison C. , Nicolas J. M. , Tupin F. , et al. , 2004. A new statistical model for Markovian classification of urban areas in high-resolution SAR images. IEEE Transactions on Geoscience and Remote Sensing, 42(10): 2046—2057. doi: 10.1109/TGRS.2004.834630 Zhai W. , Shen H. F. , Huang C. L. , et al. , 2016. Fusion of polarimetric and texture information for urban building extraction from fully polarimetric SAR imagery. Remote Sensing Letters, 7(1): 31—40. doi: 10.1080/2150704X.2015.1101179 -


 点击查看大图
计量
- 文章访问数: 227
- HTML全文浏览量: 41
- PDF下载量: 33
- 被引次数: 0
