
Pushover Analysis Method of Underground Structures Subjected to Multiple Earthquake Records
-
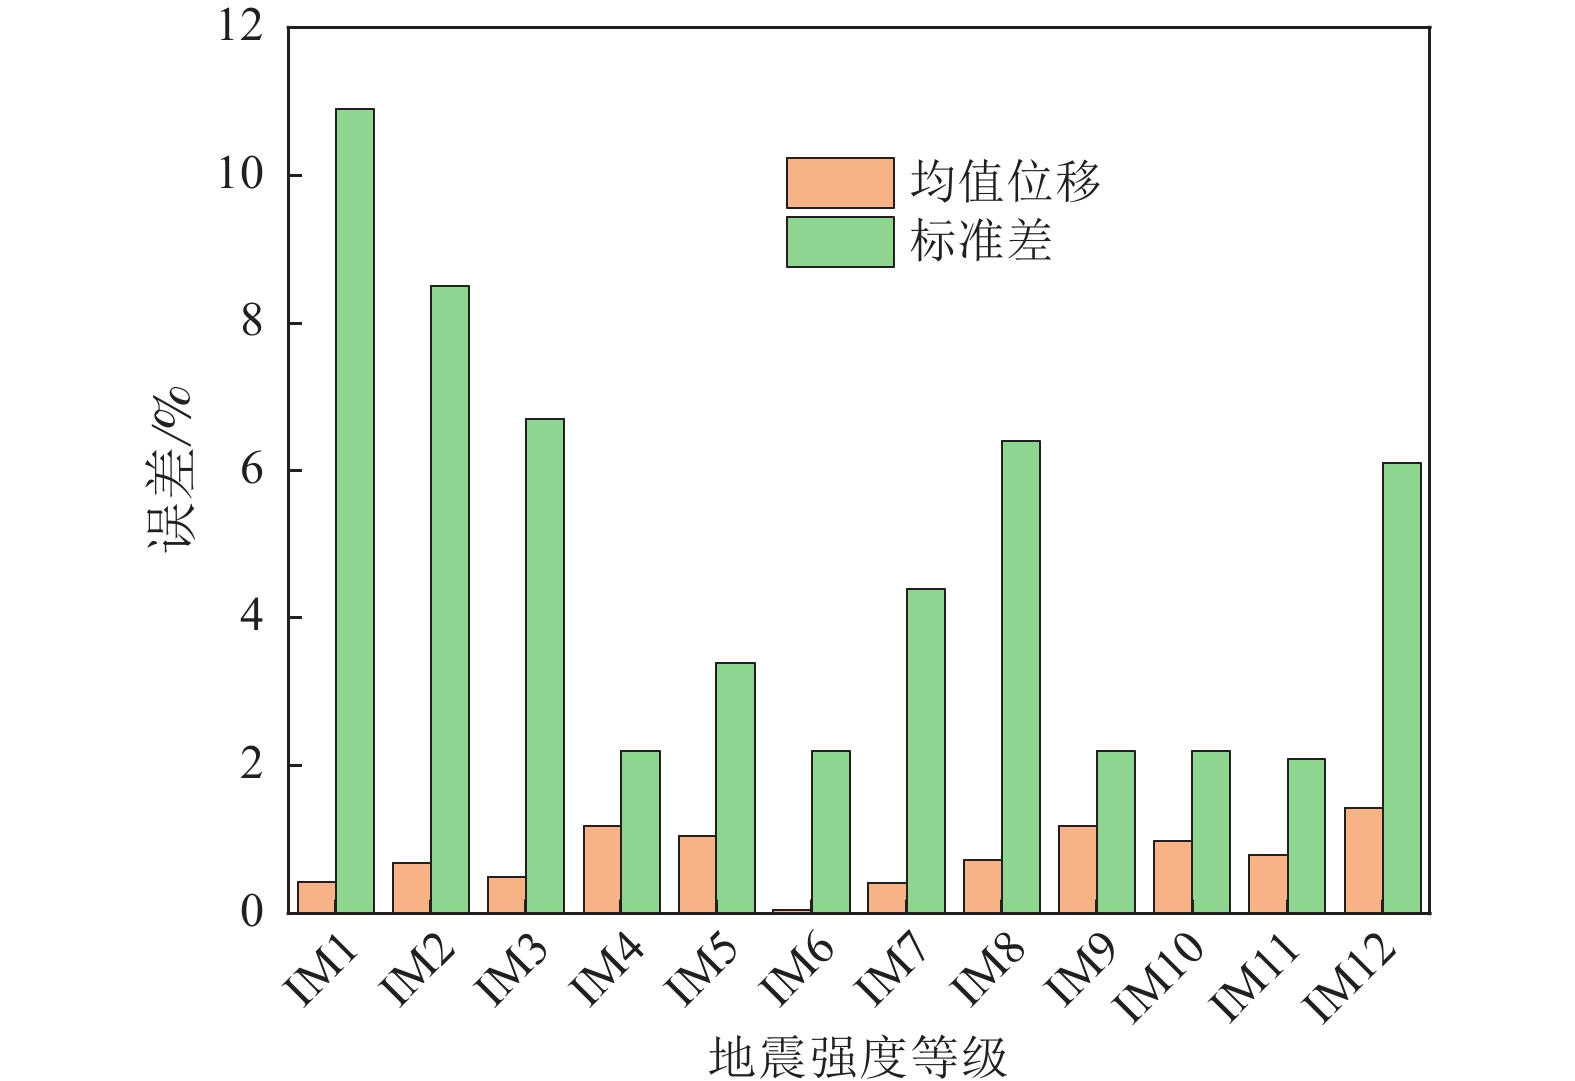
摘要: 求解多地震动作用下结构响应均值与标准差是地震易损性分析的基础工作。在地下结构Pushover分析法的基础上,提出间接计算结构在多地震动作用下均值响应的求解方法,即间接求解法(Indirectly Solution Average,ISA )。该方法以多地震动作用下自由场响应均值为目标位移,采用倒三角荷载分布模式,经1次Pushover分析得到结构响应均值。采用ISA计算得到不同地震动强度(调幅12个强度等级)下地铁车站结构层间位移响应均值与标准差。将ISA计算结果与先进行地下结构Pushover分析,然后求取响应均值与标准差的直接求解法计算结果进行比较,可知2种方法得到的结构层间位移响应均值误差<2%,标准差误差基本<10%,验证了ISA计算精度,可为地下结构基于性能的抗震设计概率地震需求模型计算提供快速分析方法。
-
关键词:
- 地下结构 /
- Pushover分析 /
- 地震动 /
- 地震易损性 /
- 层间位移
Abstract: The computed average and standard deviation of the structural seismic response subjected multiple ground motion records is significant for the seismic vulnerability analysis. Based on the Pushover method of underground structures, this paper proposes a solution method (ISA) to indirectly calculate the average response of structure as it is subjected to multiple ground motion. The ISA method takes the average value of the free field response as the target displacement under the excitation of multiple ground motion records, and uses the inverted triangular load distribution model to calculate the structural average response employing one time Pushover analysis. Based on the ABAQUS software platform, the ISA method is used to calculate the average and standard deviation of the inter-story displacement of the subway station structure under the excitation of 48 ground motion records with 12 levels intensity of ground motion. By comparing with the results obtained from the Pushover analysis conducting the ground motion records one by one, the maximum value of the average error of the inter-story displacement is only 2%, and the standard deviation error is basically less than 10%, which verifies the calculation accuracy of the proposed ISA method. The above conclusions can provide a fast numerical analysis method to establish the probabilistic seismic demand model for performance-based seismic design of underground structures. -
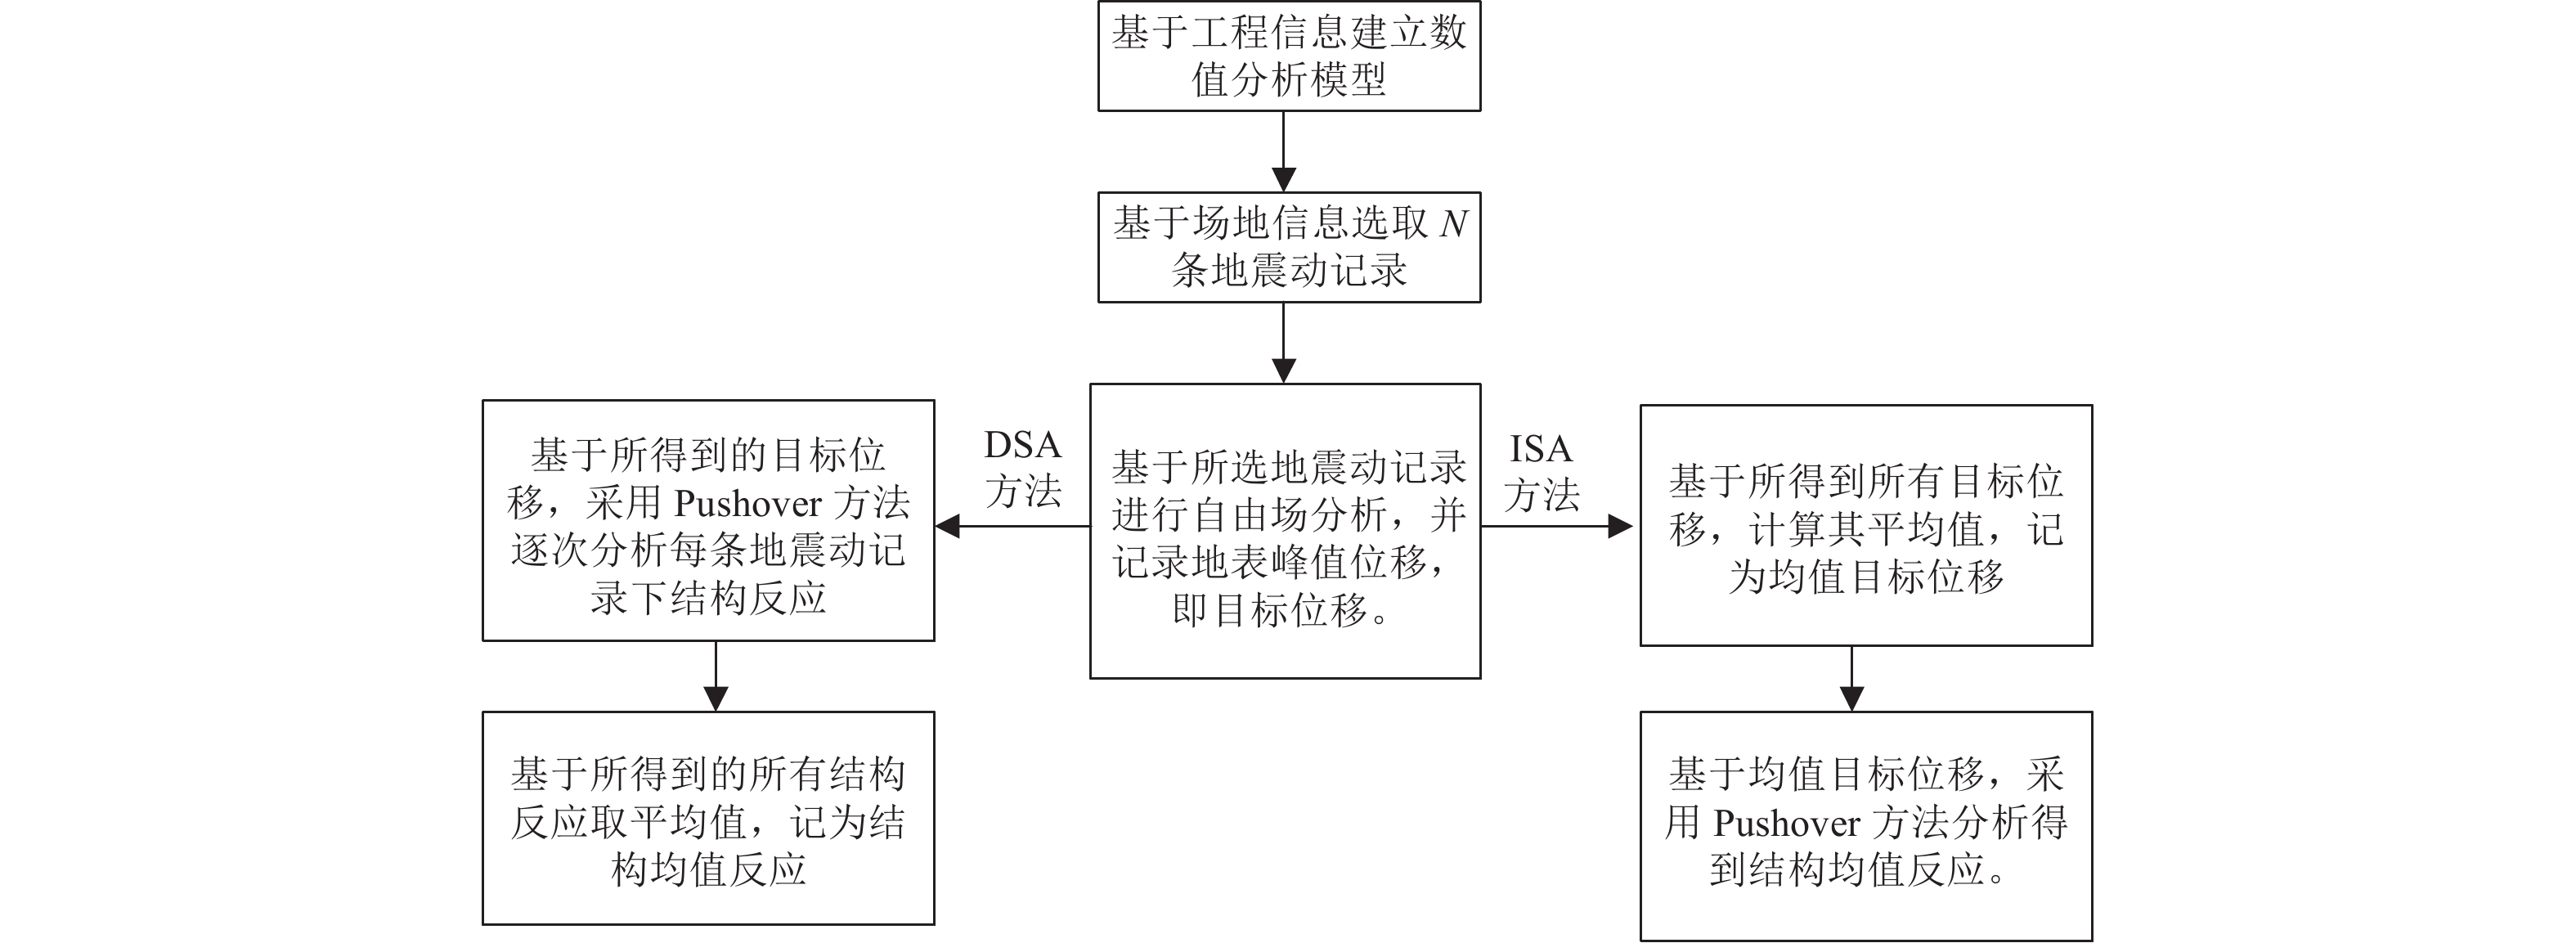
图 2 DSA与ISA计算多地震动作用下结构均值基本流程
Figure 2. The basic process of calculating the average value of structure subjected to multiple ground motions by DSA and ISA methods
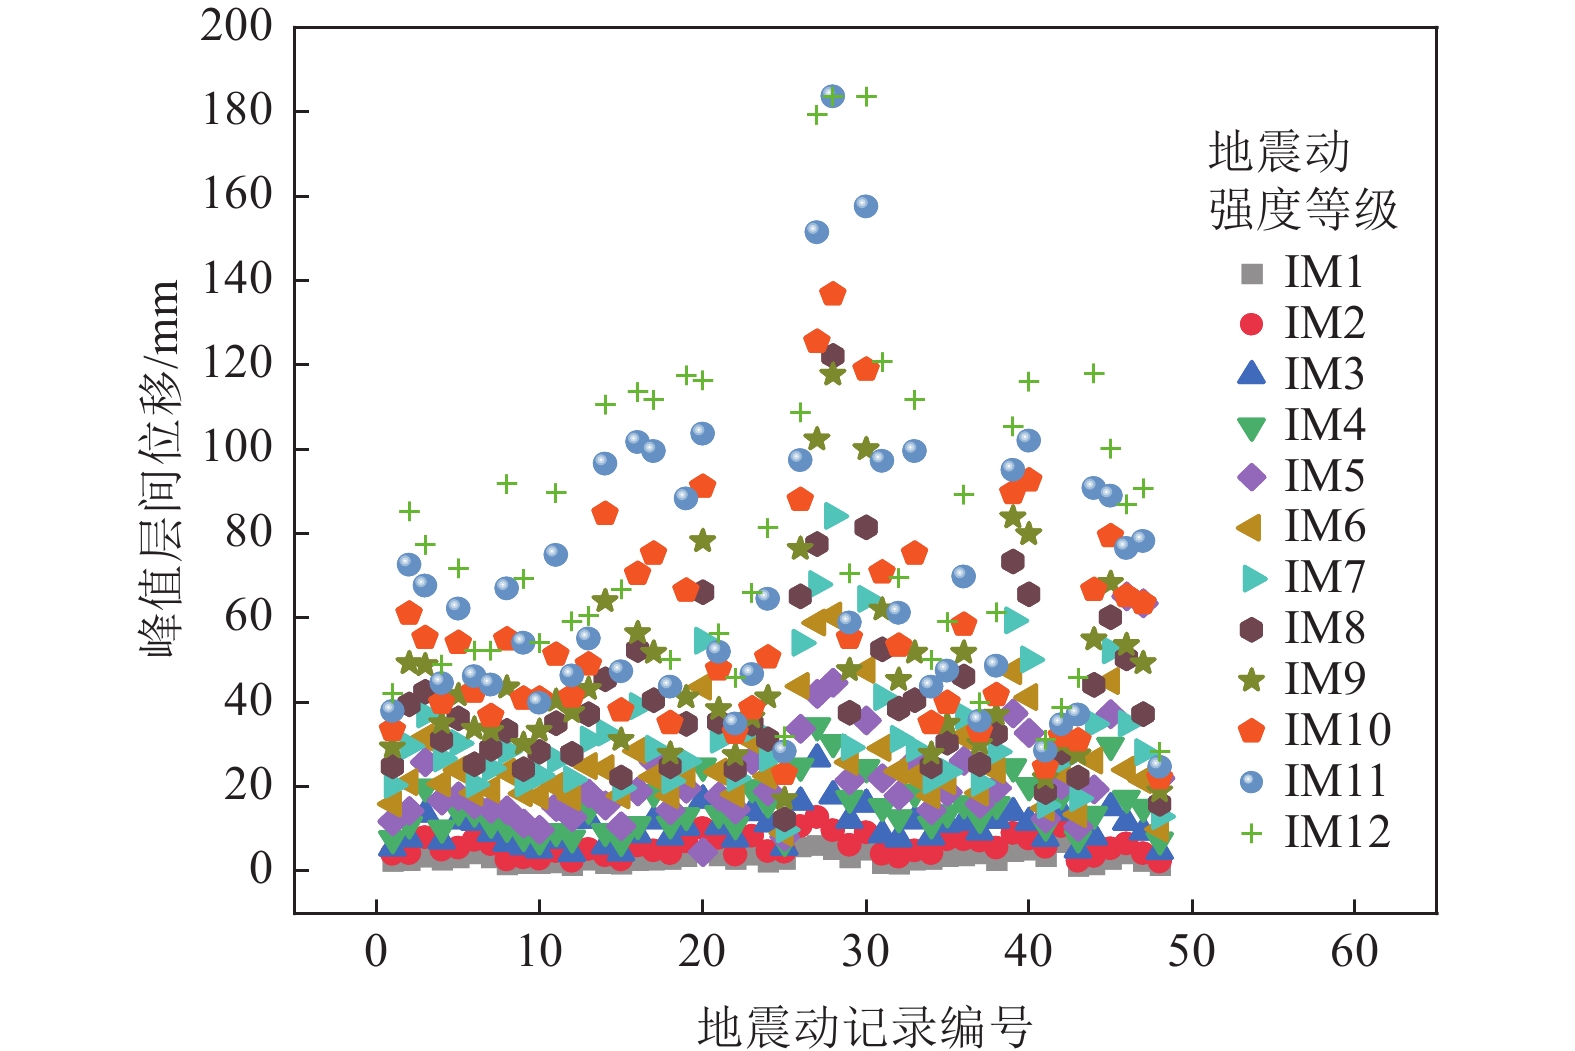
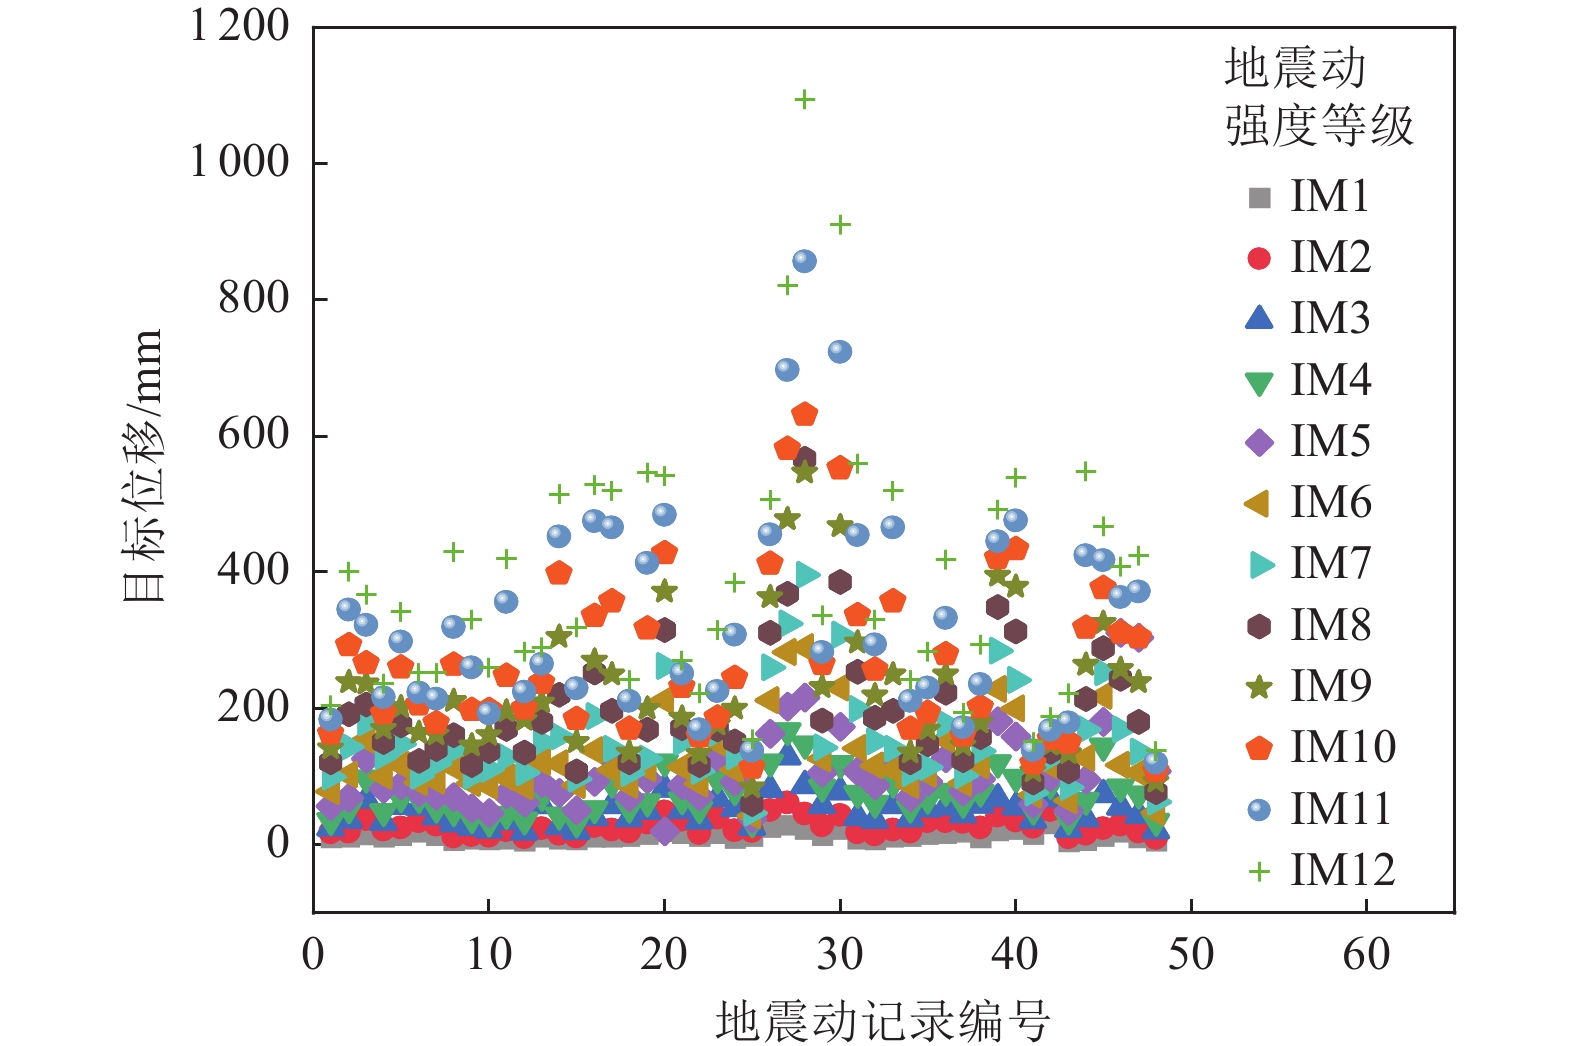
图 6 基于DSA计算的结构层间位移
Figure 6. Structural Inter-story displacement calculated by DSA method
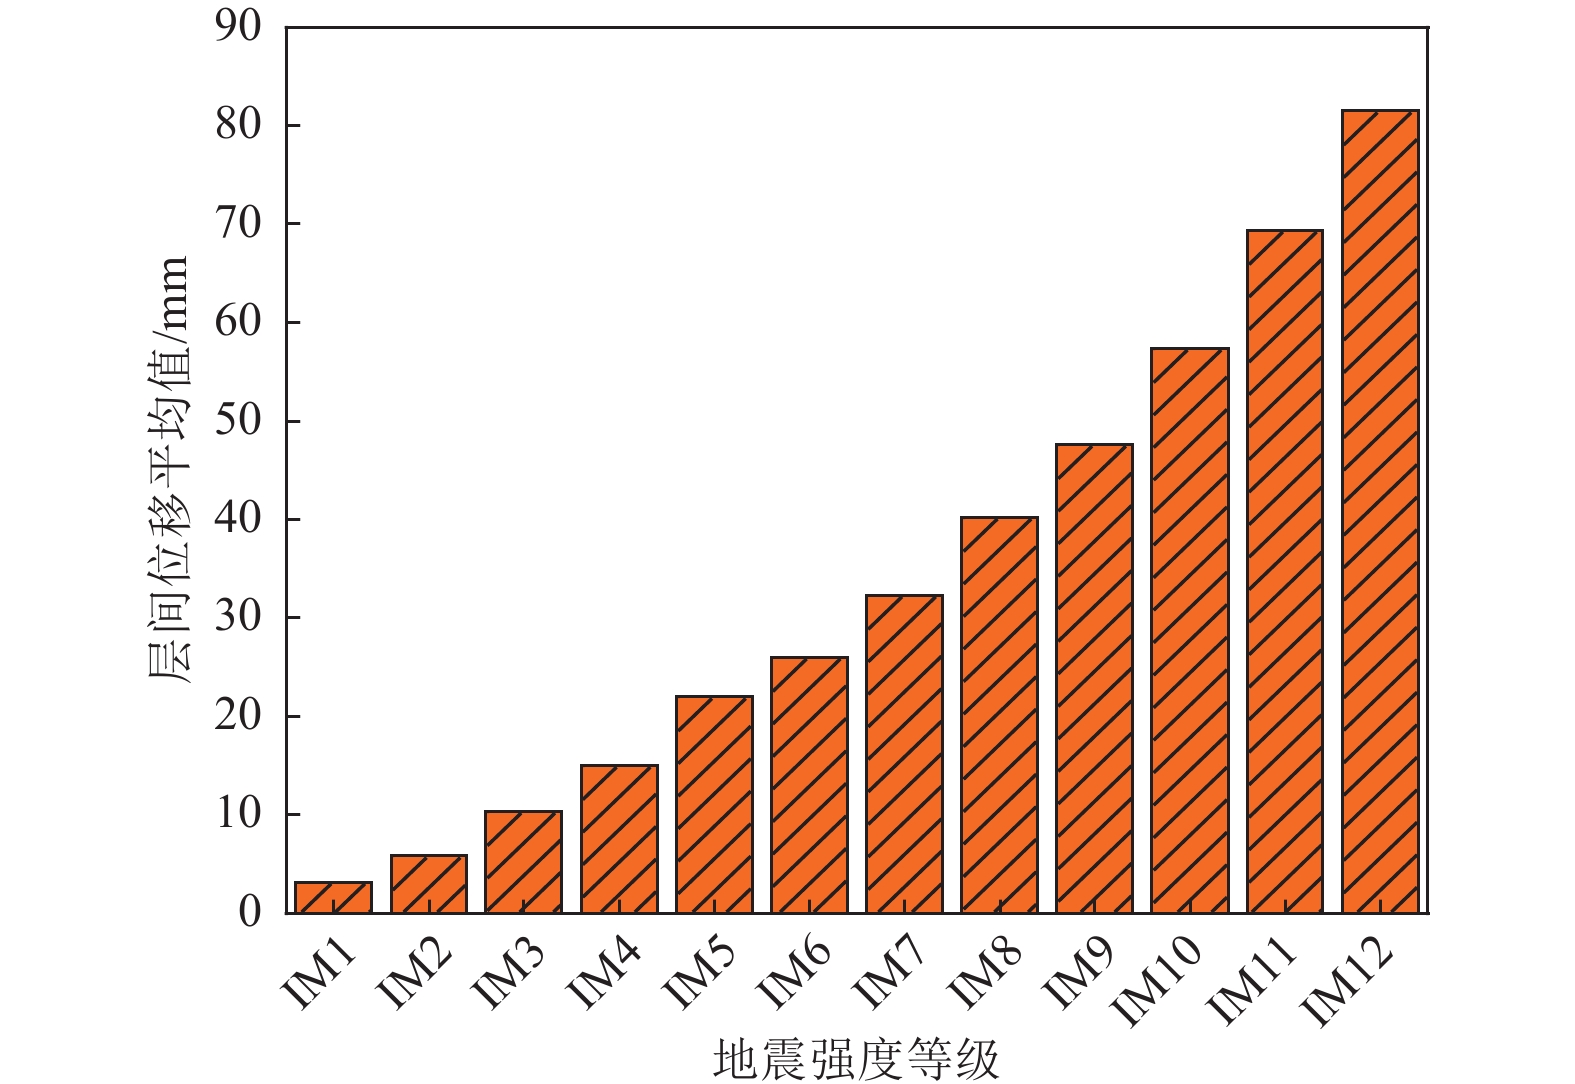
图 7 基于DSA得到的结构层间位移均值
Figure 7. The average inter-story displacement of the structure based on the DSA method
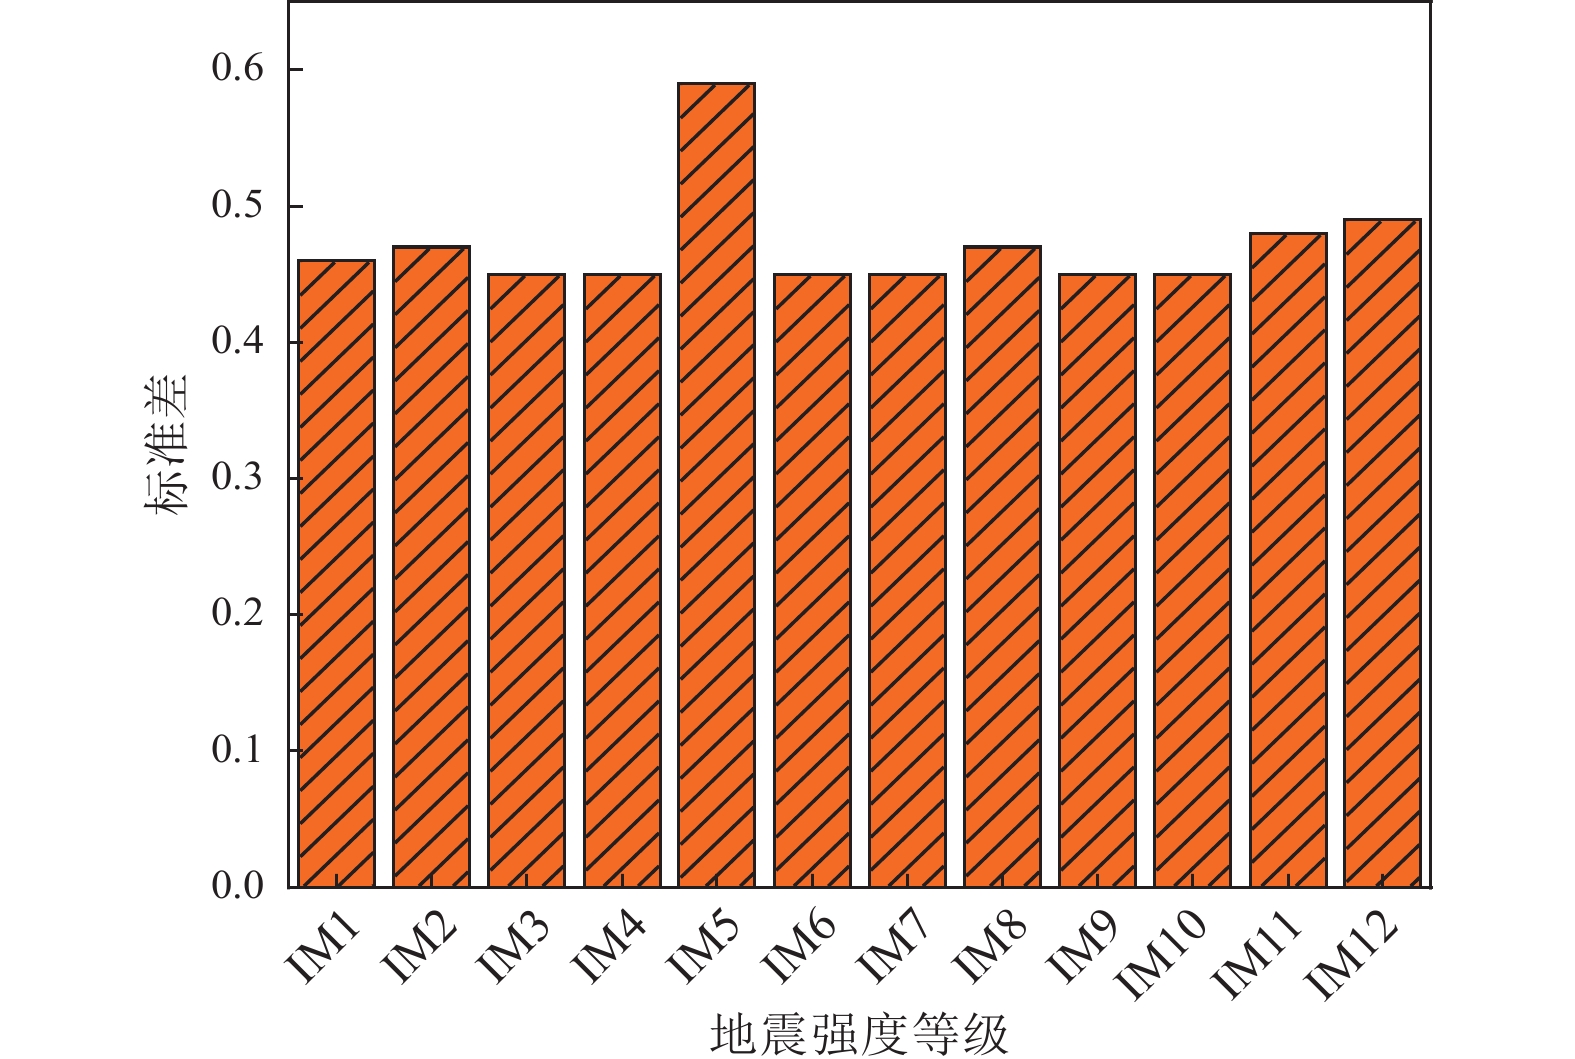
图 8 基于DSA得到的层间位移标准差
Figure 8. The standard deviation of inter-story displacement of the structure based on the DSA method
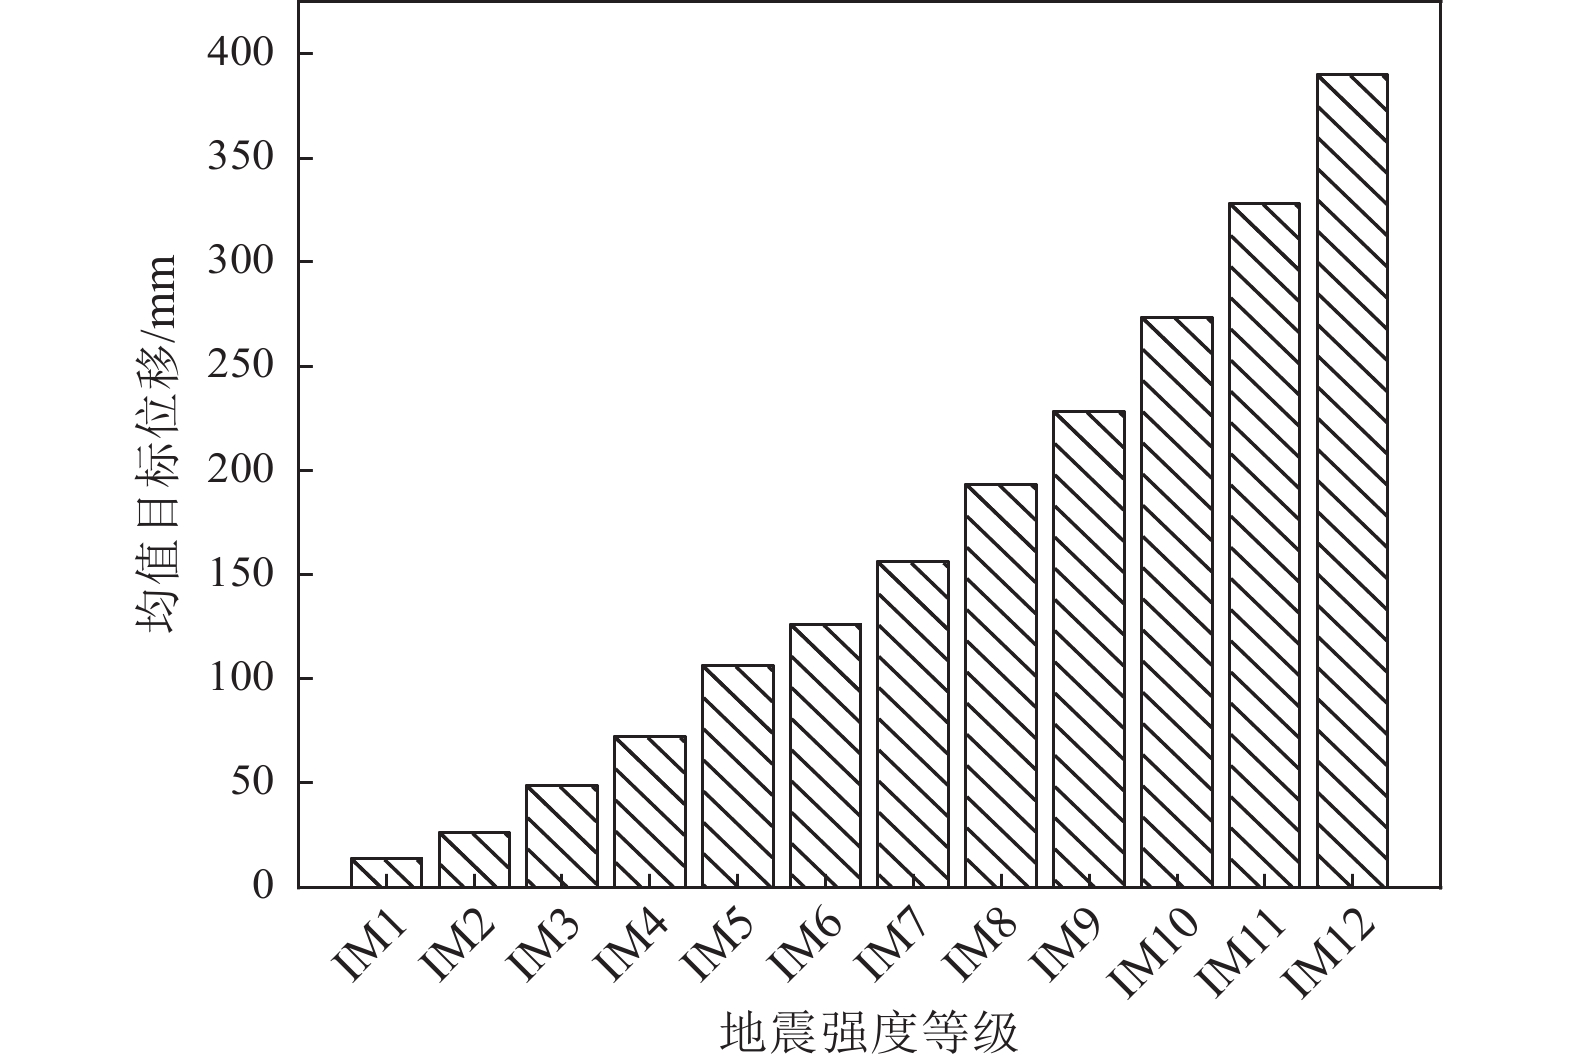
图 9 不同地震动强度下自由场反应均值
Figure 9. Average value of free field response subjected to different level ground motion intensity
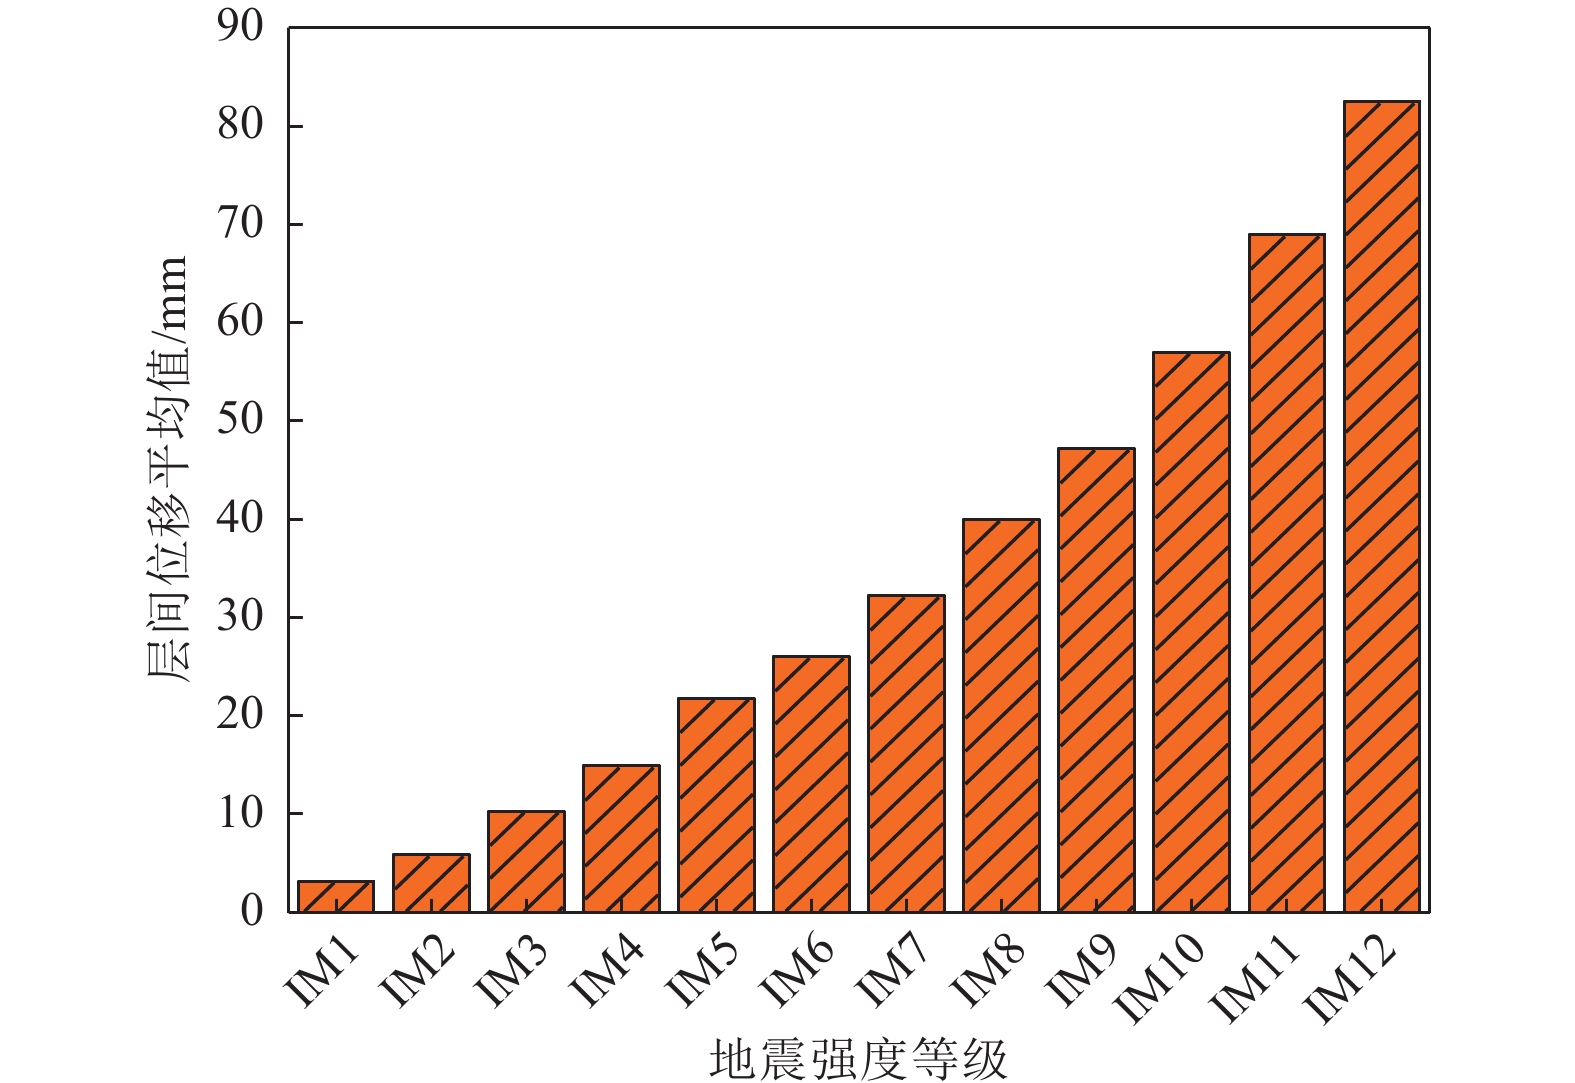
图 10 基于ISA得到的结构层间位移响应均值
Figure 10. The average inter-story displacement of the structure based on the ISA method
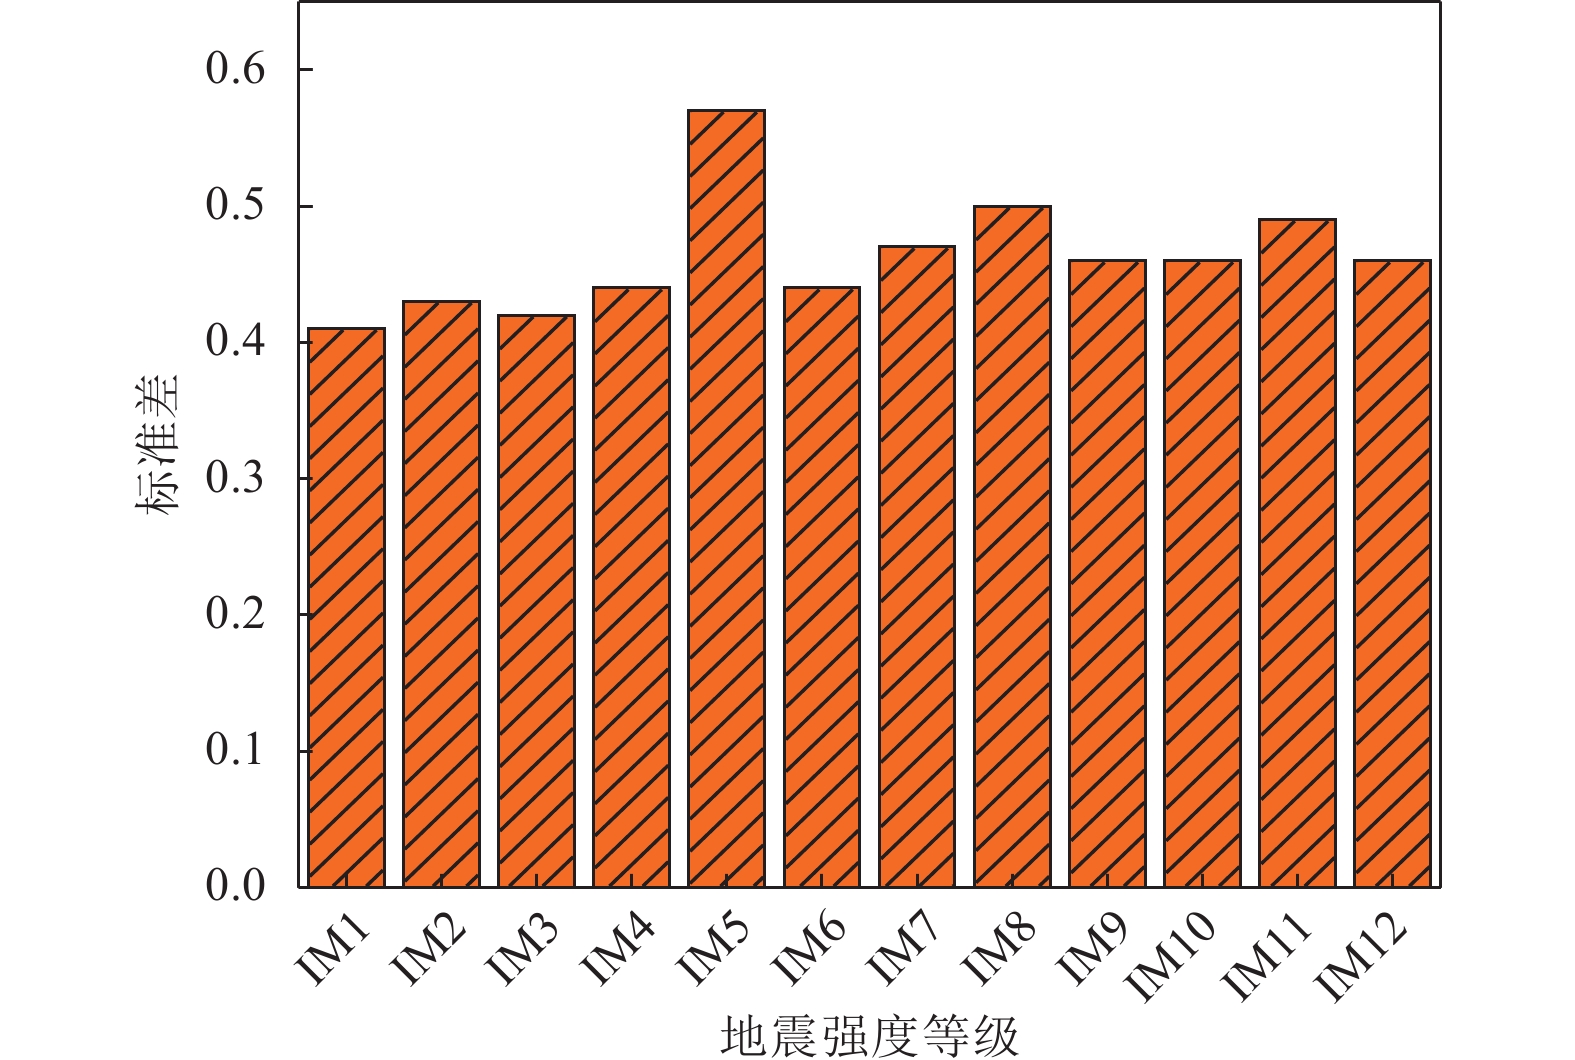
图 11 基于ISA得到的结构层间位移标准差
Figure 11. The standard deviation of inter-story displacement of the structure based on the ISA method
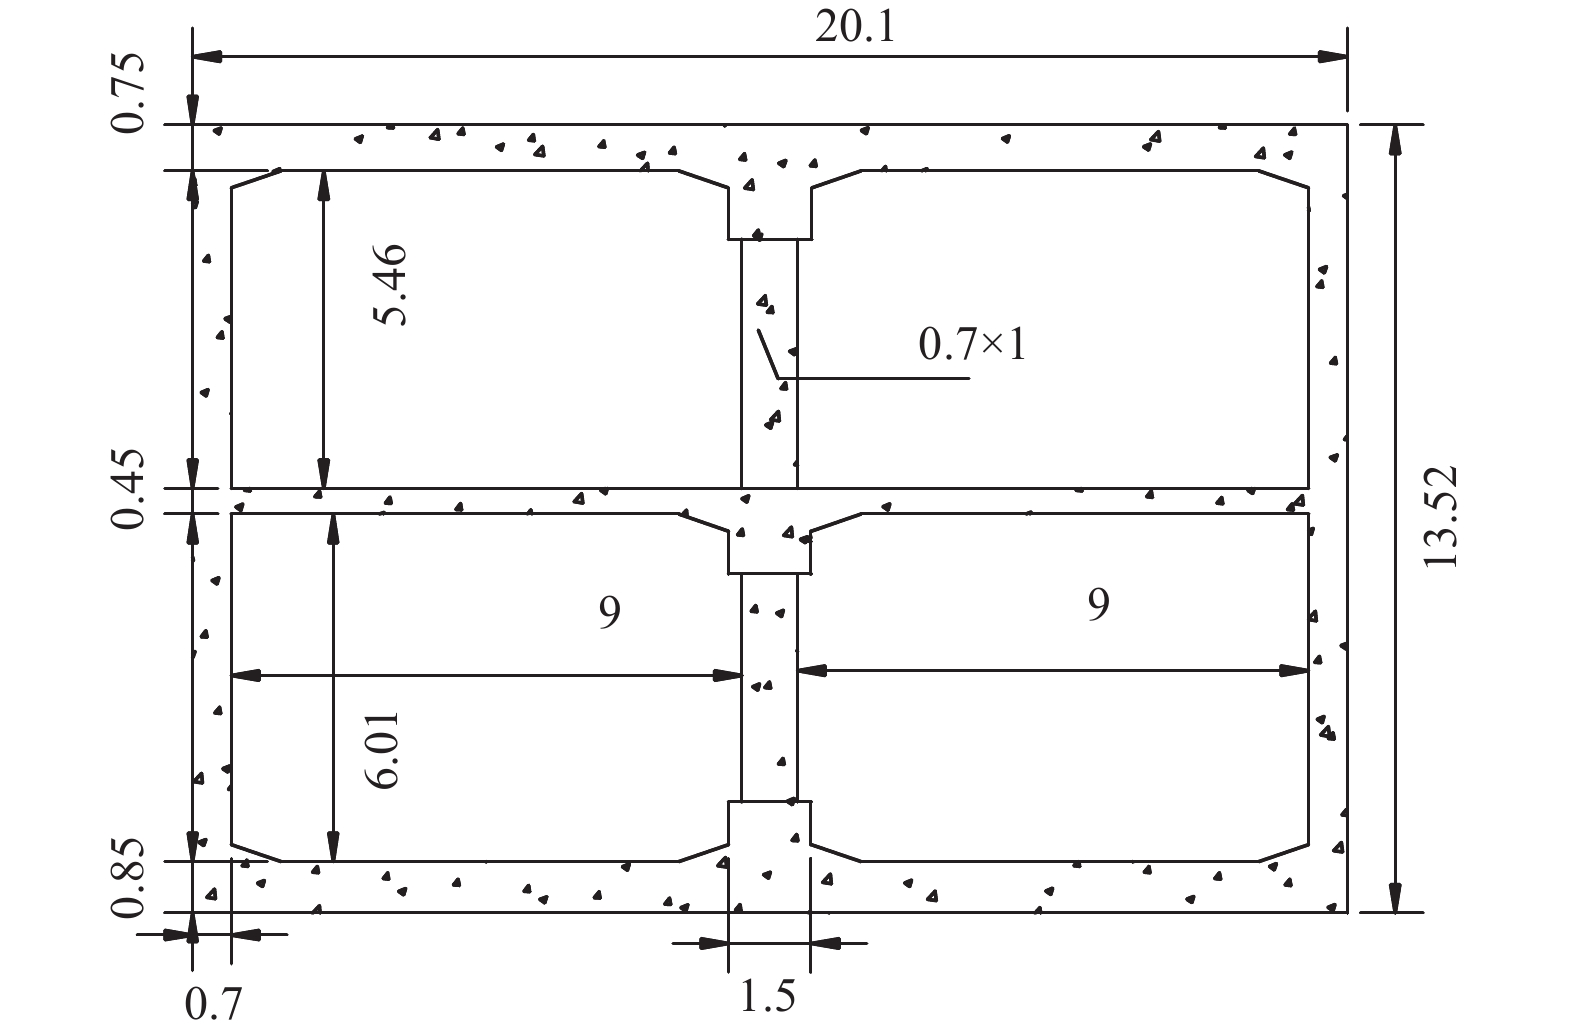
表 1 车站场地基本信息
Table 1. The basic site information of caofang subway station
编号 类型 厚度/m 密度/(kg·m−3) 剪切波速/(m·s−1) 泊松比 1 回填土 2 1 700 147 0.35 2 粉土 6 2 020 190 0.35 3 黏土 7 2 000 193 0.36 4 砂土 2 2 050 274 0.33 5 黏土 10 2 020 300 0.36 6 砂土 3 2 050 328 0.33 7 黏土 2 1 990 331 0.36 8 砂土 6 2 050 368 0.33 9 粉土 7 2 000 382 0.35 10 基岩 — 2 500 — —  下载: 导出CSV
-
陈国兴, 陈苏, 杜修力等, 2016. 城市地下结构抗震研究进展. 防灾减灾工程学报, 36(1): 1—23 doi: 10.13409/j.cnki.jdpme.2016.01.001Chen G. X. , Chen S. , Du X. L. , et al. , 2016. Review of seismic damage, model test, available design and analysis methods of urban underground structures: retrospect and prospect. Journal of Disaster Prevention and Mitigation Engineering, 36(1): 1—23. (in Chinese) doi: 10.13409/j.cnki.jdpme.2016.01.001 还毅, 方秦, 柳锦春等, 2011. 考虑时空耦联的等效惯性加速度加载的地下结构pushover分析. 地震工程与工程振动, 31(4): 64—70 doi: 10.13197/j.eeev.2011.04.015Huan Y. , Fang Q. , Liu J. C. , et al. , 2011. Pushover analysis of underground structures by the time-space coupled equivalent inertial acceleration. Journal of Earthquake Engineering and Engineering Vibration, 31(4): 64—70. (in Chinese) doi: 10.13197/j.eeev.2011.04.015 刘晶波, 李彬, 刘祥庆, 2007. 地下结构抗震设计中的静力弹塑性分析方法. 土木工程学报, 40(7): 68—76 doi: 10.3321/j.issn:1000-131x.2007.07.012Liu J. B. , Li B. , Liu X. Q. , 2007. A static elasto-plastic analysis method in seismic design of underground structures. China Civil Engineering Journal, 40(7): 68—76. (in Chinese) doi: 10.3321/j.issn:1000-131x.2007.07.012 刘晶波, 刘祥庆, 李彬, 2008. 地下结构抗震分析与设计的Pushover分析方法. 土木工程学报, 41(4): 73—80 doi: 10.3321/j.issn:1000-131X.2008.04.011Liu J. B. , Liu X. Q. , Li B. , 2008. A pushover analysis method for seismic analysis and design of underground structures. China Civil Engineering Journal, 41(4): 73—80. (in Chinese) doi: 10.3321/j.issn:1000-131X.2008.04.011 刘晶波, 王文晖, 赵冬冬等, 2013. 循环往复加载的地下结构Pushover分析方法及其在地震损伤分析中的应用. 地震工程学报, 35(1): 21—28 doi: 10.3969/j.issn.1000-0844.2013.01.0021Liu J. B. , Wang W. H. , Zhao D. D. , et al. , 2013. Pushover analysis method of underground structures under reversal load and its application in seismic damage analysis. China Earthquake Engineering Journal, 35(1): 21—28. (in Chinese) doi: 10.3969/j.issn.1000-0844.2013.01.0021 许成顺, 许紫刚, 杜修力等, 2017. 地下结构抗震简化分析方法比较研究. 地震工程与工程振动, 37(2): 65—80 doi: 10.13197/j.eeev.2017.02.65.xucs.008Xu C. S. , Xu Z. G. , Du X. L. , et al. , 2017. Comparative study of simplified methods for seismic analysis of underground structure. Earthquake Engineering and Engineering Dynamics, 37(2): 65—80. (in Chinese) doi: 10.13197/j.eeev.2017.02.65.xucs.008 Chen G. X. , Wang Y. Z. , Zhao D. F. , et al. , 2021. A new effective stress method for nonlinear site response analyses. Earthquake Engineering & Structural Dynamics, 50(6): 1595—1611. Chen Z. Y., Chen W., Zhang W., 2014. Seismic performance evaluation of multi-story subway structure based on pushover analysis. In: Linag R. Y., Qian J. G., Tao J. L., eds., Advances in Soil Dynamics and Foundation Engineering. Shanghai, China: ASCE, 444—454. FEMA, 2009. Quantification of building seismic performance factors. Washington: Federal Emergency Management Agency. FEMA, 2018. Seismic performance assessment of buildings (volume 1-Methodology). 2 nd ed. Washington: Federal Emergency Management Agency. Gao Z. D. , Zhao M. , Du X. L. , 2022. Modal pushover analysis for seismic performance assessment of underground structures. Journal of Earthquake Engineering, 1—19. Hashash Y. M. A. , Hook J. J. , Schmidt B. , et al. , 2001. Seismic design and analysis of underground structures. Tunnelling and Underground Space Technology, 16(4): 247—293. doi: 10.1016/S0886-7798(01)00051-7 Hillerborg A. , Modéer M. , Petersson P. E. , 1976. Analysis of crack formation and crack growth in concrete by means of fracture mechanics and finite elements. Cement and Concrete Research, 6(6): 773—781. doi: 10.1016/0008-8846(76)90007-7 Jiang J. W. , Xu C. S. , El Naggar H. M. , et al. , 2021. Improved pushover method for seismic analysis of shallow buried underground rectangular frame structure. Soil Dynamics and Earthquake Engineering, 140: 106363. doi: 10.1016/j.soildyn.2020.106363 Qiu D. P. , Chen J. Y. , Xu Q. , 2020. Improved pushover analysis for underground large-scale frame structures based on structural dynamic responses. Tunnelling and Underground Space Technology, 103: 103405. doi: 10.1016/j.tust.2020.103405 Vamvatsikos D. , Cornell C. A. , 2002. Incremental dynamic analysis. Earthquake Engineering & Structural Dynamics, 31(3): 491—514. Xu Z. G. , Du X. L. , Xu C. S. , et al. , 2019. Numerical research on seismic response characteristics of shallow buried rectangular underground structure. Soil Dynamics and Earthquake Engineering, 116: 242—252. doi: 10.1016/j.soildyn.2018.10.030 Zhuang H. Y. , Yang J. , Chen S. , et al. , 2021. Statistical numerical method for determining seismic performance and fragility of shallow-buried underground structure. Tunnelling and Underground Space Technology, 116: 104090. doi: 10.1016/j.tust.2021.104090 Zou Y. , Liu H. B. , Jing L. P. , et al. , 2017. A pseudo-static method for seismic responses of underground frame structures subjected to increasing excitations. Tunnelling and Underground Space Technology, 65: 106—120. doi: 10.1016/j.tust.2017.02.006 -


 点击查看大图
计量
- 文章访问数: 276
- HTML全文浏览量: 62
- PDF下载量: 95
- 被引次数: 0
