Earthquake Response Analysis of Soil-reactor Plant-nuclear power Auxiliary Plant Interaction System
-
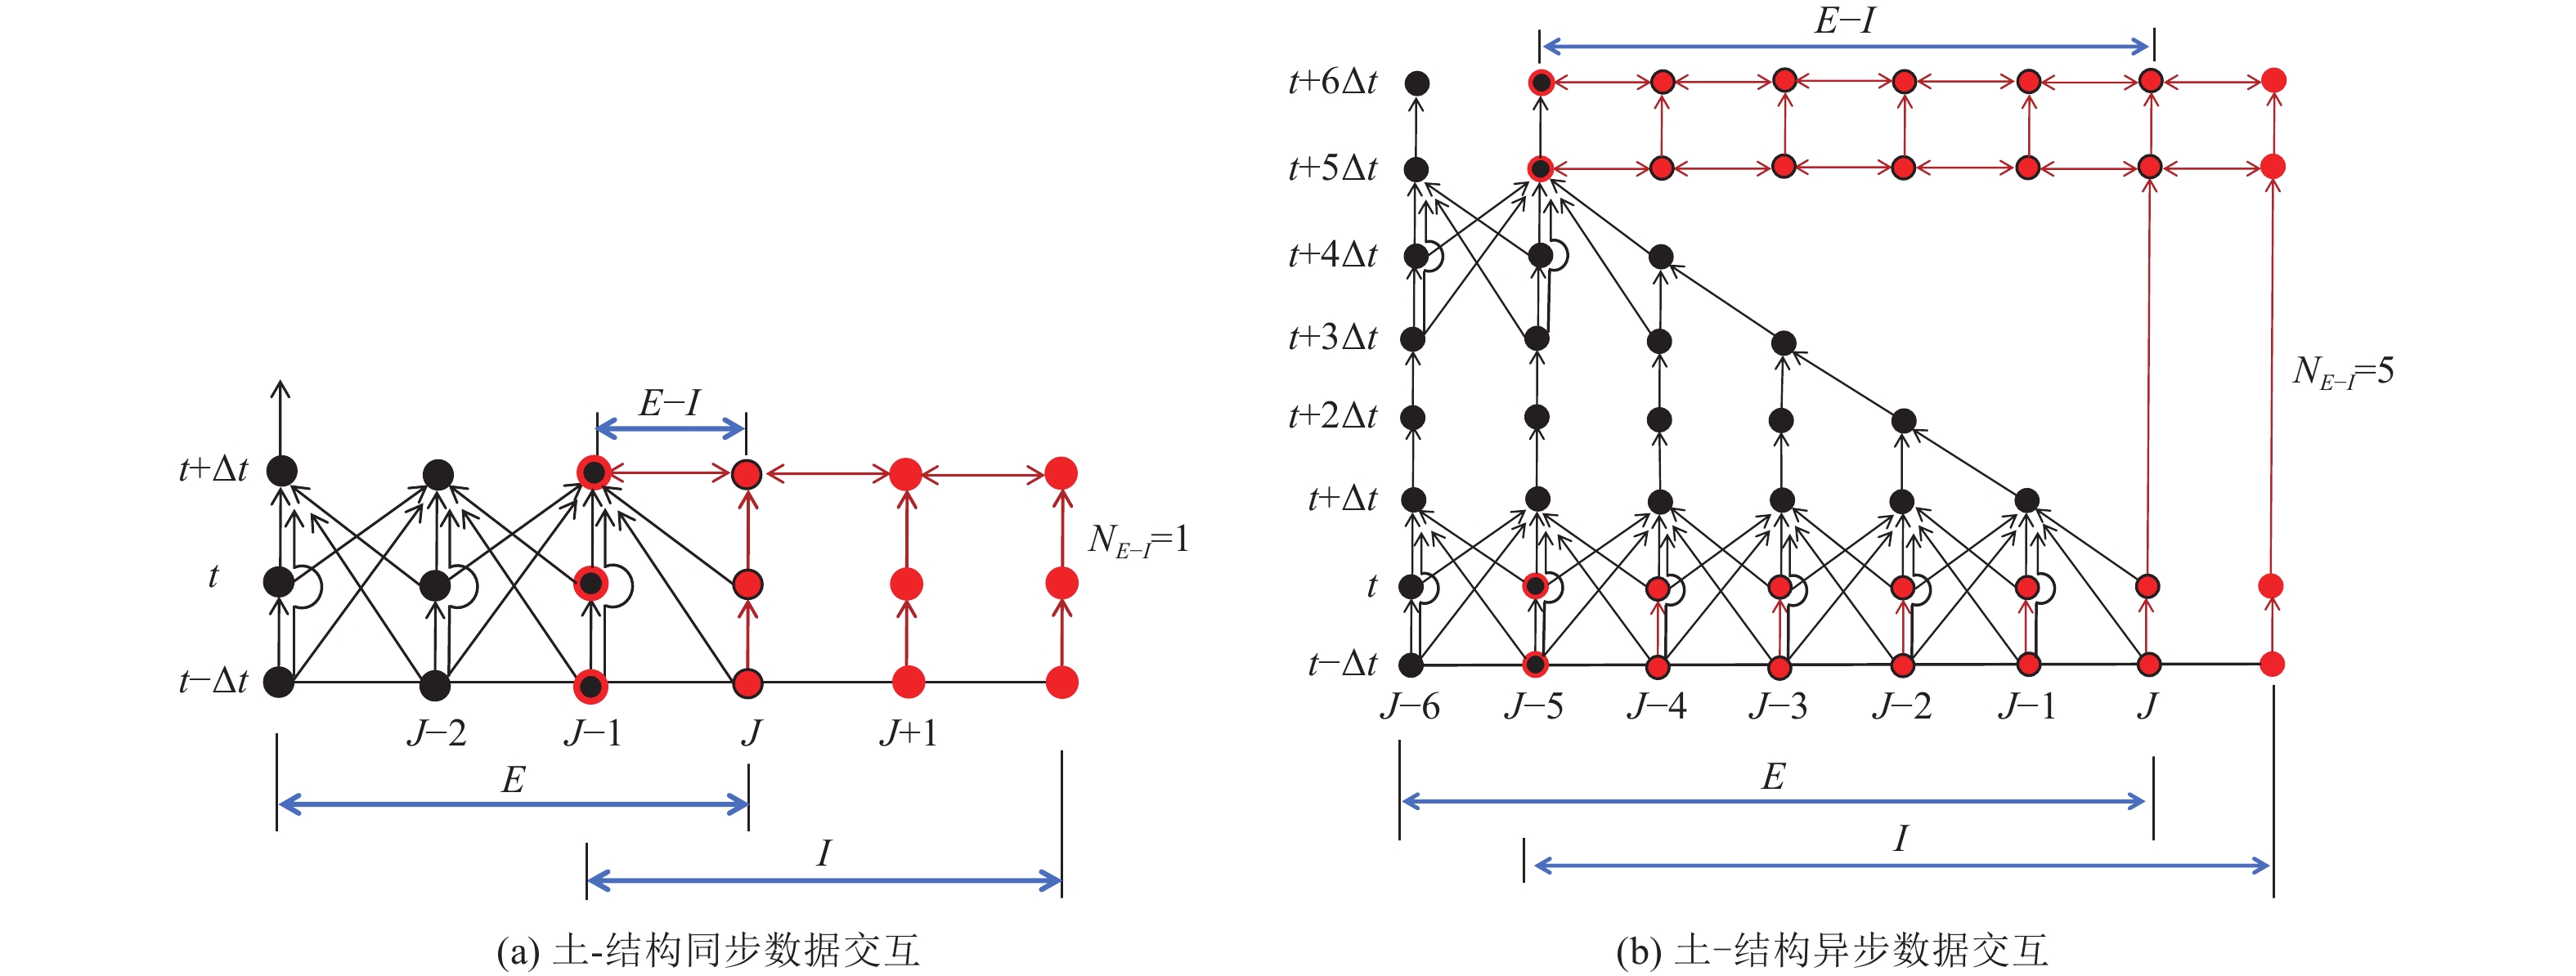
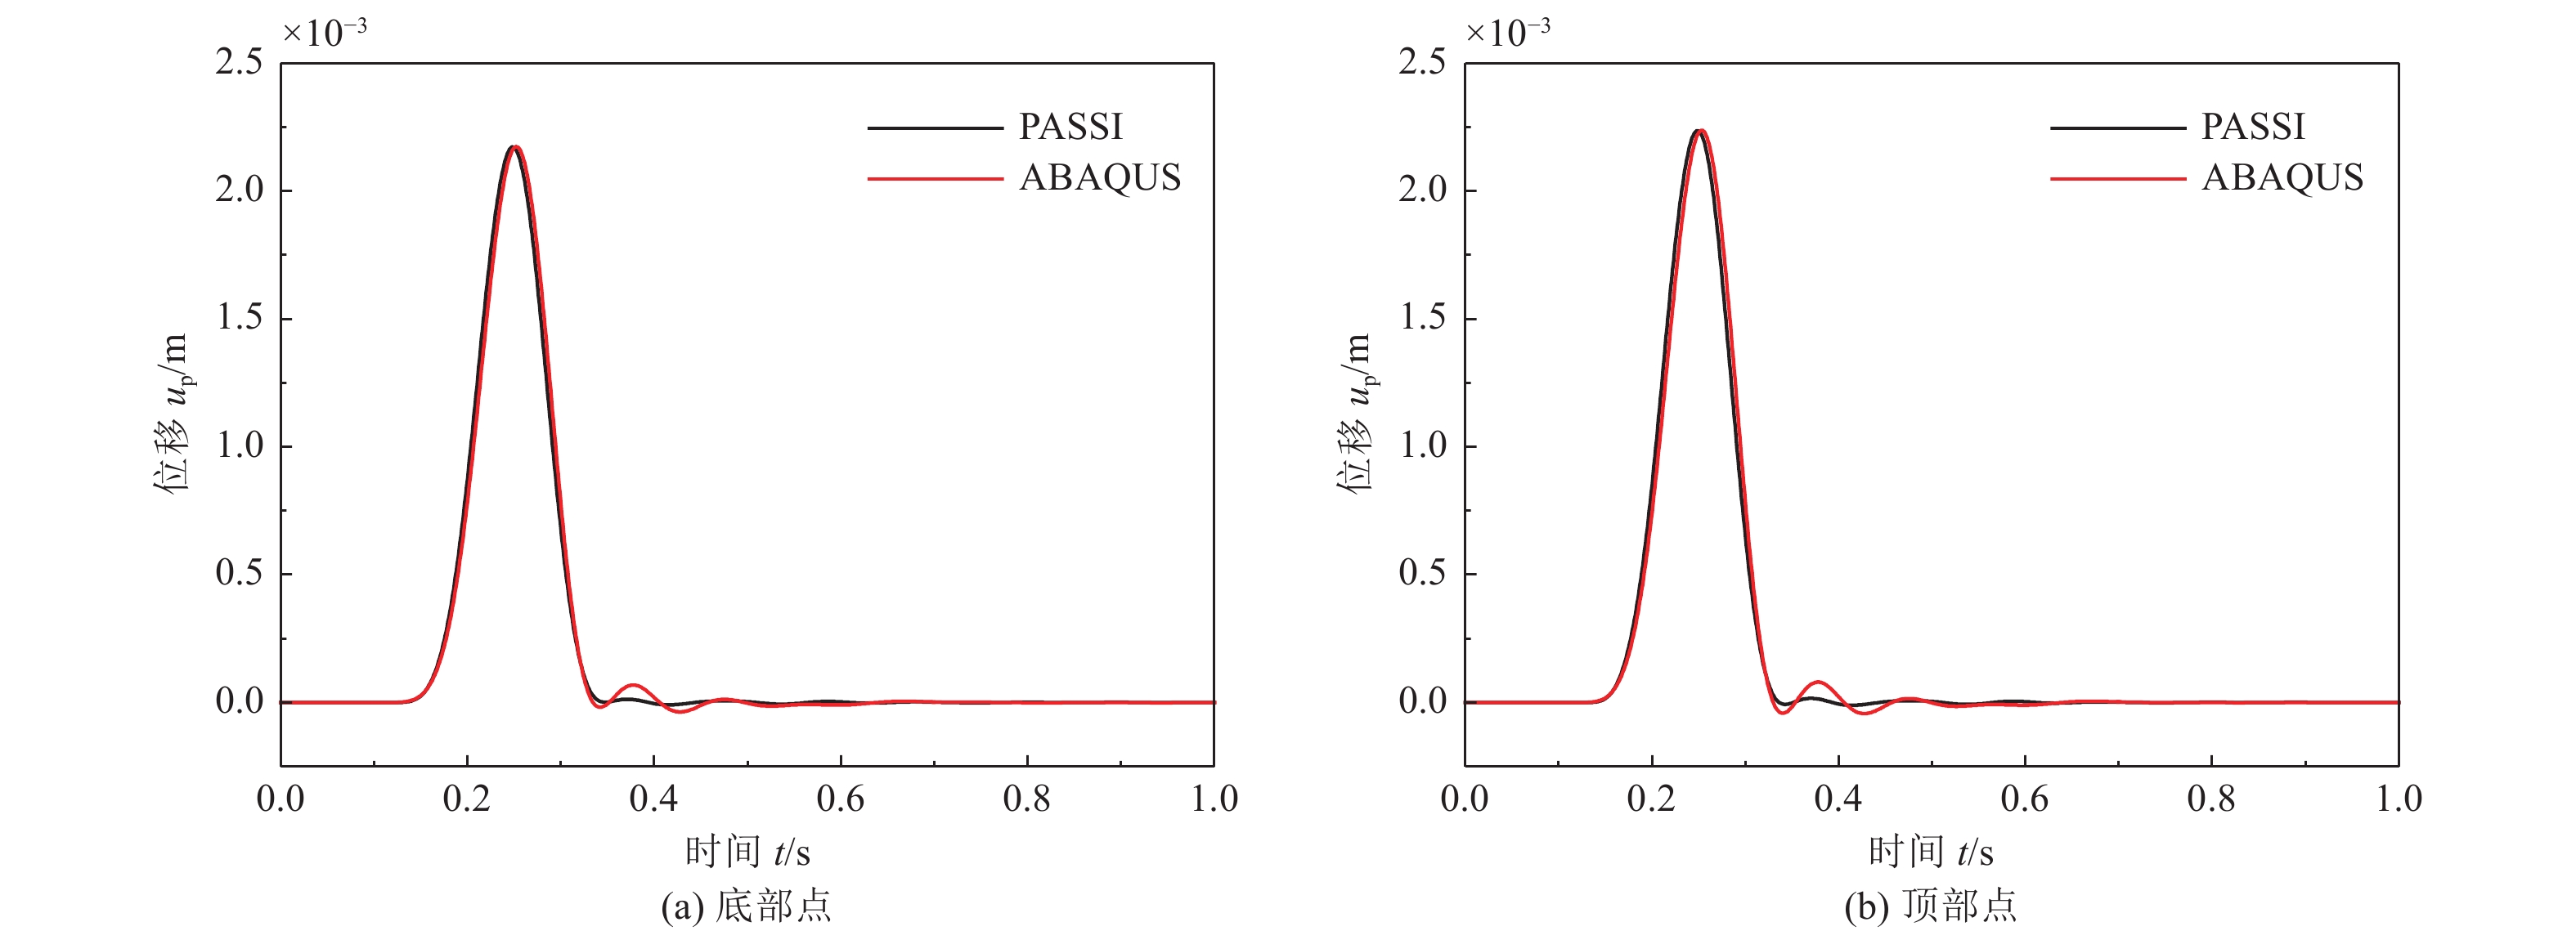
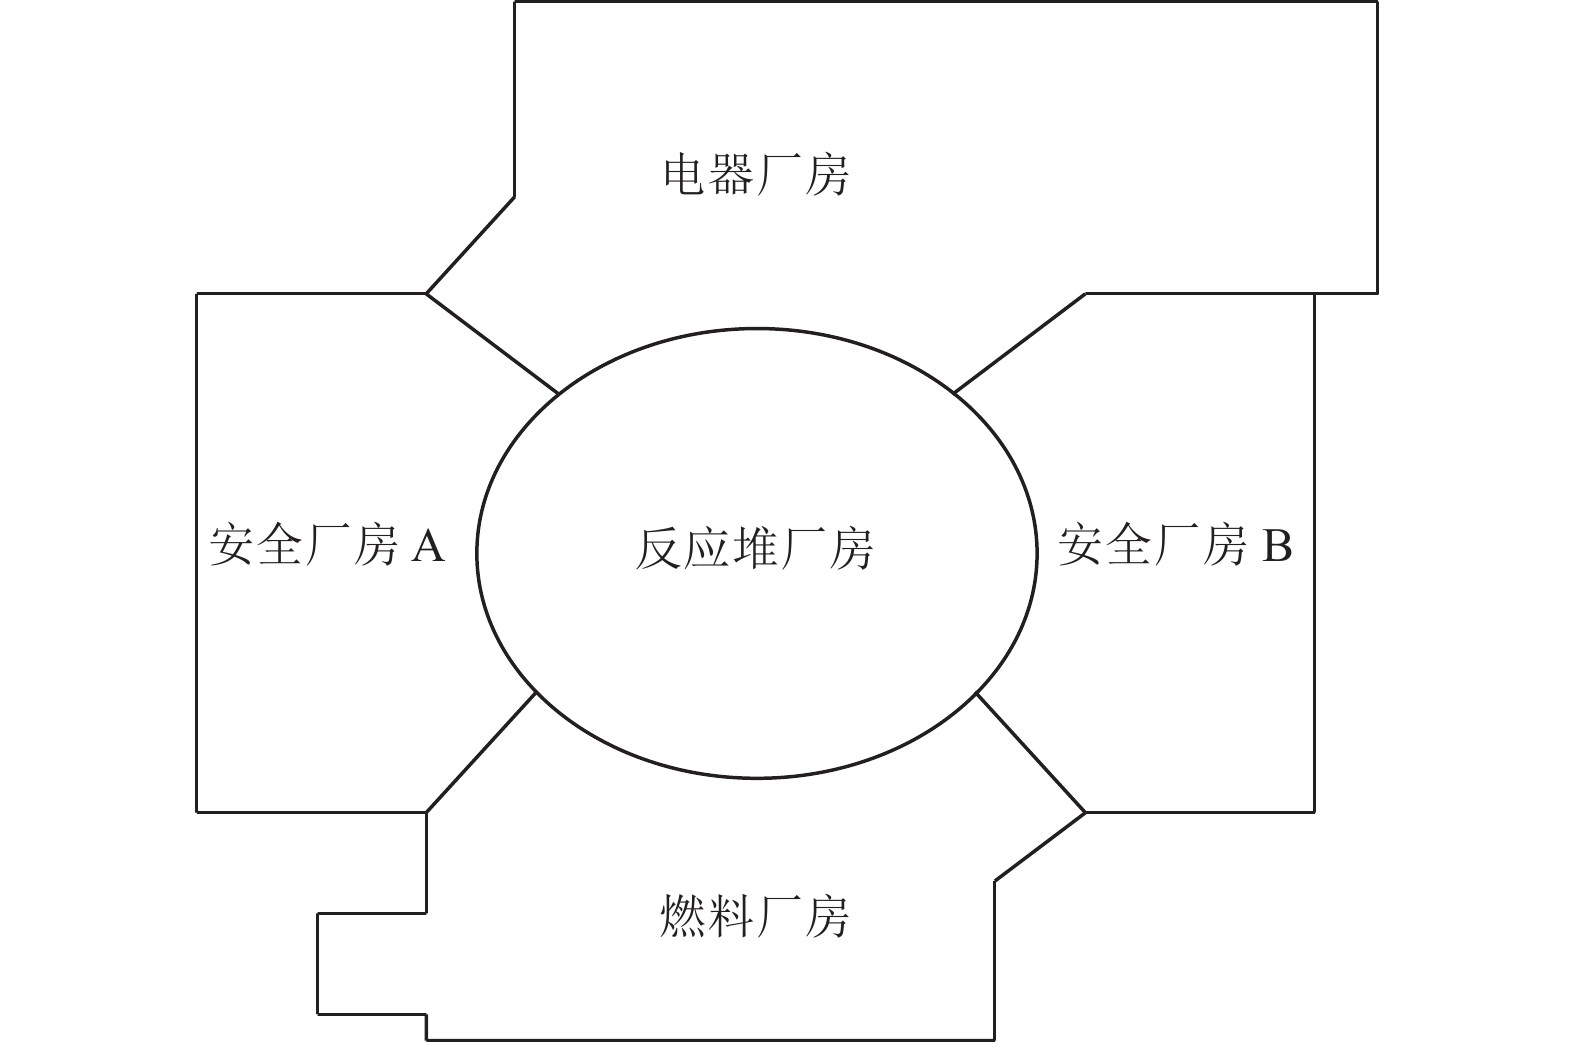
摘要: 土-结构相互作用分析是核电结构抗震设计的重要环节,考虑到附属厂房可能导致反应堆厂房处于最不利工况状态,对地基土-反应堆厂房-核电辅助厂房结构相互作用体系地震响应进行研究。基于PASSI算法,提出显-隐式单元层计算方法,实现显、隐式交替计算,保持高效性的同时,提高计算稳定性。通过场地分析算例和土-结构相互作用分析算例,与ABAQUS软件计算结果进行对比,验证计算方法的可行性。以某核电站为对象,分析同一基础上相邻厂房对反应堆厂房地震响应的影响。研究结果表明,在基岩场地上,安全厂房通过基础和场地对反应堆厂房的作用较小,对反应堆厂房地震响应的影响较小;地震动输入下,燃料厂房和电器厂房加大了反应堆厂房位移峰值,减小了反应堆厂房加速度反应谱峰值,并使反应堆厂房顶部点加速度反应谱峰值向高频移动;与反应堆厂房共用同一基础的辅助厂房,应与反应堆厂房作为整体进行地震响应分析,至少应将与反应堆厂房相连的辅助厂房作为整体进行分析。Abstract: Soil-structure interaction analysis is an important step in seismic design, Considering that the existence of the auxiliary plant may cause the reactor plant in the most unfavorable condition, In the paper the coupled dynamic response of soil- reactor plant-auxiliary plant structure system to earthquake excitation is studied. Based on PASSI, a computation scheme of explicit and implicit element layer is proposed, which can realize explicit and implicit computation alternately, and improve the computation stability with high efficiency. The site analysis and soil-structure interaction analysis examples were compared with the results of ABAQUS commercial software, and the feasibility of the calculation scheme was verified. On this basis, the influence of adjacent plants on the seismic response of a nuclear power plant on the same basis was analyzed. The results show that on the bedrock site, the safety plant has little effect on the reactor plant through the foundation and site, It also has little effect on the seismic response of the reactor plant. Under the seismic wave input, the fuel and electrical plant increased the displacement peak of the reactor plant, reduced the peak of the acceleration response spectrum, and made the peak of the acceleration response spectrum of the top point of the reactor plant move to high frequency. The auxiliary plant sharing the same foundation with the reactor plant should be analyzed holistically, and at least the auxiliary plant connected with the reactor plant should be analyzed holistically.
-
Key words:
- Nuclear power plant /
- SSI /
- Explicit-implicit element method /
- PASSI /
- Adjacent structure
-
表 1 土体参数
Table 1. Soil parameters
材料 厚度/m 弹性模量/GPa 泊松比 密度/kg·m−3 剪切波速/m·s−1 压缩波速/m·s−1 软土 50 0.108 0.35 1 000 200 416 表 2 显-隐式单元层计算方法和ABAQUS软件计算效率
Table 2. PASSI and ABAQUS calculation efficiency
算例 单元数/个 节点数/个 自由度数/个 显-隐式单元层计算方法
计算时间/minABAQUS软件
计算时间/min场地 80 000 85 731 257 193 4 106 土-结构相互作用 80 010 85 771 257 313 33 106 注:自由度数=节点数*3(每个节点自由度个数) 表 3 核电站结构材料参数
Table 3. Material parameters of nuclear power plant
编号 材料 结构 弹性模量/GPa 泊松比 密度/kg·m−3 1 C30 厂房/基础 32.5 0.2 2 400 2 C40 内/外壳 36.0 0.2 2 450 表 4 核电站厂址参数
Table 4. Soil parameters of nuclear power plant site
材料 厚度/m 弹性模量/GPa 泊松比 密度/kg·m−3 剪切波速/m·s−1 压缩波速/m·s−1 岩石 60 46.9 0.26 2 650 2 673 4 639 表 5 模态分析
Table 5. Modality analysis
振型 Case1 Case2 Case3 Case4 频率/Hz 振型参与系数 频率/Hz 振型参与系数 频率/Hz 振型参与系数 频率/Hz 振型参与系数 1 3.006 69 0.186 26 3.006 69 0.186 19 4.016 96 1.000 00 3.726 48 0.426 64 2 3.007 49 1.000 00 3.007 49 1.000 00 4.068 74 0.277 89 3.861 54 0.413 38 3 4.078 57 0.540 83 3.725 20 0.677 04 4.114 50 0.094 62 3.885 43 0.002 48 4 4.096 08 0.381 57 3.858 00 0.683 88 4.210 24 0.482 59 4.017 18 1.000 00 5 5.488 44 0.002 04 3.885 28 0.009 75 4.739 49 0.029 30 4.068 75 0.275 37 6 5.513 01 0.001 43 4.078 57 0.540 69 5.472 46 0.169 67 4.114 53 0.097 12 7 5.540 46 0.003 31 4.096 08 0.381 50 5.566 56 0.002 17 4.210 38 0.480 55 8 5.572 03 0.004 84 4.559 21 0.068 57 5.610 47 0.012 11 4.560 35 0.045 69 9 5.629 19 0.003 16 5.439 43 0.064 35 5.762 07 0.080 10 4.739 62 0.029 71 10 5.658 22 0.010 71 5.488 44 0.002 05 6.163 02 0.037 35 5.441 09 0.042 47 11 6.426 34 0.004 54 5.513 01 0.001 43 6.470 85 0.006 88 5.472 66 0.167 66 12 6.471 34 0.015 75 5.540 46 0.003 31 6.496 26 0.389 72 5.566 56 0.002 12 13 6.496 20 0.598 36 5.572 03 0.004 82 6.615 10 0.003 04 5.610 47 0.011 96 14 6.614 21 0.001 58 5.629 19 0.003 17 6.875 02 0.134 96 5.702 48 0.044 00 15 6.875 13 0.207 35 5.658 22 0.010 72 7.121 85 0.000 71 5.762 18 0.079 50 16 7.117 11 0.000 87 5.698 29 0.070 07 7.183 56 0.005 66 6.163 16 0.037 35 17 7.171 63 0.005 92 6.426 34 0.004 55 7.186 37 0.071 54 6.470 85 0.006 79 18 7.186 59 0.070 52 6.471 34 0.015 75 7.228 46 0.359 01 6.496 26 0.386 15 19 7.218 46 0.014 67 6.496 20 0.598 31 7.349 15 0.546 56 6.615 10 0.003 03 20 7.235 54 0.000 05 6.614 21 0.001 59 7.778 06 0.042 94 6.875 02 0.133 73 21 7.778 05 0.071 15 6.875 13 0.207 34 7.984 62 0.026 00 7.121 85 0.000 71 22 7.984 60 0.042 40 7.117 11 0.000 87 8.112 55 0.020 30 7.183 56 0.005 58 23 8.112 54 0.033 21 7.171 63 0.005 93 8.241 69 0.004 93 7.186 37 0.070 85 24 8.241 67 0.008 19 7.186 59 0.070 51 8.355 48 0.012 78 7.228 55 0.356 06 25 8.355 47 0.020 32 7.218 46 0.014 67 8.603 98 0.003 84 7.349 13 0.541 36 26 8.457 00 0.005 00 7.235 54 0.000 04 8.879 18 0.000 60 7.778 06 0.042 54 27 8.603 97 0.006 27 7.778 05 0.071 15 8.980 48 0.011 40 7.984 62 0.025 76 28 8.977 70 0.014 41 7.984 60 0.042 39 9.092 81 0.031 82 8.112 55 0.020 11 29 9.092 80 0.051 76 8.112 54 0.033 21 9.161 85 0.066 65 8.241 69 0.004 88 30 9.229 79 0.118 33 8.241 67 0.008 19 9.229 87 0.071 67 8.355 48 0.012 67 31 9.414 48 0.015 02 8.355 47 0.020 32 9.414 48 0.009 21 8.603 98 0.003 80 32 9.518 82 0.077 79 8.457 00 0.005 04 9.450 98 0.026 21 8.879 18 0.000 58 33 9.698 92 0.086 25 8.603 97 0.006 27 9.518 87 0.045 52 8.980 48 0.011 29 34 9.776 22 0.456 36 8.977 70 0.014 42 9.787 15 0.014 03 9.092 81 0.031 53 35 9.841 21 0.024 00 9.092 80 0.051 76 9.841 17 0.020 96 9.161 81 0.065 98 -
曹金凤, 王旭春, 孔亮, 2011. Python语言在Abaqus中的应用. 北京: 机械工业出版社. 韩冰, 陈少林, 梁建文, 2019. 结构-土-结构动力相互作用对结构系统频率的影响. 地震工程学报, 41(6): 1574—1580Han B. , Chen S. L. , Liang J. W. , 2019. Effects of structure-soil-structure dynamic interaction on the frequency of structural systems. China Earthquake Engineering Journal, 41(6): 1574—1580. (in Chinese) 何涛, 姜南, 2020. 土-相邻结构相互作用子结构振动台试验研究. 振动与冲击, 39(4): 207—214He T. , Jiang N. , 2020. A substructure shaking table test of soil-adjacent structure interaction. Journal of Vibration and Shock, 39(4): 207—214. (in Chinese) 李培振, 严克非, 徐鹏, 2014. 地震下考虑群体效应的高层建筑土-结构相互作用研究. 土木工程学报, 47(S1): 1—5Li P. Z. , Yan K. F. , Xu P. , 2014. Study on dynamic interaction between soil and group of high-rise buildings under seismic excitation. China Civil Engineering Journal, 47(S1): 1—5. (in Chinese) 廖振鹏, 2002. 工程波动理论导论. 2版. 北京: 科学出版社.Liao Z. P. , 2002. Introduction to wave motion theories in engineering. 2 nd ed. Beijing: Science Press. (in Chinese) 刘晶波, 王振宇, 杜修力等, 2005. 波动问题中的三维时域粘弹性人工边界. 工程力学, 22(6): 46—51 doi: 10.3969/j.issn.1000-4750.2005.06.008Liu J. B. , Wang Z. Y. , Du X. L. , et al. , 2005. Three-dimensional visco-elastic artificial boundaries in time domain for wave motion problems. Engineering Mechanics, 22(6): 46—51. (in Chinese) doi: 10.3969/j.issn.1000-4750.2005.06.008 刘晶波, 杜义欣, 闫秋实, 2007. 粘弹性人工边界及地震动输入在通用有限元软件中的实现. 见: 第三届全国防震减灾工程学术研讨会论文集. 南京: 中国土木工程学会, 43—48. 刘晶波, 宝鑫, 李述涛等, 2022. 采用黏弹性人工边界时显式算法稳定性条件. 爆炸与冲击, 42(3): 034201Liu J. B. , Bao X. , Li S. T. , et al. , 2022. Stability conditions of explicit algorithms when using viscoelastic artificial boundaries. Explosion and Shock Waves, 42(3): 034201. (in Chinese) 柳玉印, 尹训强, 2018. 考虑结构—土—结构动力相互作用的重力坝地震响应分析. 水利水电技术, 49(10): 52—58Liu Y. Y. , Yin X. Q. , 2018. Structure-soil-structure dynamic interaction-considered seismic response analysis of gravity dam. Water Resources and Hydropower Engineering, 49(10): 52—58. (in Chinese) 苏景鹤, 江丙云, 2016. ABAQUS Python二次开发攻略. 北京: 人民邮电出版社. 田彼得, 俞载道, 1987. 结构-土-结构相互作用体系的动力分析. 同济大学学报, 15(2): 157—168Tian B. D. , Yu Z. D. , 1987. Dynamic analysis of structure-soil-structure interaction. Journal of Tongji University, 15(2): 157—168. (in Chinese) 王飞, 宋志强, 刘昱杰等, 2018. 基于ABAQUS无限元的静-动力统一人工边界研究. 水资源与水工程学报, 29(6): 170—177Wang F. , Song Z. Q. , Liu Y. J. , et al. , 2018. Research on static-dynamic unified artificial boundary based on ABAQUS infinite element. Journal of Water Resources and Water Engineering, 29(6): 170—177. (in Chinese) 王国波, 袁明智, 苗雨, 2018. 结构-土-结构相互作用体系地震响应研究综述. 岩土工程学报, 40(5): 837—847Wang G. B. , Yuan M. Z. , Miao Y. , 2018. Review of seismic response of structure-soil-structure interaction system. Chinese Journal of Geotechnical Engineering, 40(5): 837—847. (in Chinese) 应稼年, 王荣昌, 俞载道, 1995. 地基土-桩基础-核电站辅助厂房结构相互作用体系的地震响应分析. 地震工程与工程振动, 15(1): 44—52 doi: 10.13197/j.eeev.1995.01.006Ying J. N. , Wang R. C. , Yu Z. D. , 1995. Earthquake response analysis of soil-pile-nuclear power station auxiliary workshop structure interaction system. Earthquake Engineering and Engineering Vibration, 15(1): 44—52. (in Chinese) doi: 10.13197/j.eeev.1995.01.006 中华人民共和国住房和城乡建设部, 国家市场监督管理总局, 2019. GB 50267—2019 核电厂抗震设计标准. 北京: 中国计划出版社.Ministry of Housing and Urban Rural Development of the People's Republic of China, State Administration of Market Supervision and Administration, 2019. GB 50267—2019 Standard for seismic design of nuclear power plants. Beijing: China Planning Press. (in Chinese) Aldaikh H. , Alexander N. A. , Ibraim E. , et al. , 2015. Two dimensional numerical and experimental models for the study of structure–soil–structure interaction involving three buildings. Computers & Structures, 150: 79—91. Aldaikh H. , Alexander N. A. , Ibraim E. , et al. , 2016. Shake table testing of the dynamic interaction between two and three adjacent buildings (SSSI). Soil Dynamics and Earthquake Engineering, 89: 219—232. doi: 10.1016/j.soildyn.2016.08.012 ASCE, Seismic analysis of safety-related nuclear structures, ASCE/SEI 4-16. 2016, American Society of Civil Engineers: New York Belytschko T. , Mullen R. , 1978. Stability of explicit-implicit mesh partitions in time integration. International Journal for Numerical Methods in Engineering, 12(10): 1575—1586. doi: 10.1002/nme.1620121008 Belytschko T., Yen H. J., Mullen R., 1979. Mixed methods for time integration. Computer Methods in Applied Mechanics and Engineering, 17—18: 259—275. Belytschko T. , Smolinski P. , Liu W. K. , 1985. Stability of multi-time step partitioned integrators for first-order finite element systems. Computer Methods in Applied Mechanics and Engineering, 49(3): 281—297. doi: 10.1016/0045-7825(85)90126-4 Chen S. L. , Lv H. , Zhou G. L. , 2022. Partitioned analysis of soil-structure interaction for Nuclear Island Buildings. Earthquake Engineering & Structural Dynamics, 51(10): 2220—2247. Ghandil M. , Behnamfar F. , Vafaeian M. , 2016. Dynamic responses of structure–soil–structure systems with an extension of the equivalent linear soil modeling. Soil Dynamics and Earthquake Engineering, 80: 149—162. doi: 10.1016/j.soildyn.2015.10.014 Kitada Y., Hirotani T., Iguchi M., 1999. Models test on dynamic structure–structure interaction of nuclear power plant buildings. Nuclear Engineering and Design, 192(2—3): 205—216. Lee T. H. , Wesley D. A. , 1973 a. Soil-structure interaction of nuclear reactor structures considering through-soil coupling between adjacent structures. Nuclear Engineering and Design, 24(3): 374—387. doi: 10.1016/0029-5493(73)90007-1 Lee T. H., Wesley D. A., 1973b. Influence of through-soil coupling between adjacent structures on seismic response of nuclear reactors. In: Proceedings of the Second International Conference on Structural Mechanics in Reactor Technology. Berlin: IASMiRT, 2—9. Lehmann L. , Antes H. , 2001. Dynamic structure-soil-structure interaction applying the Symmetric Galerkin Boundary Element Method (SGBEM). Mechanics Research Communications, 28(3): 297—304. doi: 10.1016/S0093-6413(01)00177-X Lou M. L. , Wang H. F. , Chen X. , et al. , 2011. Structure-soil-structure interaction: literature review. Soil Dynamics and Earthquake Engineering, 31(12): 1724—1731. doi: 10.1016/j.soildyn.2011.07.008 Luco J. E. , Contesse L. , 1973. Dynamic structure-soil-structure interaction. Bulletin of the Seismological Society of America, 63(4): 1289—1303. doi: 10.1785/BSSA0630041289 Matthees W. , Magiera G. , 1982. A sensitivity study of seismic structure-soil-structure interaction problems for nuclear power plants. Nuclear Engineering and Design, 73(3): 343—363. doi: 10.1016/0029-5493(82)90011-5 Murakami H. , Luco J. E. , 1977. Seismic response of a periodic array of structures. Journal of the Engineering Mechanics Division, 103(5): 965—977. doi: 10.1061/JMCEA3.0002286 Wang J. S. , Guo T. , Du Z. Y. , 2022. Experimental and numerical study on the influence of dynamic structure-soil-structure interaction on the responses of two adjacent idealized structural systems. Journal of Building Engineering, 52: 104454. doi: 10.1016/j.jobe.2022.104454 Warburton G. B. , Richardson J. D. , Webster J. J. , 1971. Forced vibrations of two masses on an elastic half space. Journal of Applied Mechanics, 38(1): 148—156. doi: 10.1115/1.3408735 Whitman R. V. , 1969. The current status of soil dynamics. Applied Mechanics Reviews, 22(1): 1—8. Wong H. L. , Trifunac M. D. , 1975. Two-dimensional, antiplane, building-soil-building interaction for two or more buildings and for incident planet SH waves. Bulletin of the Seismological Society of America, 65(6): 1863—1885. -


 下载:
下载:
