
Study on Azimuth-related Site Amplification Effect of Seismic Ground Motion
-
摘要: 现有场地对地震动的放大作用分析中,常采用观测得到正交方向的HVSR和SBSR的矢量合成结果表征场地放大作用,而不考虑放大作用的方向相关性。为研究不同地震作用下场地放大作用的方向相关性,采用多向HVSR和多向SBSR及谱比峰值方向相关分布概率,以11次地震事件获得的地表、井下基岩记录作为数据,开展响嘡场地效应台阵场地对地震动放大作用的方向相关性分析。研究结果表明,常用的矢量合成法分析结果与多向谱比上包络曲线法分析结果存在差异,前者存在忽略部分峰值的可能;多向谱比的极坐标等高线图可较直观地体现场地对地震动放大作用的方向相关性特征,但不同多向谱比表现存在差异;多向谱比峰值方向分布概率可较好地定量分析放大作用峰值在不同方向上的差异,但不同地震事件存在差异,不同的多向谱比存在差异。可采用多向谱比上包络曲线法分析场地放大作用,除可避免矢量合成法引起的误估外,也可更好地分析实际场地频率-方向相关的放大作用。
-
关键词:
- 多向HVSR /
- 多向SBSR /
- 谱比包络 /
- 场地效应 /
- 峰值方向相关分布概率
Abstract: In recent analysis on site amplification effect of seismic ground motion, the square root of HVSR and SBSR obtained from seismic observation in orthogonal direction was often used to characterize the site amplification effect, however, the azimuth-related site amplification effect of seismic ground motion is not considered. To discuss this effect, the azimuth-related HVSRs, SBSRs, and distribution probability of peak values on the spectral ratios were selected, and the surface and borehole seismic records on Xiangtang Array site in 11 earthquake events were collected, finally, the azimuth-related site amplification effect was analyzed. The results show: (1) the results from the square root algorithm have the risk of ignoring some frequencies which are different with the proposed upper envelope algorithm in this work, (2) the contour of azimuth-related spectral ratios in polar coordinates could directly represent the directionality characteristics of site amplification effect, but the results from different multi-directional spectral ratios are different, (3) the azimuth-related of peak values could characterize in quantity the difference in azimuth of site amplification effect, but the probabilities were various with the different multi-directional spectral ratio and the data from different event. According to the results and discussion in this work, the azimuth-related spectral ratios could be used in the analysis of site amplification effect, for avoiding the under-estimate of amplification effect by the square root algorithm, and the method could be used to understand the frequency-direction correlation of site amplification effect better. -
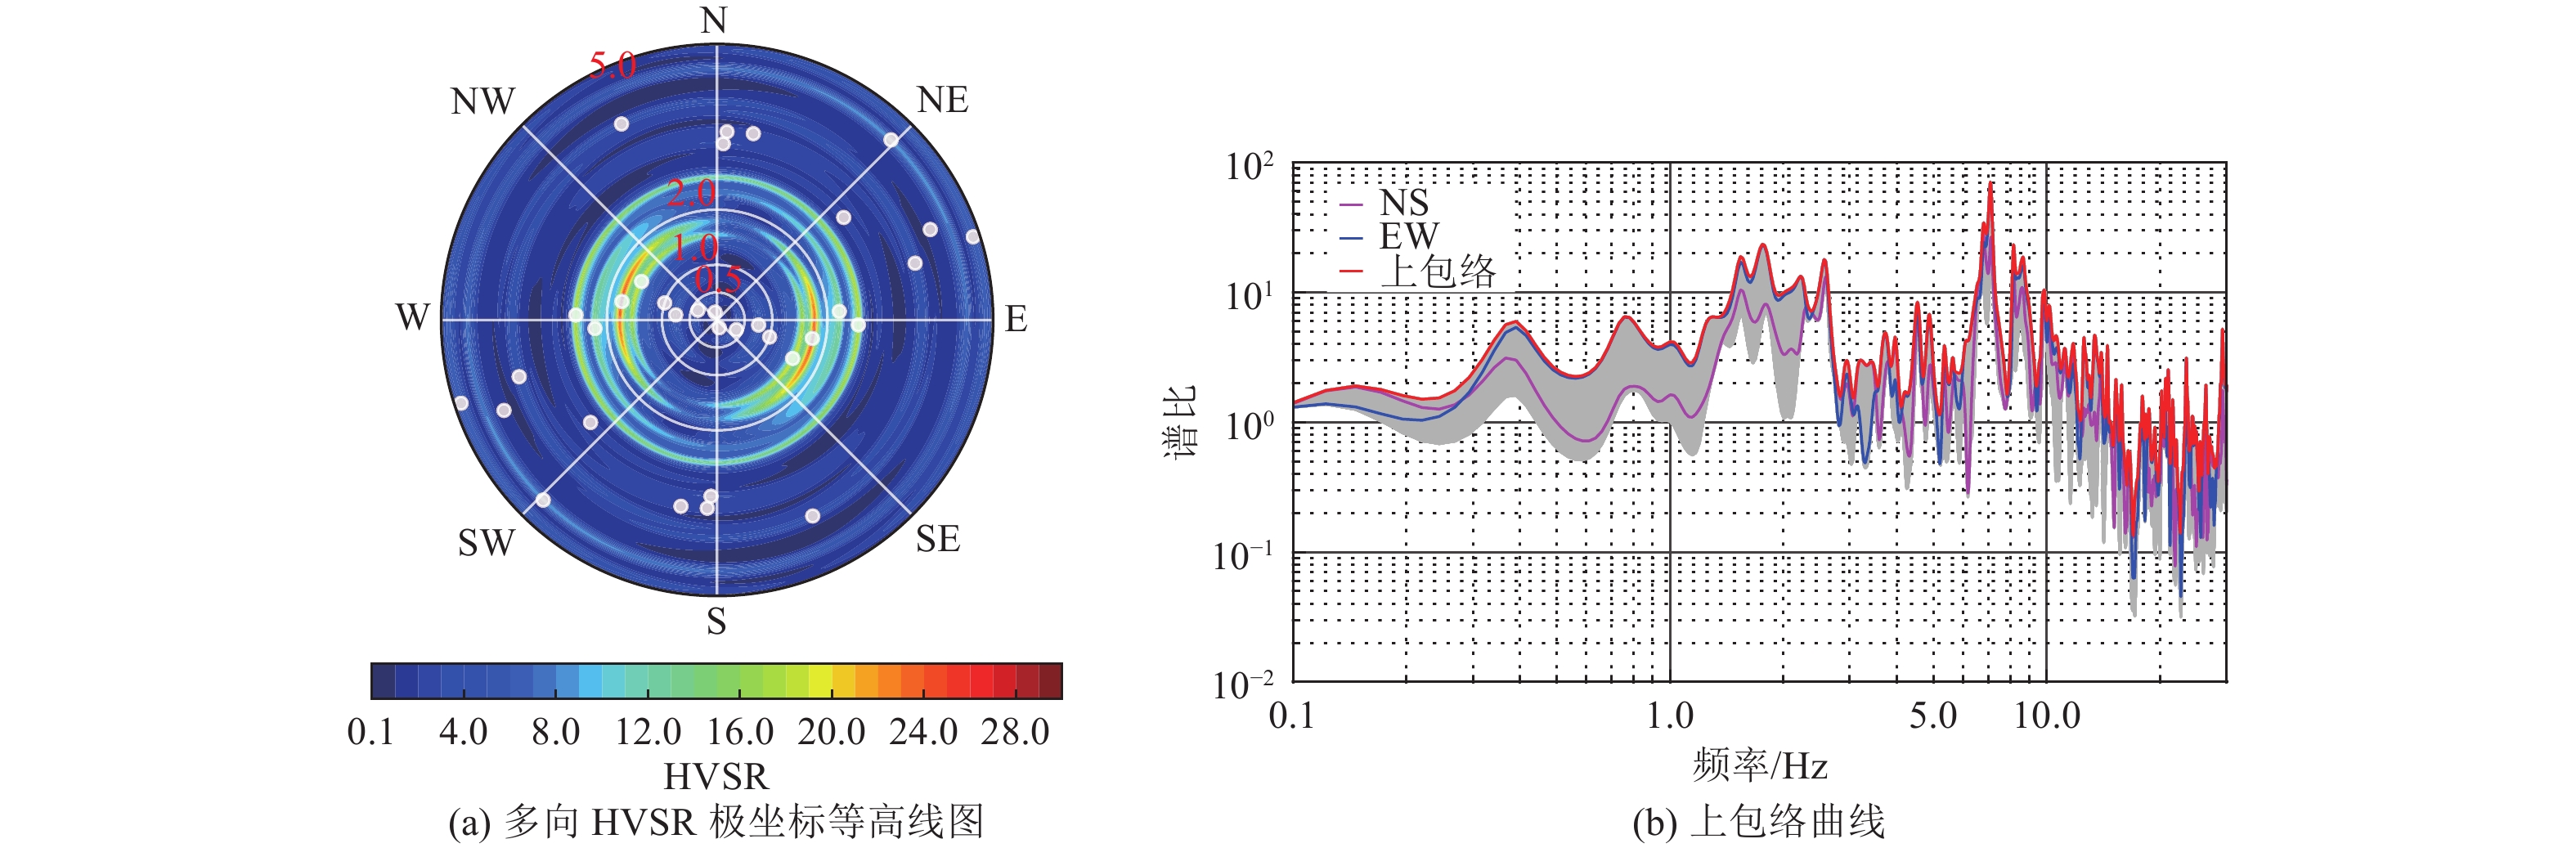
图 1 多向HVSR极坐标等高线图和上包络曲线
Figure 1. Azimuth-related HVSR polar contour map and upper envelope

图 2 多向HVSR峰值点分布散点图和方位角相关统计分布概率图
Figure 2. Peak value point distribution scatter of azimuth-related HVSR in 0-5 Hz range and the histogram of azimuth-related distribution probability

图 3 根据弱震记录计算得到的HVSR和SBSR均值曲线
Figure 3. Mean HVSR and SBSR curve from different algorithms and different events
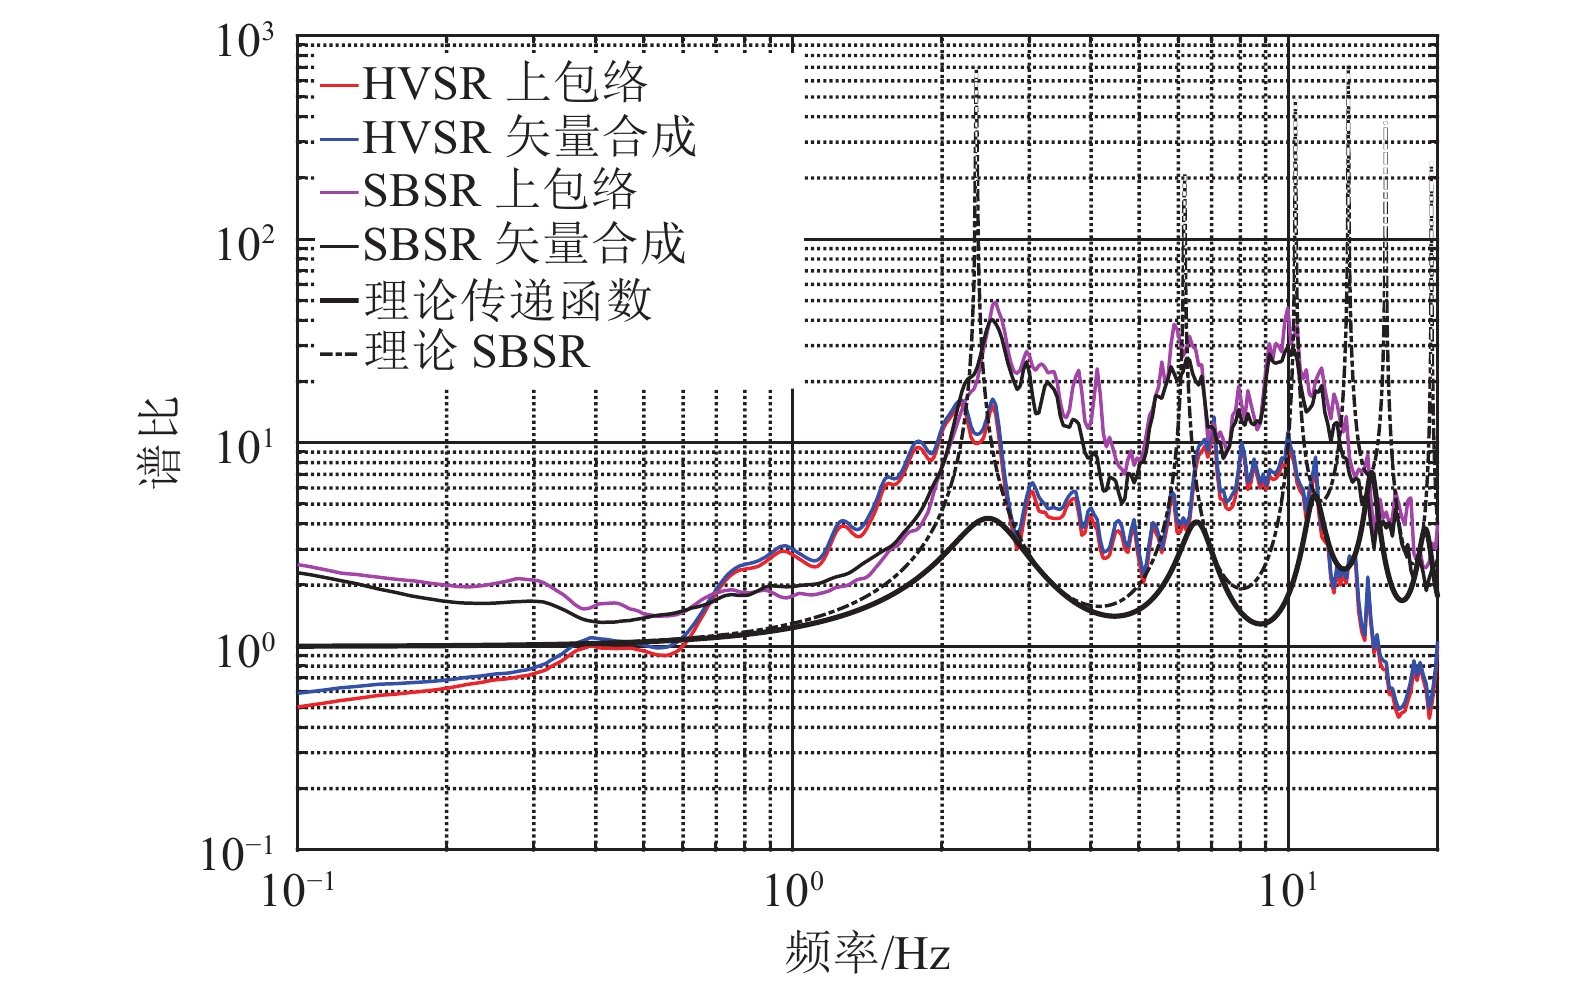
图 4 HVSR均值、SBSR均值和理论传递函数及理论SBSR的对比
Figure 4. Comparison of the mean of HVSR, SBSR, theoretical transfer function, and SBSR
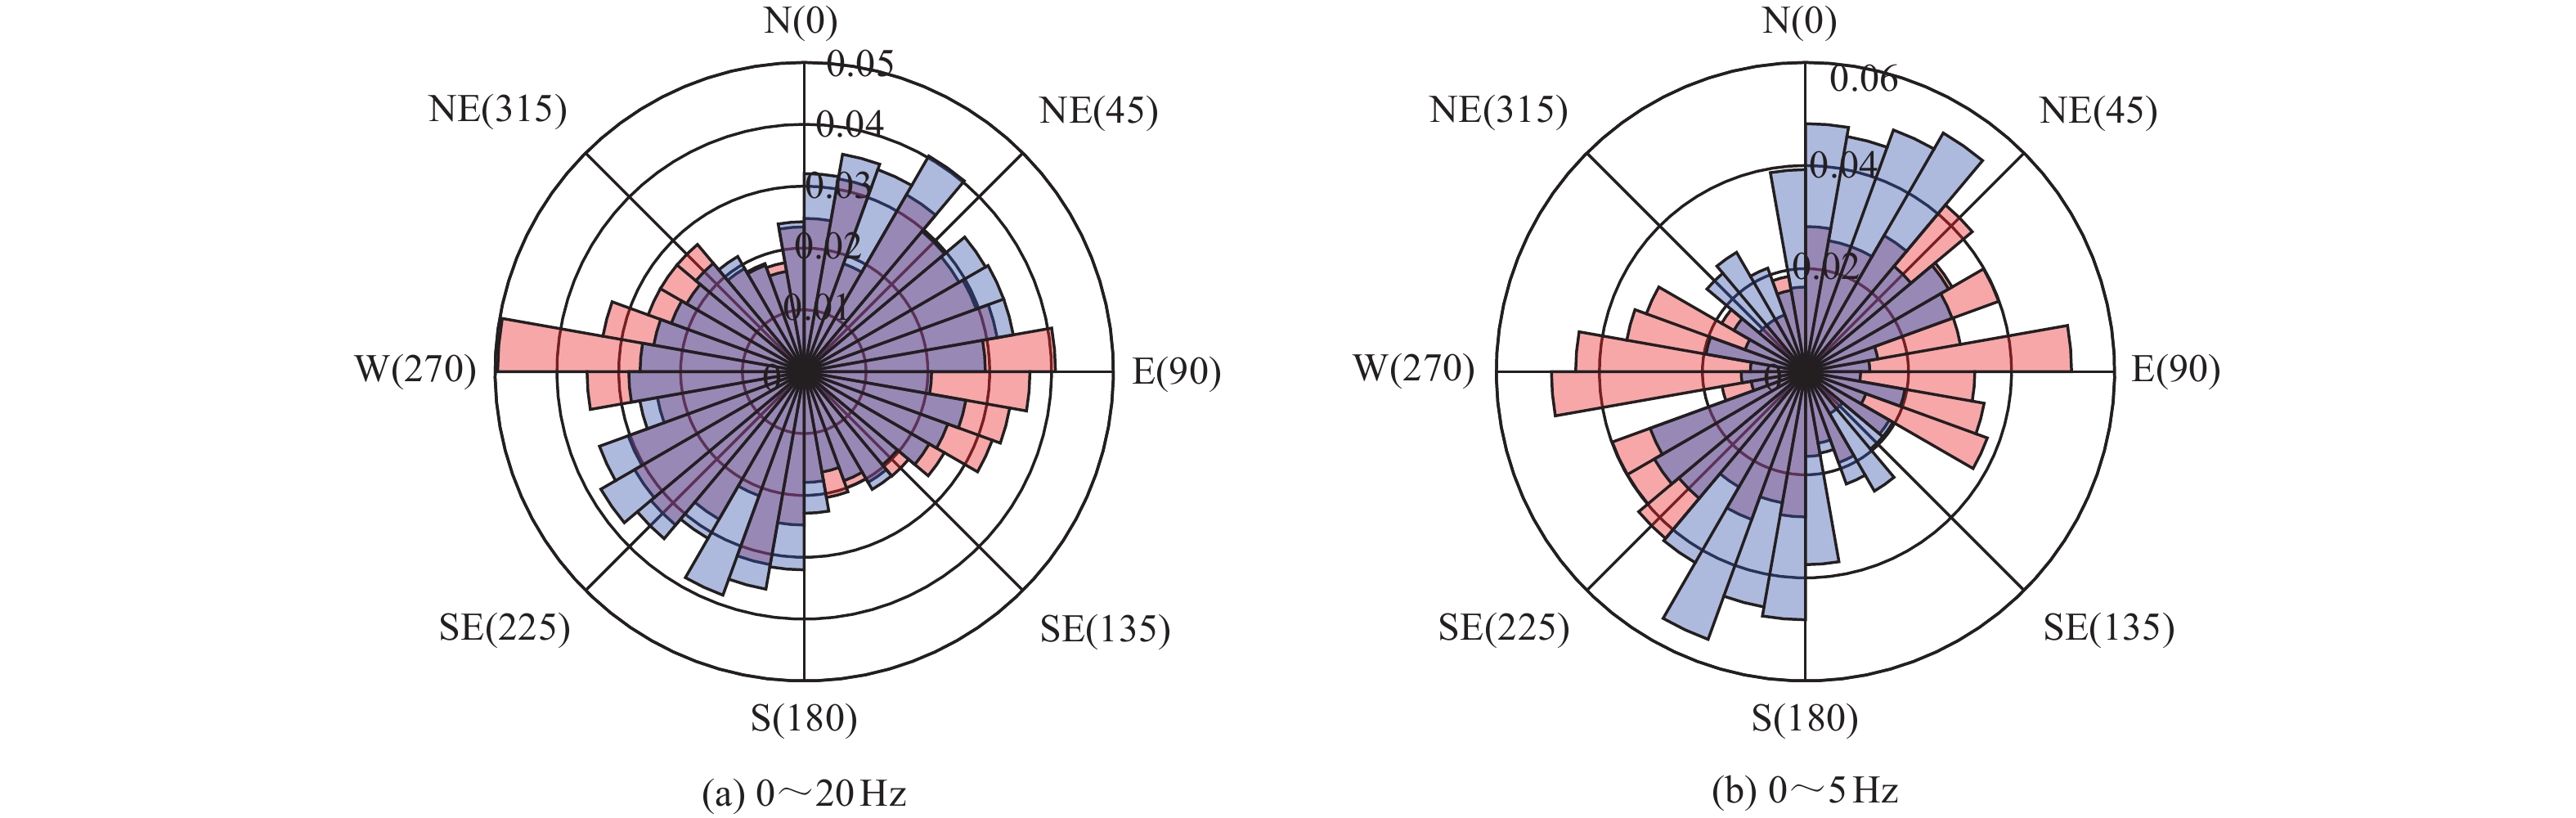
图 5 全部地震记录多向HVSR和多向SBSR峰值点角度相关分布概率
注:图中红色为HVSR数据,蓝色为SBSR,紫色为二者相同重叠部分
Figure 5. Peak value point distribution probability of azimuth-related HVSR and SBSR based on 11 earthquake events
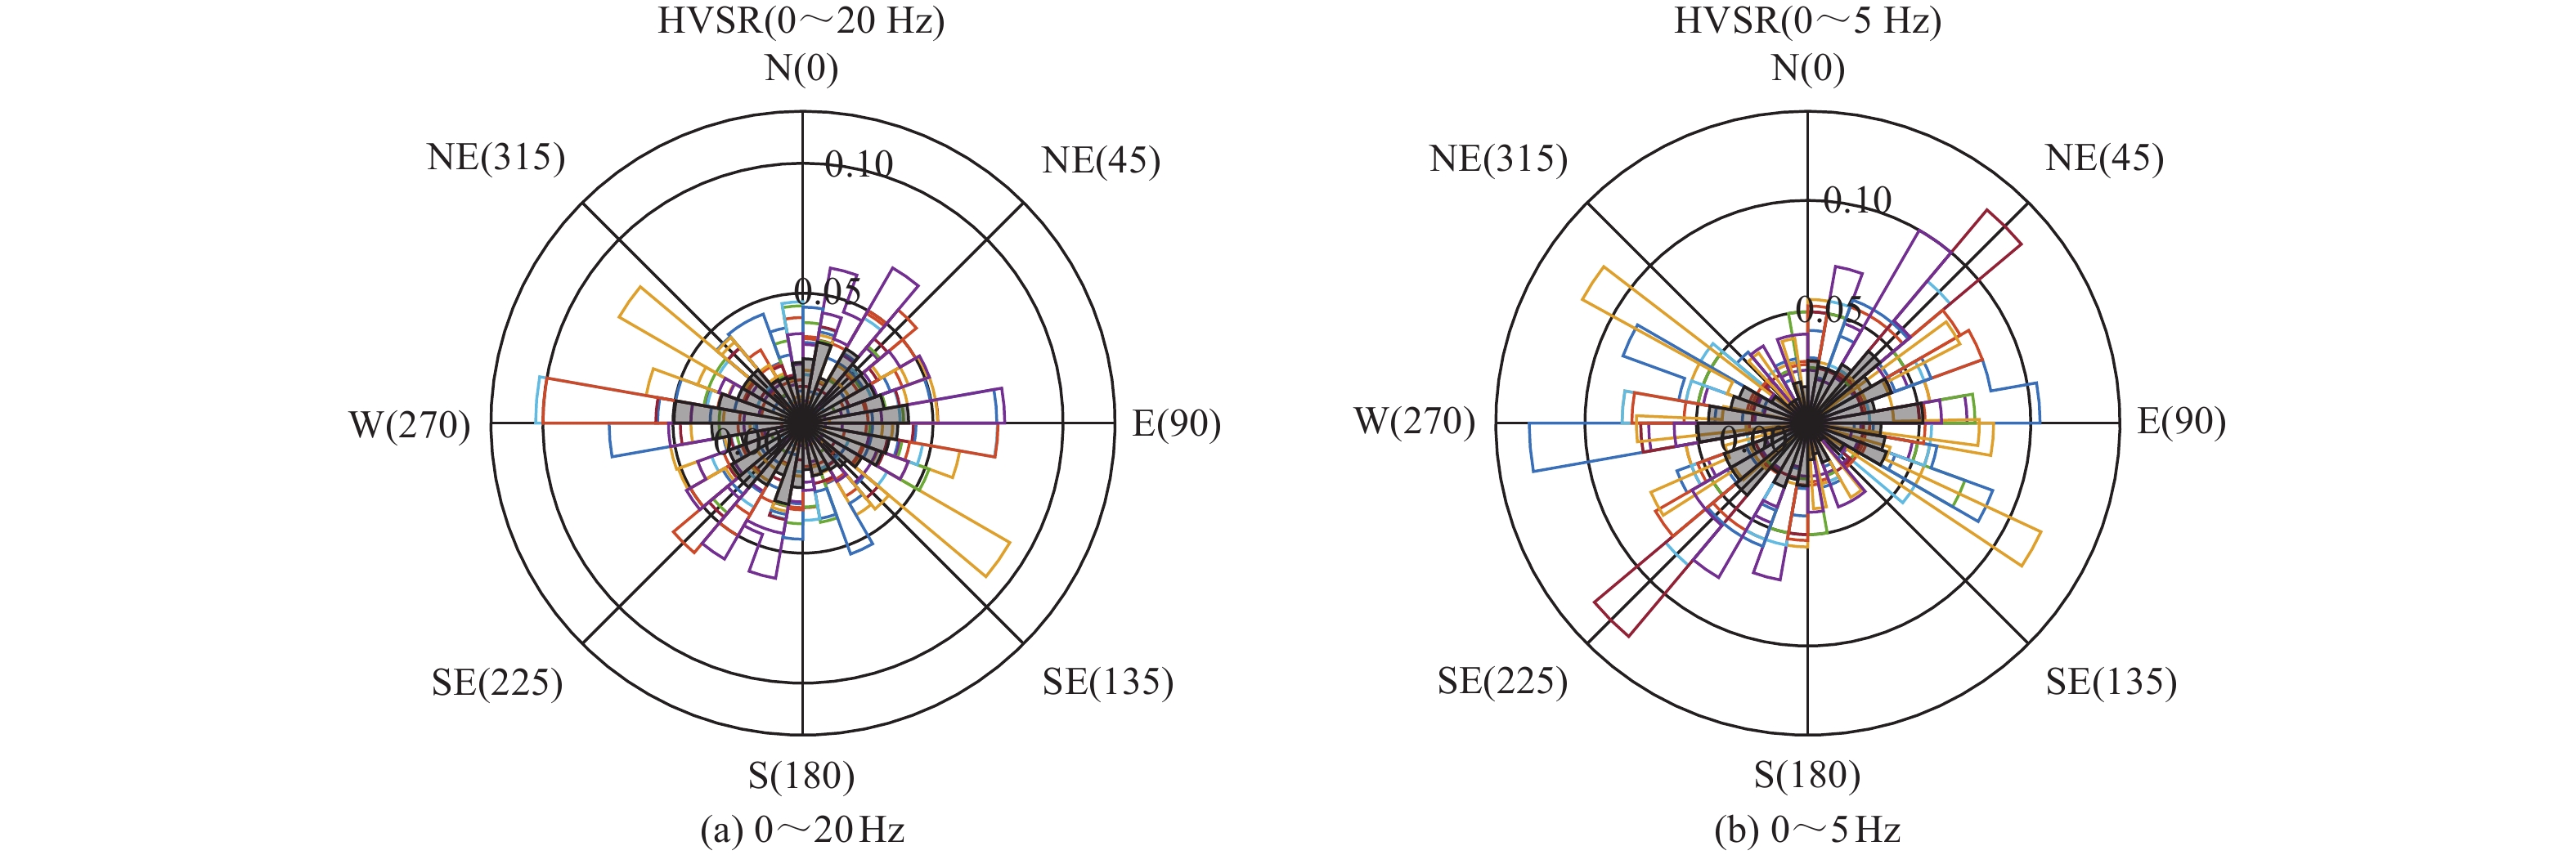
图 6 单次地震记录多向HVSR峰值点角度相关分布概率和全部记录分布概率对比
注:彩色柱状图为单次地震记录结果,灰色为全部地震记录结果
Figure 6. Peak value point distribution probability of azimuth-related HVSR from single event and all events
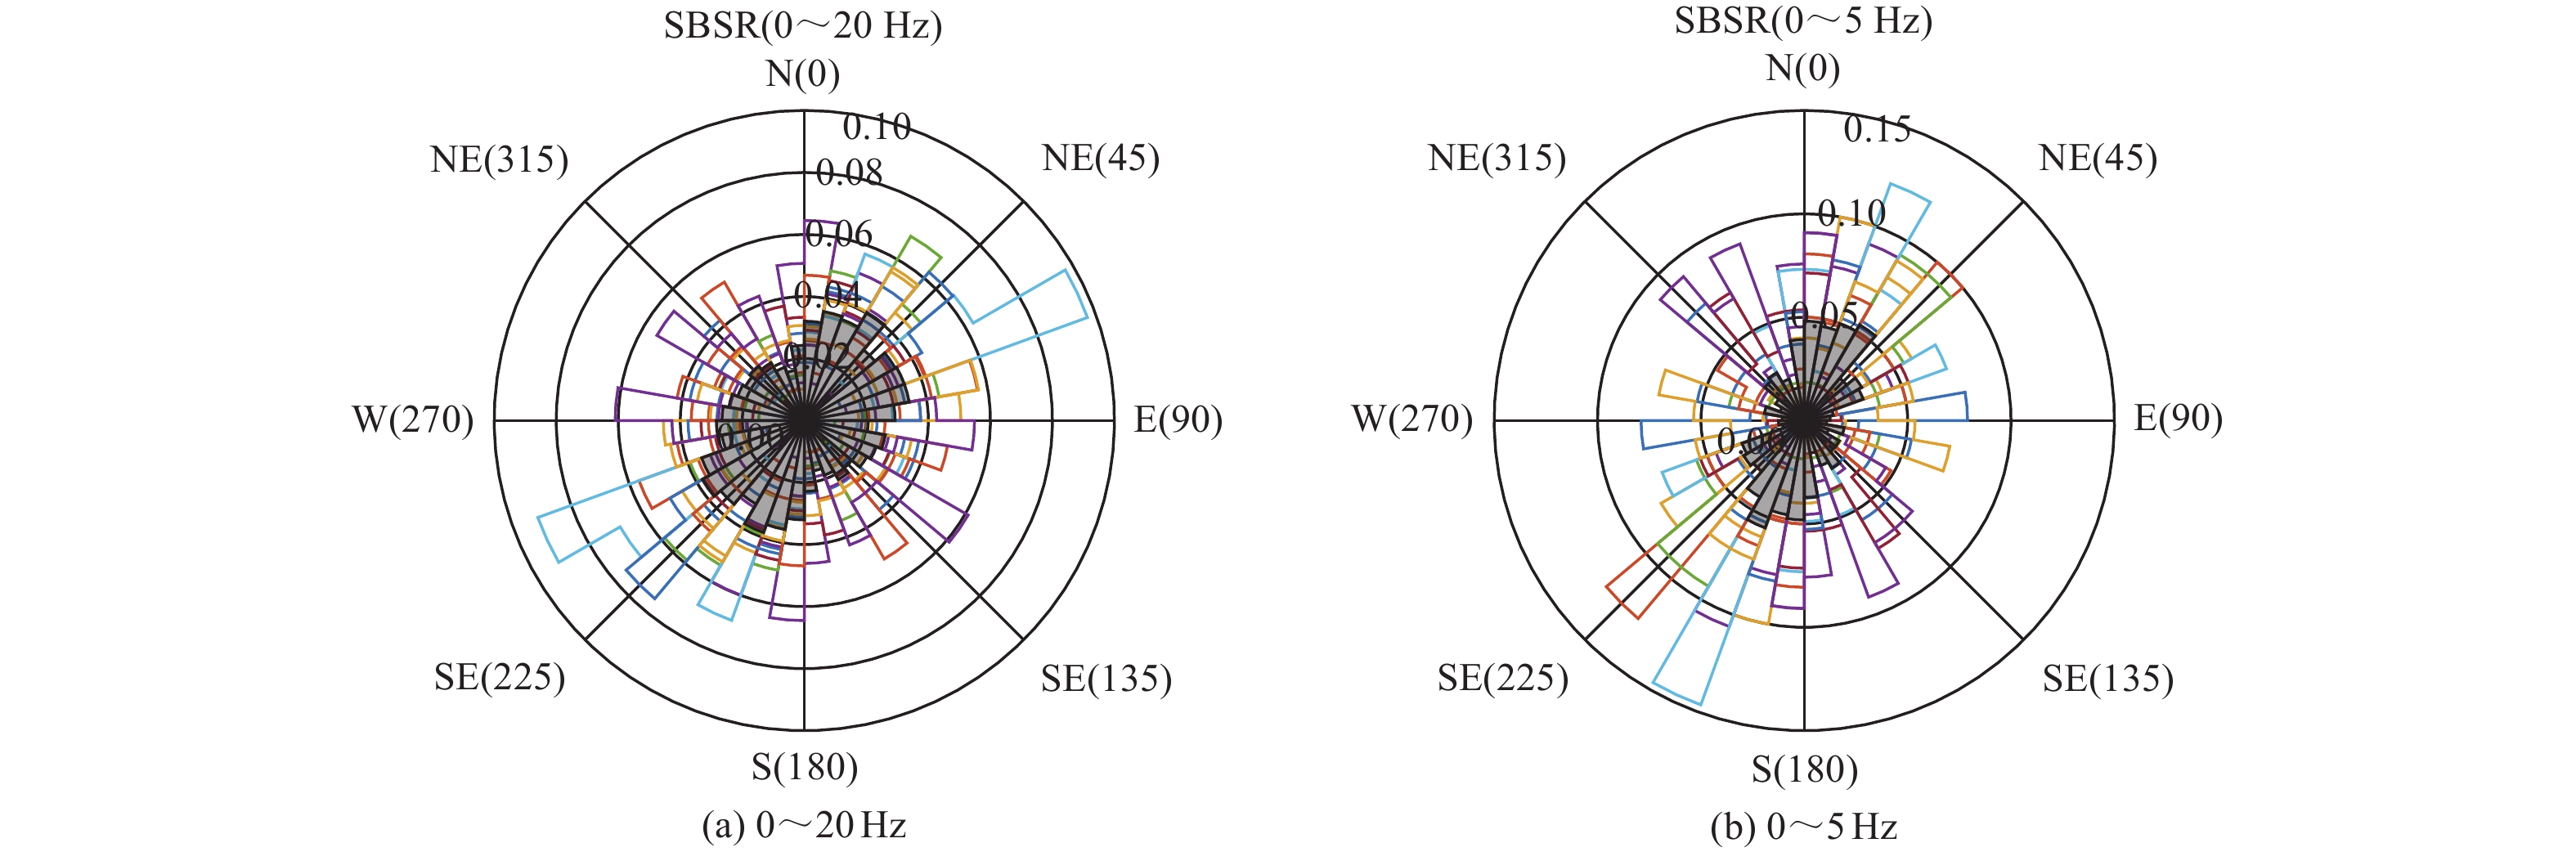
图 7 单次地震记录多向SBSR峰值点角度相关分布概率和全部记录分布概率对比
注:彩色柱状图为单次地震记录结果,灰色为全部地震记录结果
Figure 7. Peak value point distribution probability of azimuth-related SBSR from single event and all events
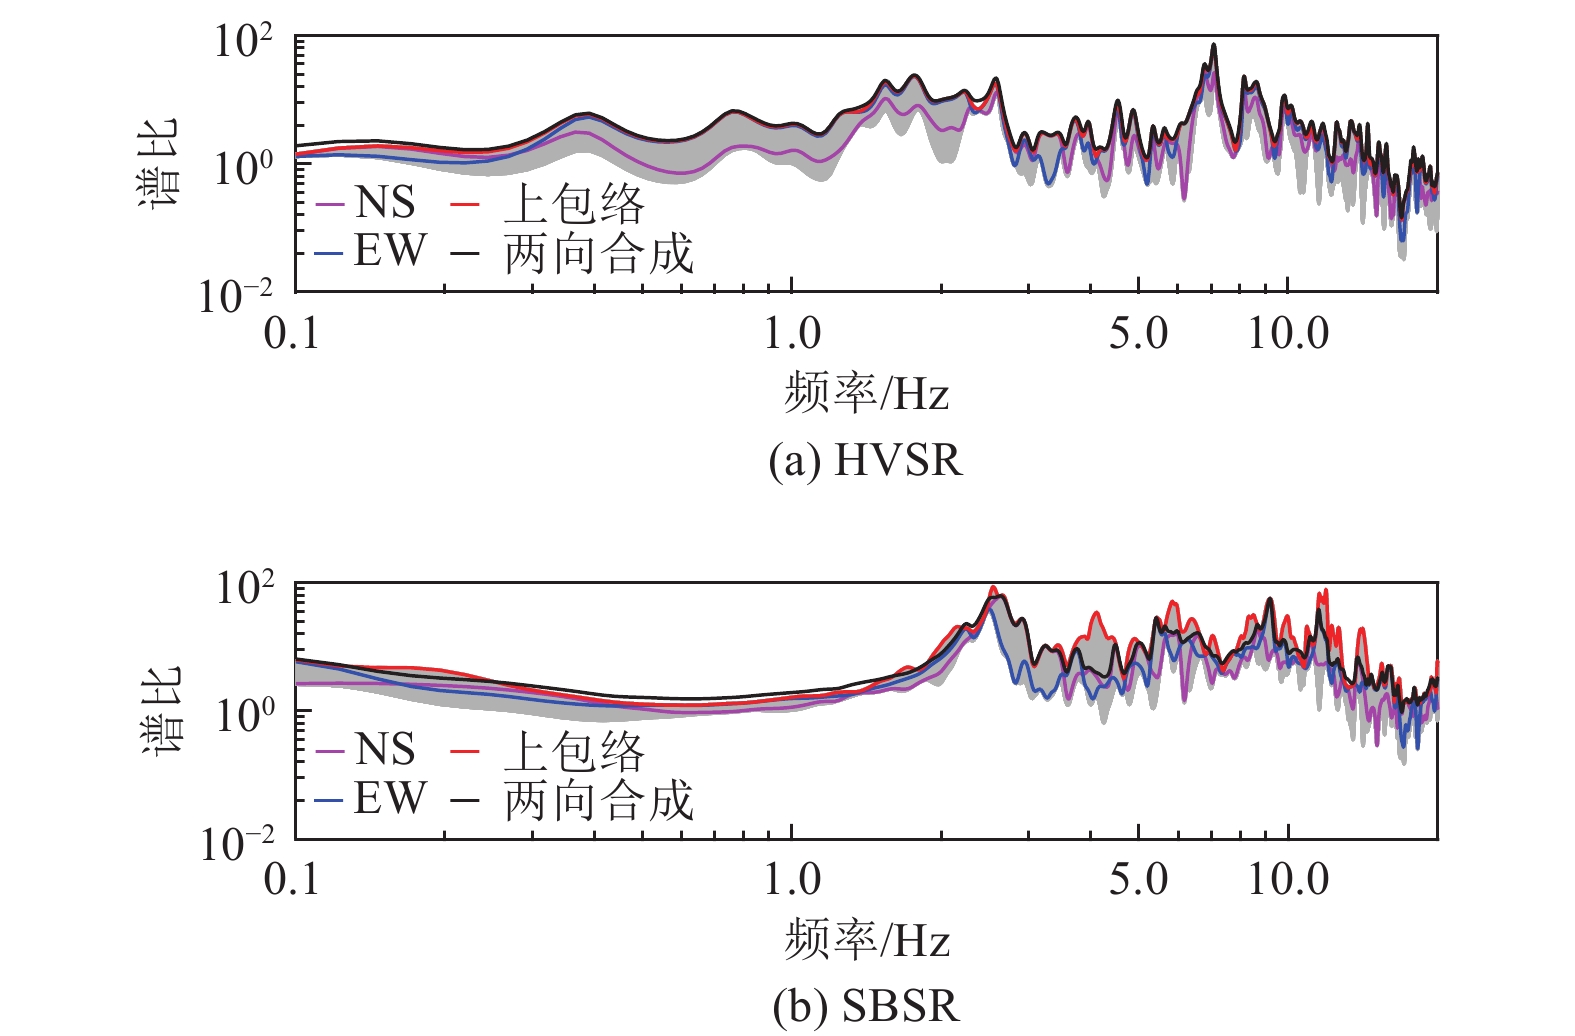
图 8 2种计算方法得到的典型地震记录HVSR和SBSR差异比较
Figure 8. Comparison of HVSR and SBSR by 2 different algorithms from the records in typical earthquake event

图 9 典型地震记录HVSR和SBSR峰值点角度相关分布概率差异比较
Figure 9. Comparison of peak value point distribution probability of azimuth-related HVSR and SBSR from the records in typical earthquake event
表 1 本文选用记录对应的地震事件相关参数
Table 1. Parameter of the earthquake events selected in this work
发震时间/(年-月-日) 震中位置 震级ML 震源深度/km 震源关系 PGA/Gal 纬度/° 经度/° 地点 震中距离/km 方位角/° EW向 NS向 2001-07-11 北纬39.75 东经118.28 陡河 3.5 5 36.4 278.9 6.22 8.30 2001-10-22 北纬39.78 东经118.70 滦县 3.1 — 8.9 0 18.41 11.58 2001-12-28 北纬39.67 东经118.65 滦县 4.2 12 5.4 232.2 97.96 161.71 2002-01-30 北纬39.68 东经118.25 唐山 3.3 — 38.7 266.9 3.10 4.75 2002-02-09 北纬39.77 东经118.37 陡河 4.0 — 29.3 285.5 13.61 18.51 2002-05-06 北纬39.80 东经118.77 滦县 3.8 — 12.6 28.4 48.80 60.00 2002-05-19 北纬39.37 东经117.98 丰南 4.7 — 71.9 239.6 5.84 6.83 2002-06-06 北纬39.70 东经118.75 滦县 2.7 6 4.3 90.0 5.80 6.90 2002-06-20 北纬39.88 东经118.78 卢龙 2.8 9 21.1 18.9 8.95 7.32 2002-07-20 北纬39.85 东经118.75 沙河驿 3.3 10 17.2 14.4 6.30 12.40 2002-11-13 北纬39.77 东经118.63 滦县 3.0 15 9.8 322.4 8.65 7.55  下载: 导出CSV
-
李红光, 冷崴, 2019. H/V谱比方法在强震记录应用中几个影响因素的初步研究. 地震工程学报, 41(1): 169—176 doi: 10.3969/j.issn.1000-0844.2019.01.169Li H. G. , Leng W. , 2019. Preliminary study on the influencing factors of the horizontal-to-vertical spectral ratio applied in strong motion. China Earthquake Engineering Journal, 41(1): 169—176. (in Chinese) doi: 10.3969/j.issn.1000-0844.2019.01.169 卢滔, 周正华, 周雍年等, 2006. 关于Nakamura方法有效性的讨论. 地震工程与工程振动, 26(1): 43—48 doi: 10.3969/j.issn.1000-1301.2006.01.007Lu T. , Zhou Z. H. , Zhou Y. N. , et al. , 2006. Discussion on validation of Nakamura's technique. Earthquake Engineering and Engineering Vibration, 26(1): 43—48. (in Chinese) doi: 10.3969/j.issn.1000-1301.2006.01.007 荣棉水, 李小军, 王振明等, 2016. HVSR方法用于地震作用下场地效应分析的适用性研究. 地球物理学报, 59(8): 2878—2891 doi: 10.6038/cjg20160814Rong M. S. , Li X. J. , Wang Z. M. , et al. , 2016. Applicability of HVSR in analysis of site-effects caused by earthquakes. Chinese Journal of Geophysics, 59(8): 2878—2891. (in Chinese) doi: 10.6038/cjg20160814 姚鑫鑫, 任叶飞, 温瑞智等, 2019. 强震动记录H/V谱比法计算处理的若干关键环节. 震灾防御技术, 14(4): 719—730 doi: 10.11899/zzfy20190403Yao X. X. , Ren Y. F. , Wen R. Z. , et al. , 2019. Some technical notes on the data processing of the spectral ratio based on the strong-motion records. Technology for Earthquake Disaster Prevention, 14(4): 719—730. (in Chinese) doi: 10.11899/zzfy20190403 张照鹏, 荣棉水, 卢滔等, 2019. HVSR谱比法应用于强震数据时基本假定合理性讨论. 地震研究, 42(4): 538—545 doi: 10.3969/j.issn.1000-0666.2019.04.012Zhang Z. P. , Rong M. S. , Lu T. , et al. , 2019. Discussion on rationality of basic assumptions when applying HVSR method to strong earthquake data. Journal of Seismological Research, 42(4): 538—545. (in Chinese) doi: 10.3969/j.issn.1000-0666.2019.04.012 D'Amico V. , Picozzi M. , Baliva F. , et al. , 2008. Ambient noise measurements for preliminary site-effects characterization in the urban area of Florence, Italy. Bulletin of the Seismological Society of America, 98(3): 1373—1388. doi: 10.1785/0120070231 Del Gaudioa V. , Zhao B. , Luo Y. H. , et al. , 2019. Seismic response of steep slopes inferred from ambient noise and accelerometer recordings: the case of Dadu River valley, China. Engineering Geology, 259: 105197. doi: 10.1016/j.enggeo.2019.105197 Konno K. , Ohmachi T. , 1998. Ground-motion characteristics estimated from spectral ratio between horizontal and vertical components of microtremor. Bulletin of the Seismological Society of America, 88(1): 228—241. doi: 10.1785/BSSA0880010228 Lee C. T. , Cheng C. T. , Liao C. W. , et al. , 2001. Site classification of Taiwan free-field strong-motion stations. Bulletin of the Seismological Society of America, 91(5): 1283—1297. Li X. J. , Li N. , Rong M. S. , et al. , 2022. Novel evaluation method for site effect on earthquake ground motion based on modified horizontal to vertical spectral ratio. Frontiers in Earth Science, 10: 938514. doi: 10.3389/feart.2022.938514 Nakamura Y. , 1989. A method for dynamic characteristics estimation of subsurface using microtremor on the ground surface. Quarterly Reports of RTRI, 30(1): 25—33. Rong M. S. , Wang Z. M. , Woolery E. W. , et al. , 2016. Nonlinear site response from the strong ground-motion recordings in western China. Soil Dynamics and Earthquake Engineering, 82: 99—110. doi: 10.1016/j.soildyn.2015.12.001 Wang Z. M. , Carpenter N. S. , Woolery E. W. , 2019. Horizontal-to-vertical spectral ratio of S-waves and SH-wave transfer functions at the vertical seismic and strong-motion arrays in the Central United States. Journal of Applied Geophysics, 162: 64—71. doi: 10.1016/j.jappgeo.2018.10.017 Wen R. Z. , Ren Y. F. , Shi D. C. , 2011. Improved HVSR site classification method for free-field strong motion stations validated with Wenchuan aftershock recordings. Earthquake Engineering and Engineering Vibration, 10(3): 325—337. doi: 10.1007/s11803-011-0069-x -

 点击查看大图
计量
- 文章访问数: 415
- HTML全文浏览量: 170
- PDF下载量: 55
- 被引次数: 0
