
Research on Shear-wave Velocity Profile VS30 Estimation Model in Xiong'an New District
-
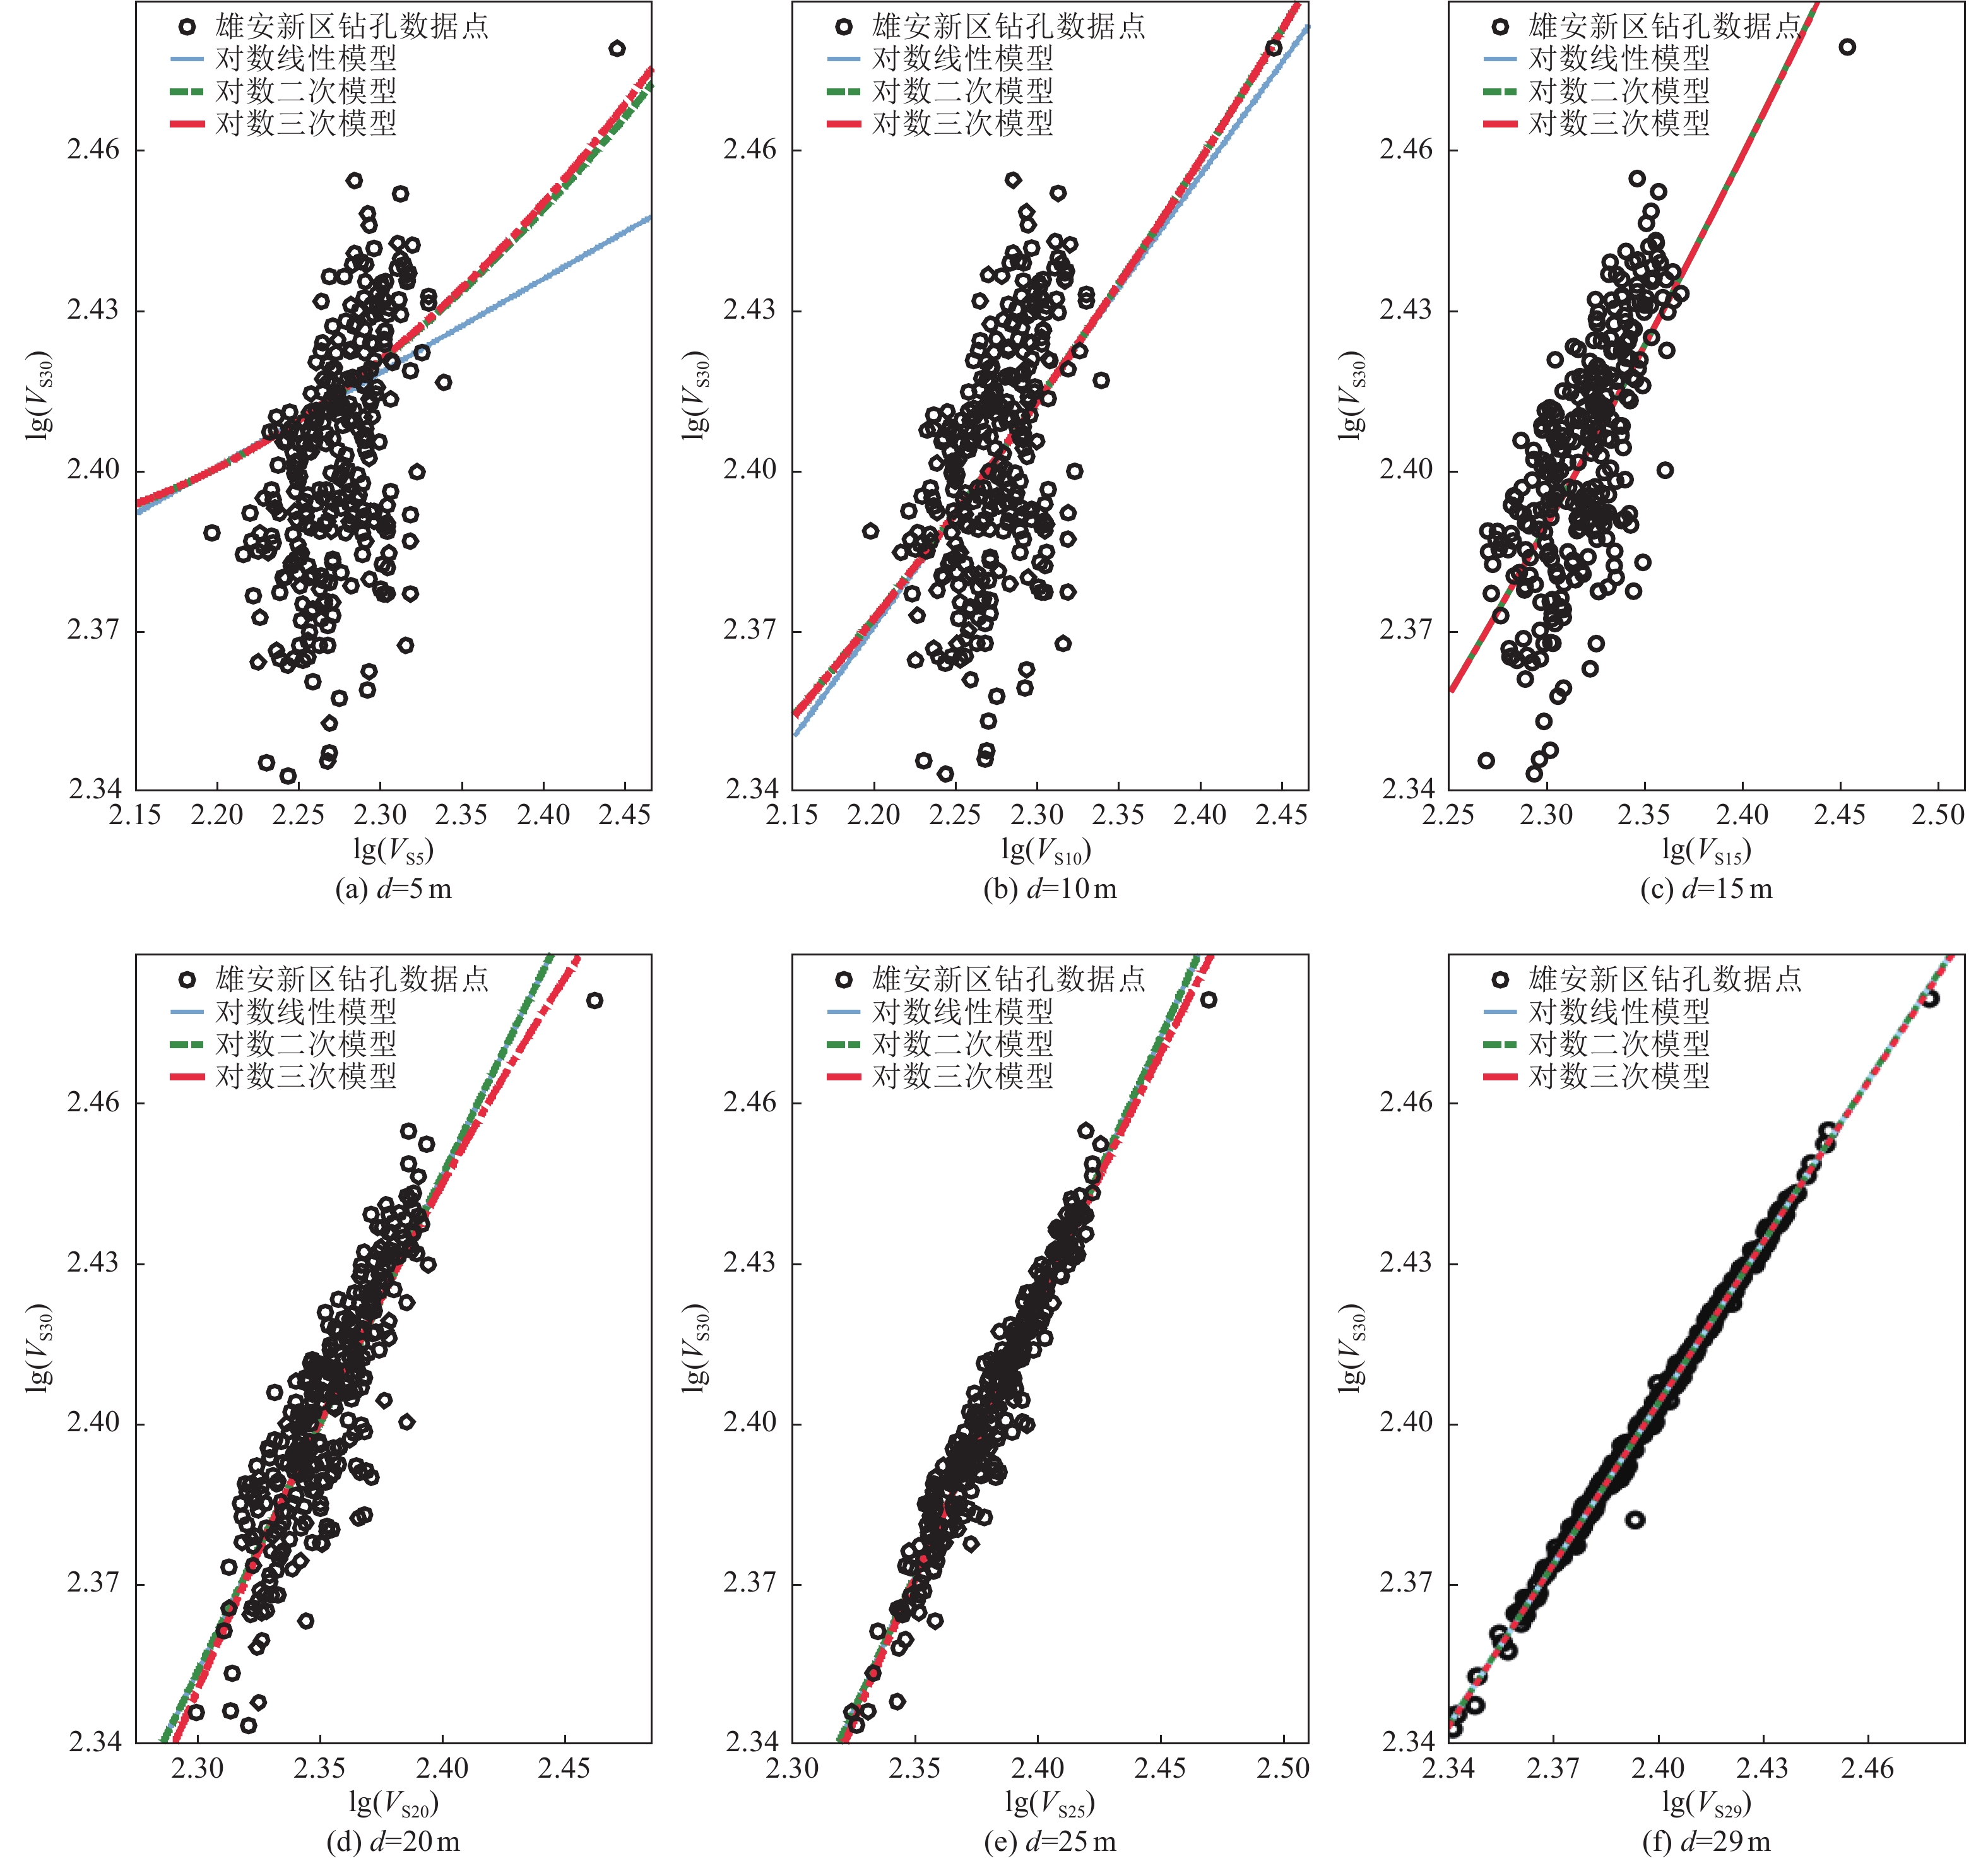
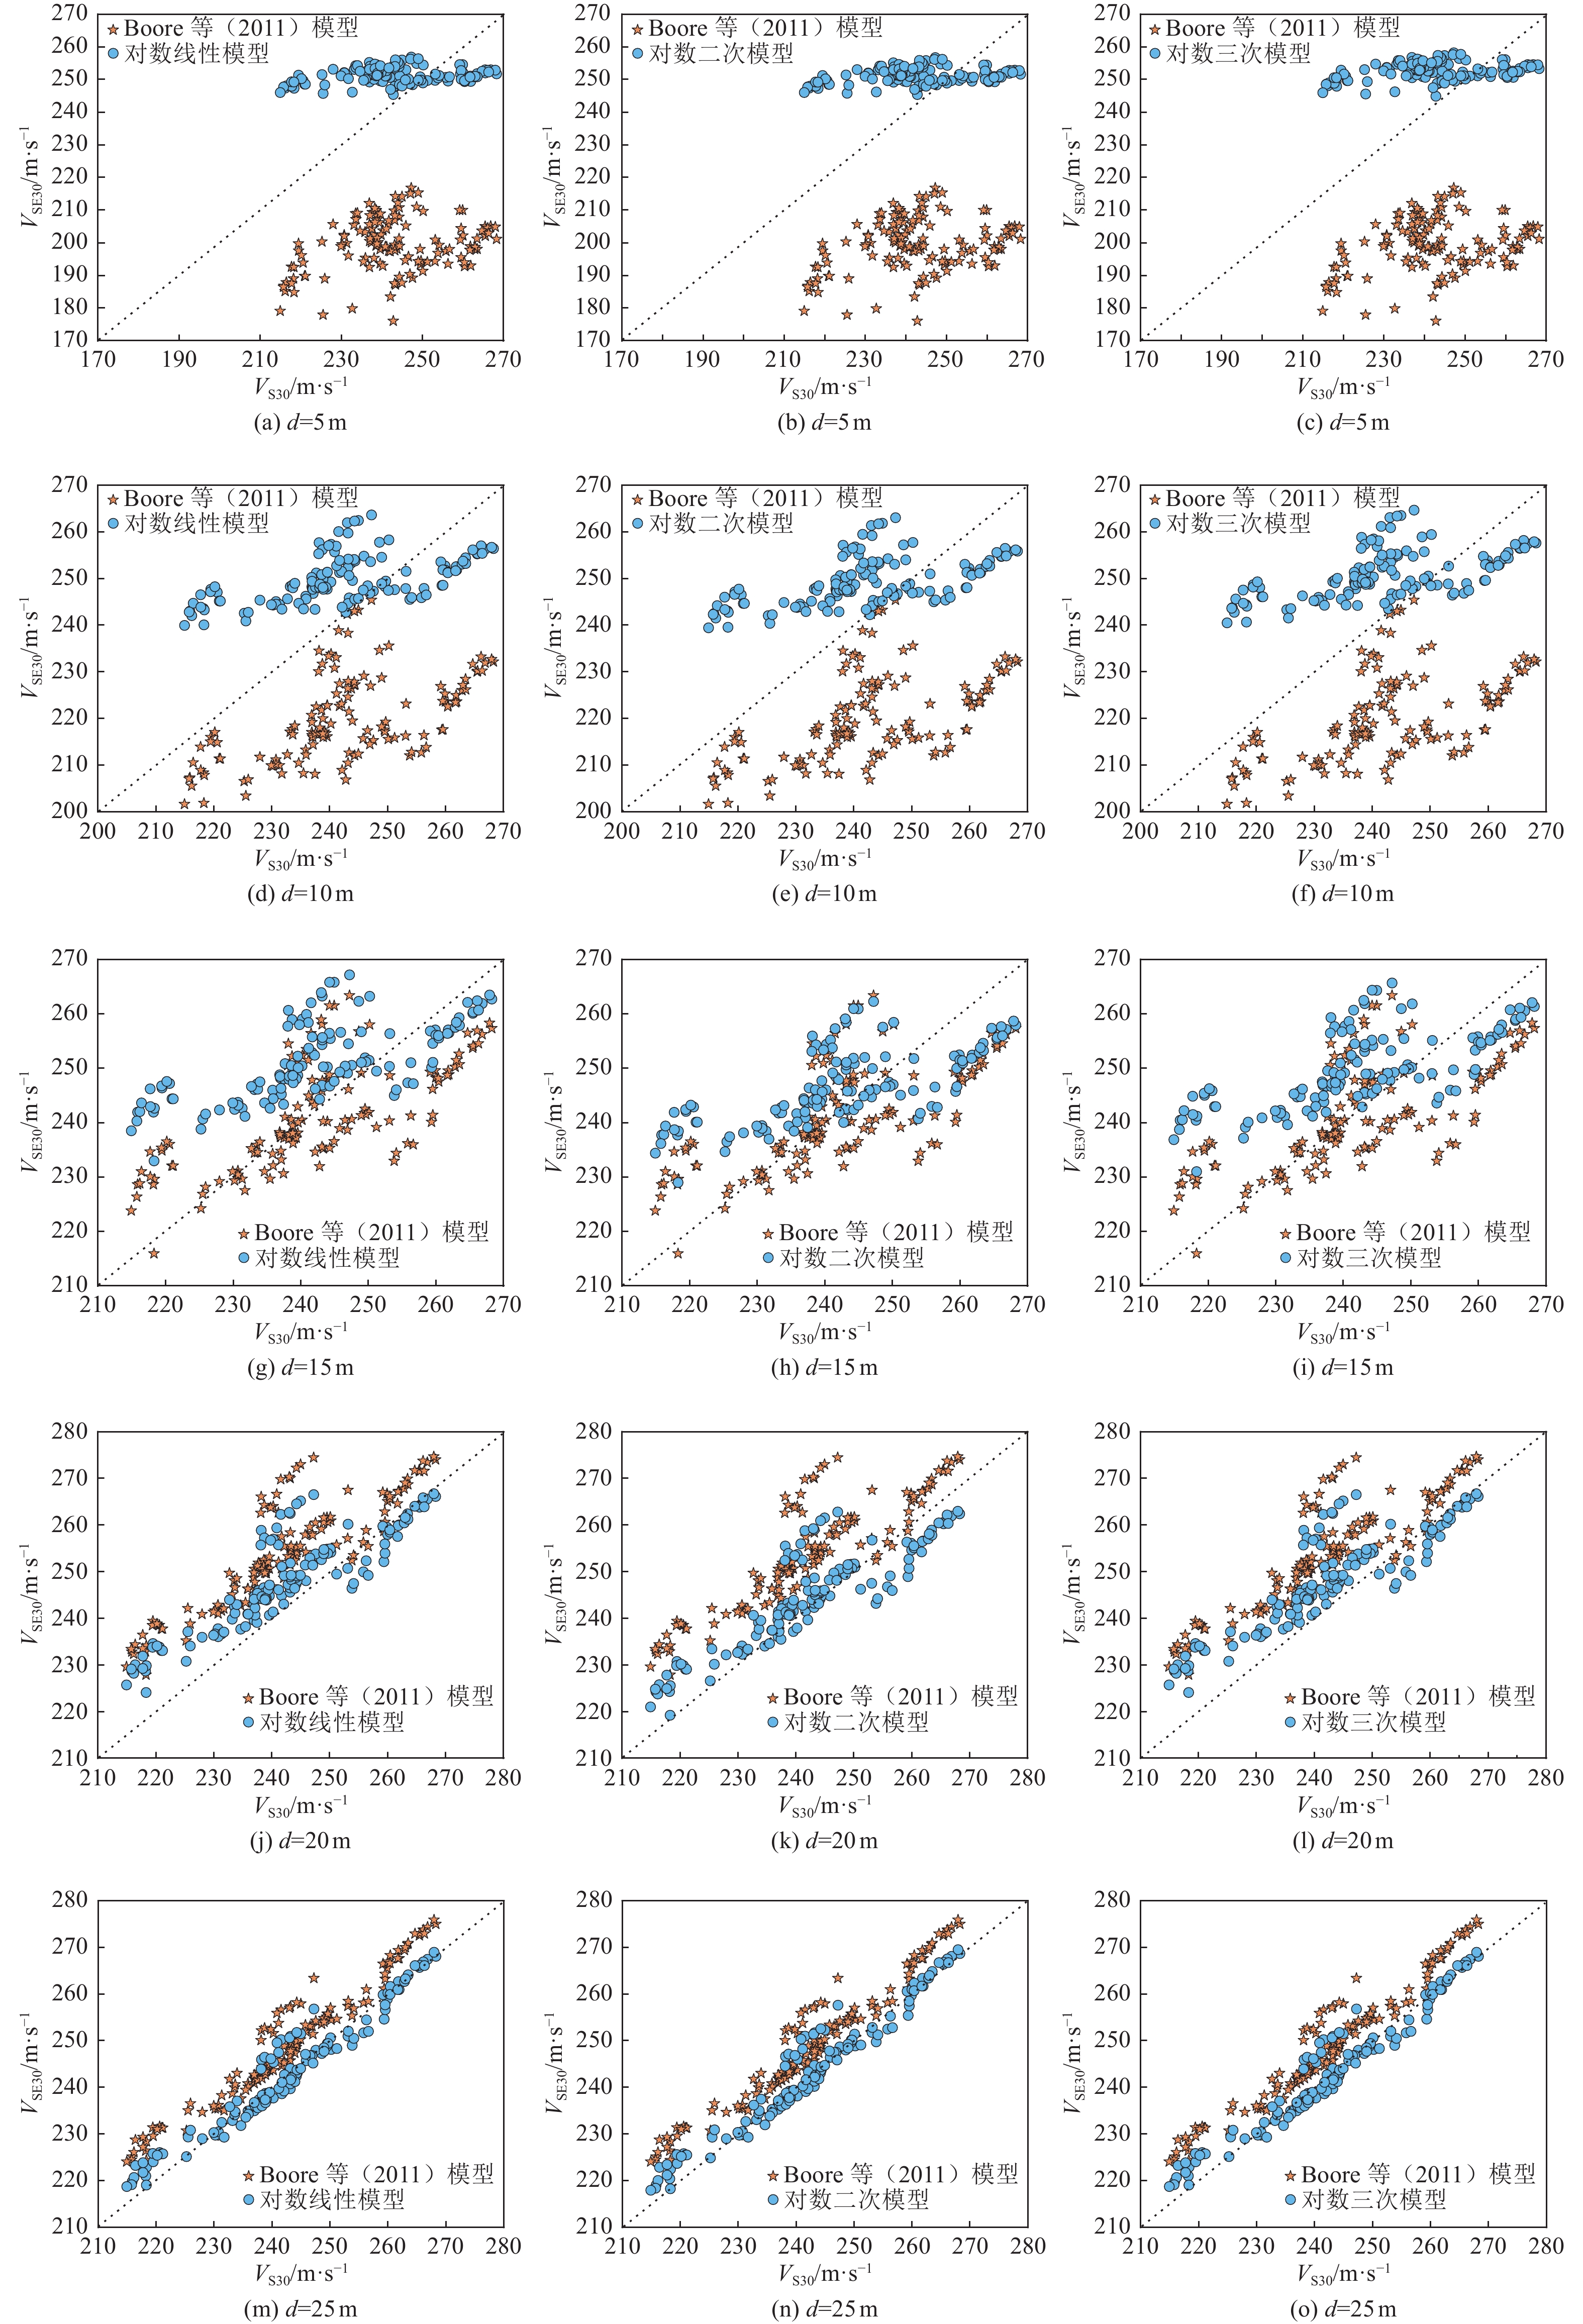
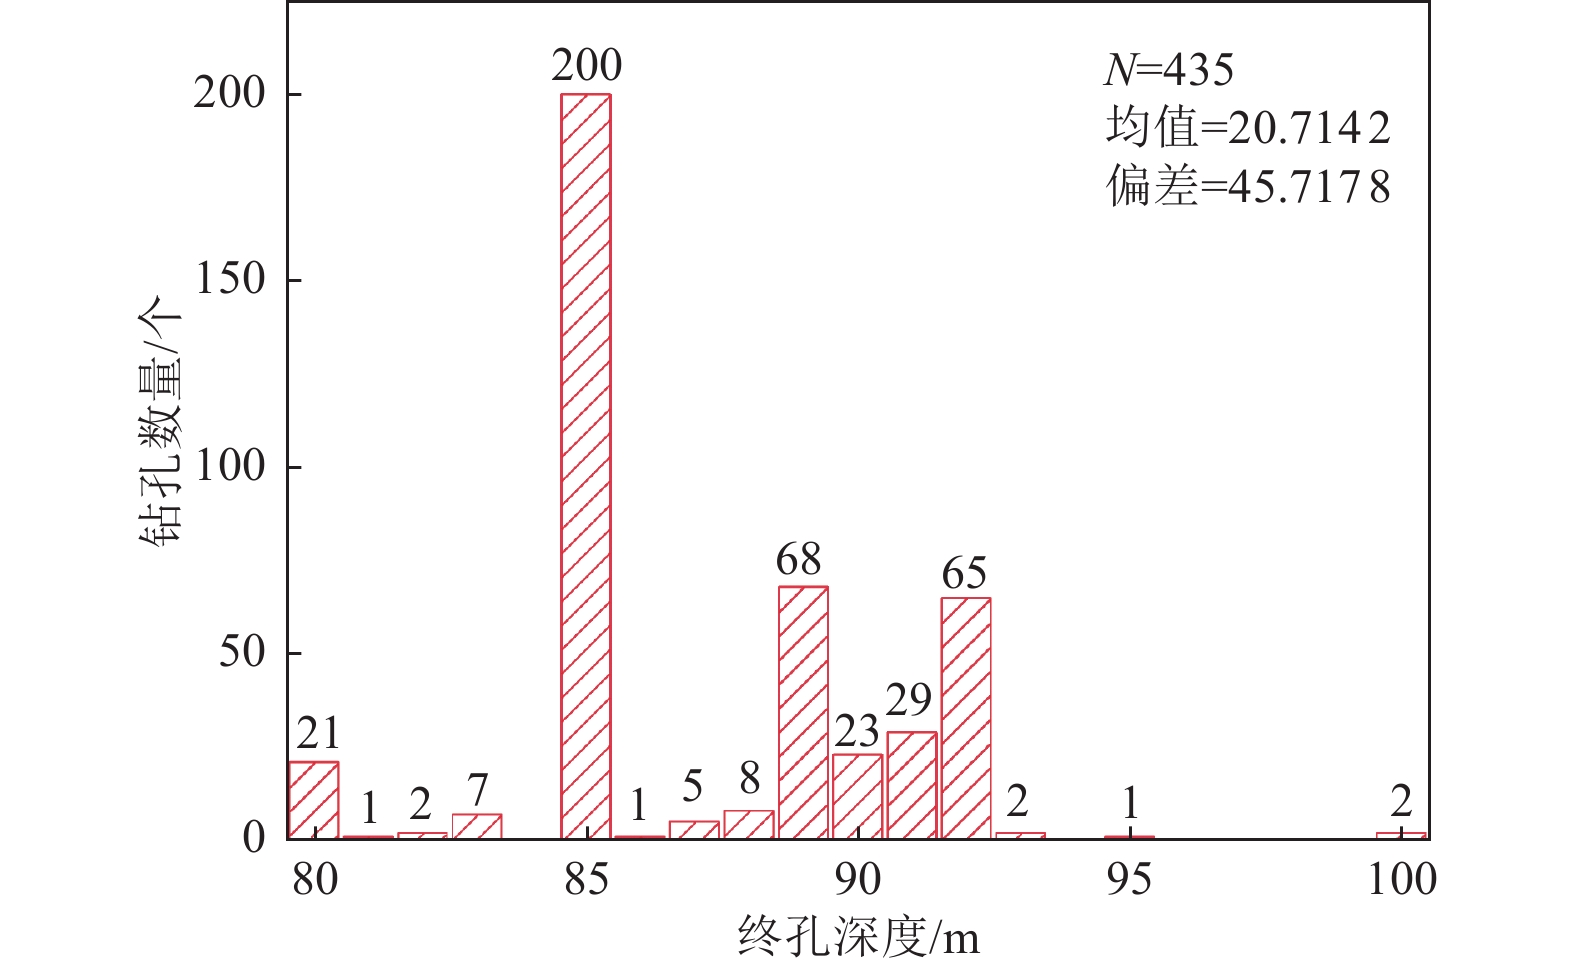
摘要: 本文基于雄安新区起步区区域性地震安全性评价工程435个钻孔剖面数据,选取其中300个钻孔剖面进行回归分析,利用剩余的135个钻孔剖面数据进行模型可靠性检验。研究结果表明,当钻孔剖面深度小于15 m时,Boore等模型明显低估了VS30;当深度小于10 m时,本研究中对数线性模型、对数二次模型、对数三次模型存在约3%的低估现象;对数三次模型相对误差、残差标准差均较小,因此,对数三次模型更适用于估算雄安新区缺乏钻孔资料或钻孔剖面深度未达30 m的 VS30。Abstract: In this paper, based on the data of 435 borehole profiles of the regional seismic safety evaluation project in the start-up area of Xiong’an New Area, 300 of the borehole profiles were selected for regression analysis, and the remaining 135 borehole profiles were used for model reliability testing. The results show that the Boore et al. model significantly underestimates VS30 when the borehole profile depth is less than 15 m; When the depth is less than 10 m, the log-linear model, log-quadratic model, and log-three model in this study have about 3% underestimation; the relative errors and standard deviations of residuals of the log-three model are smaller, therefore, the log-three model is more suitable for estimating VS30 in Xiong’an New Area where there is no borehole information or the depth of the borehole profile does not reach 30 m.
-
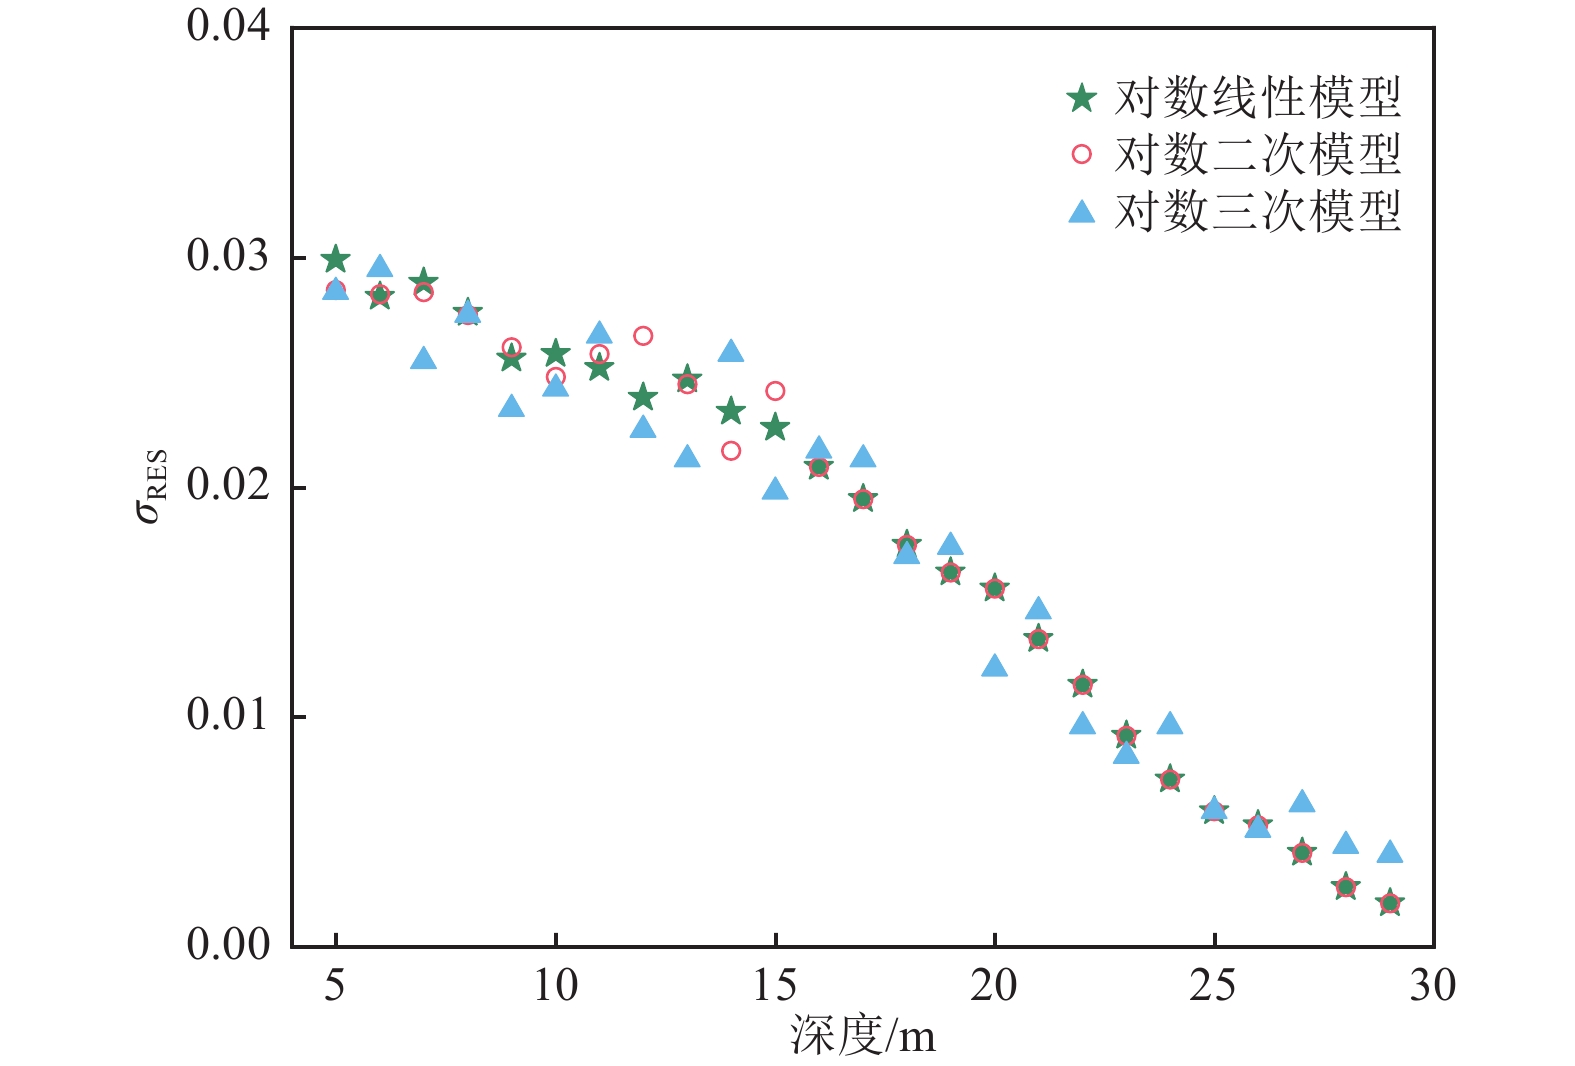
图 4 不同深度下3种模型残差标准差
Figure 4. The standard deviation of residuals of the three modles at different depths
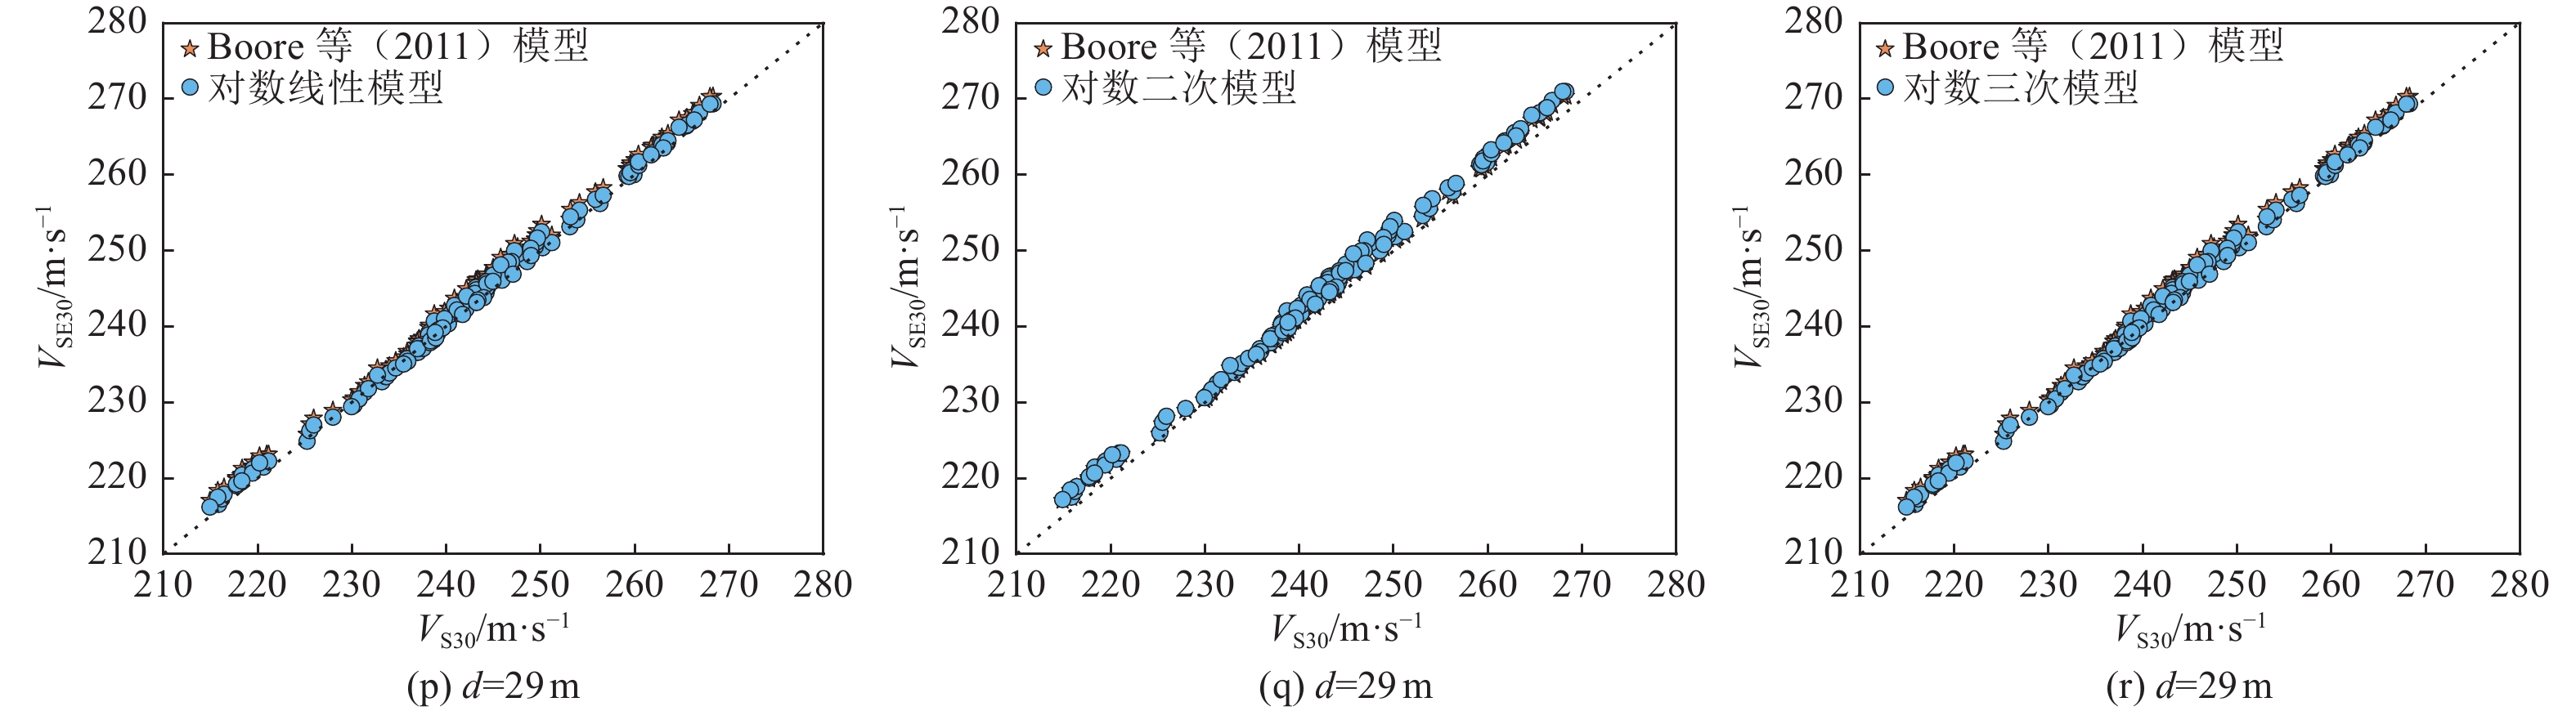
3 不同深度下3种模型与Boore等(2011)模型VSE30和VS30对比
3. Comparison of VSE30 and VS30 between the three models and the Boore model at different depths
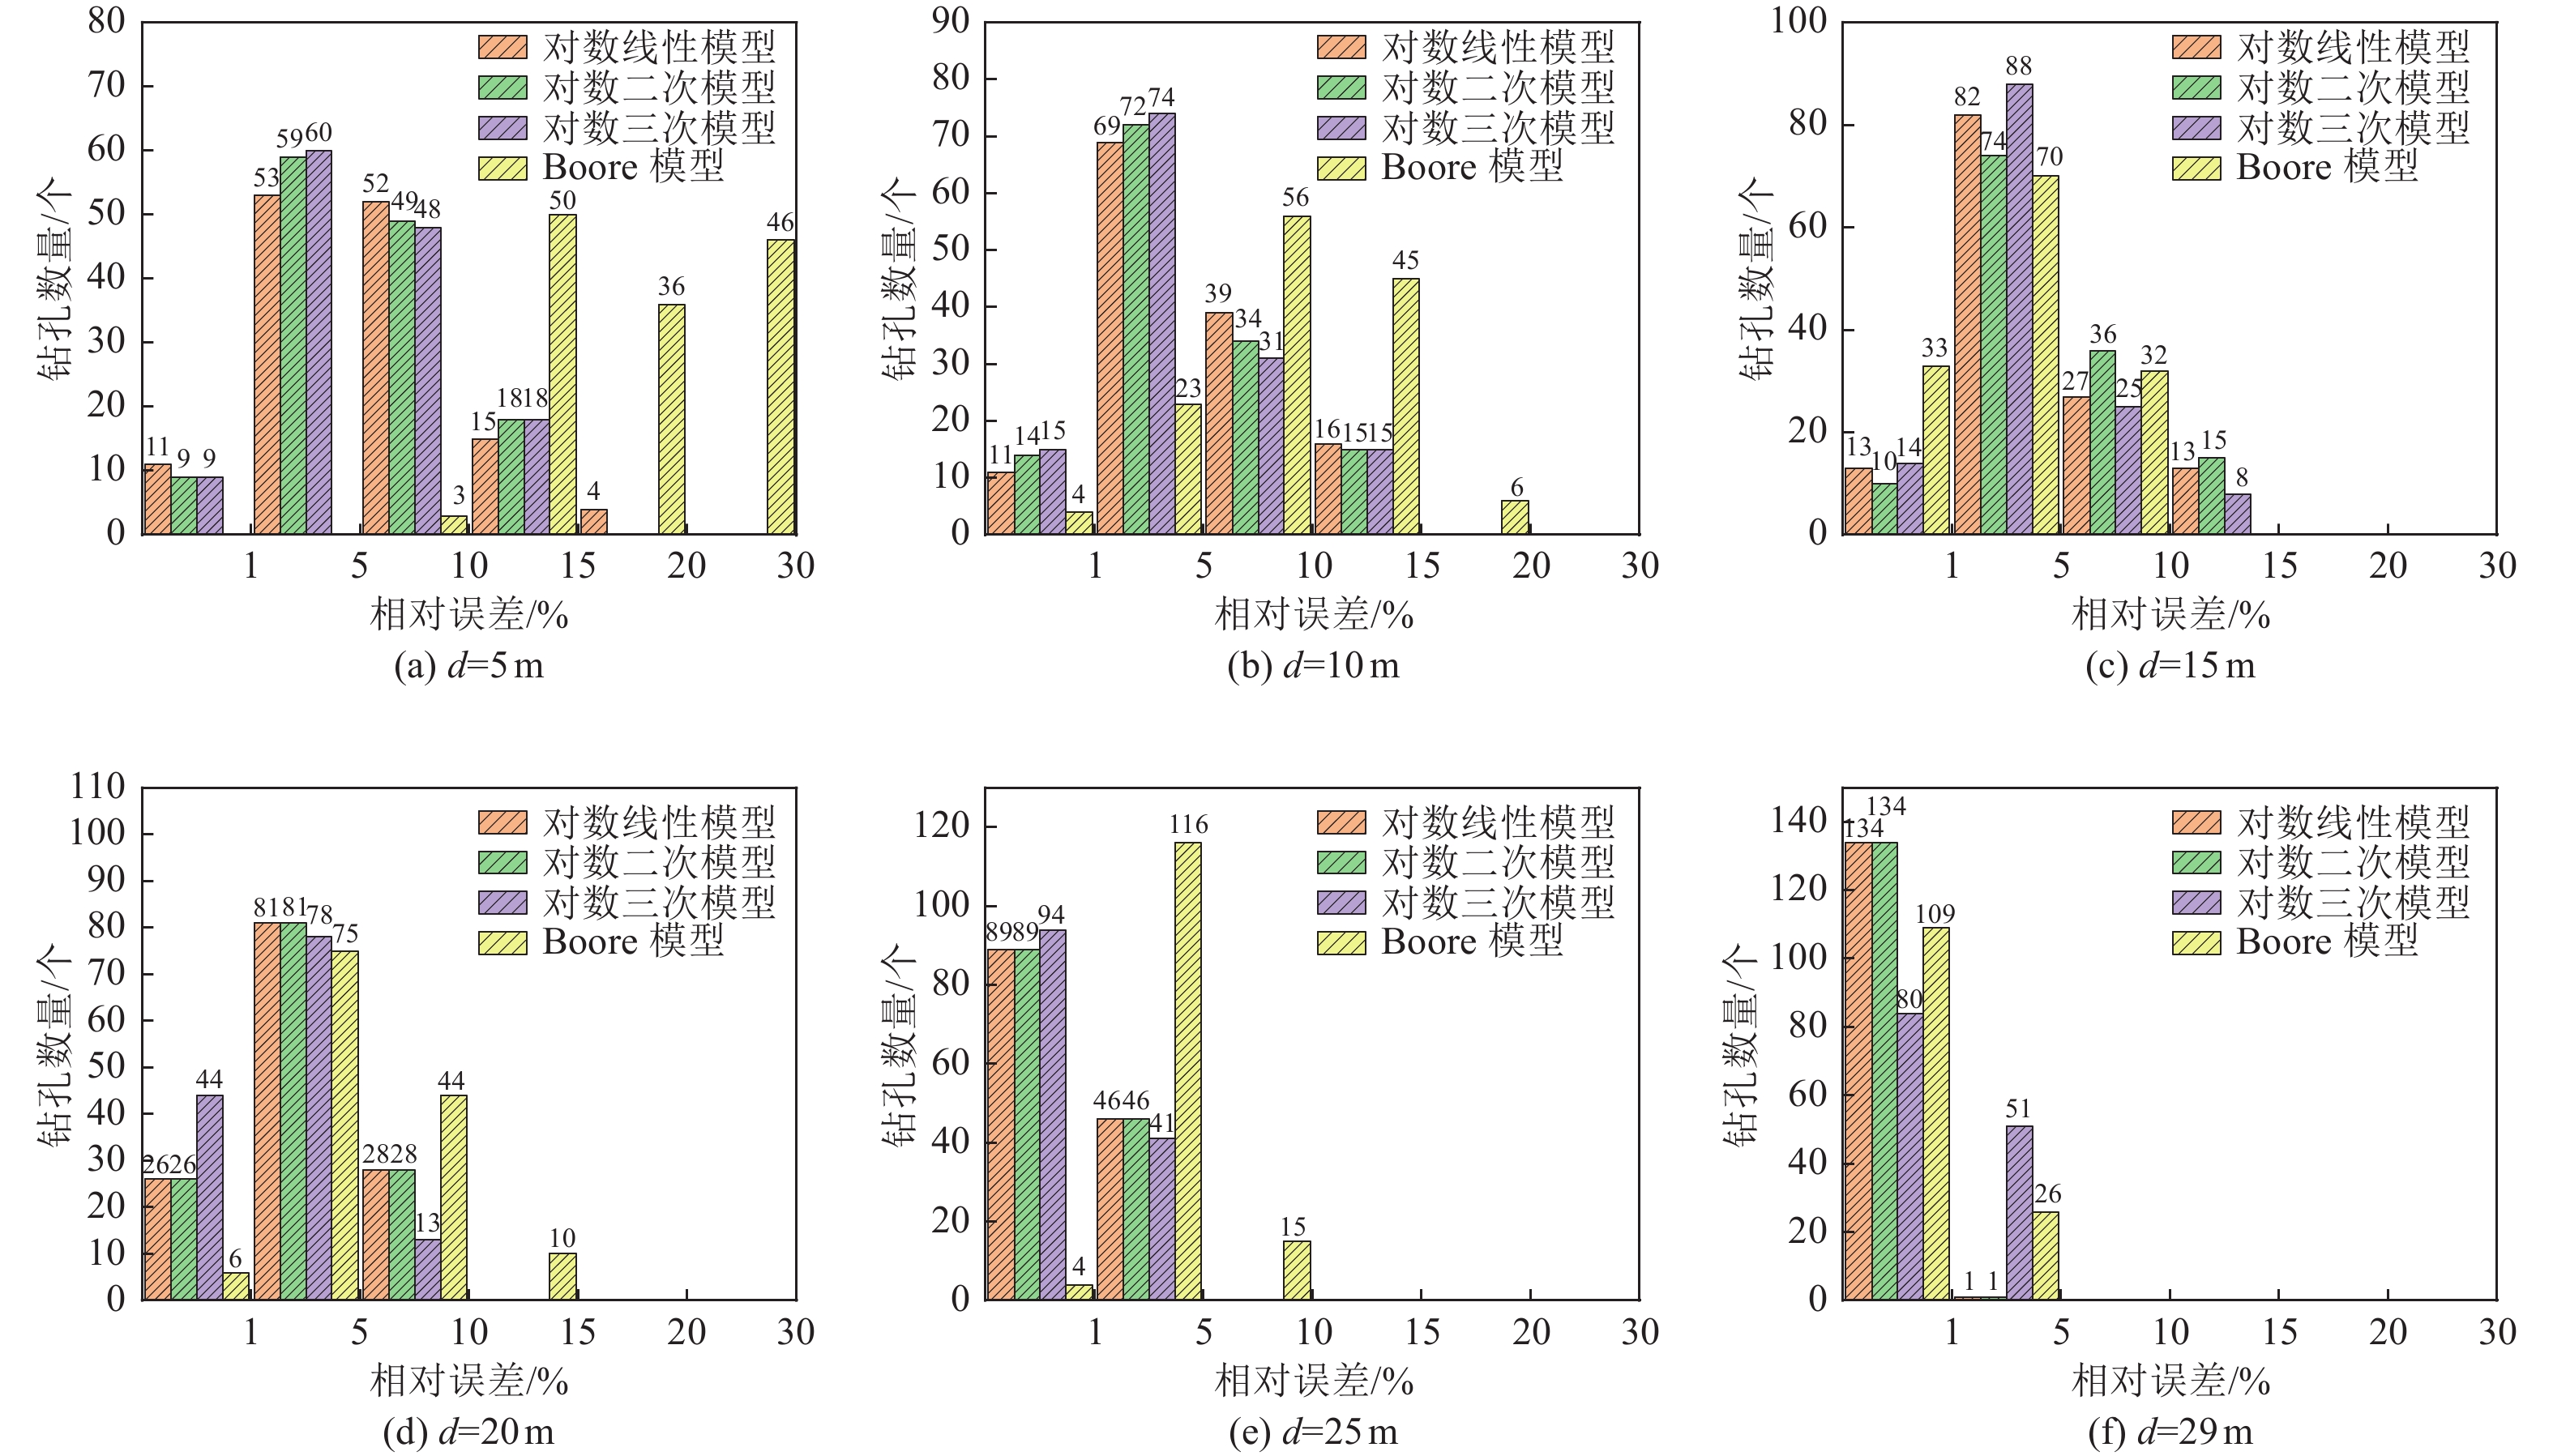
图 5 各估算模型相对误差柱状图
Figure 5. Histogram of the relative error of VSE30 estimated by each model
表 1 雄安新区钻孔VS30估算模型拟合系数
Table 1. The fitting coefficients of VS30 estimation models of boreholes in Xiong’an
深度z/m 对数线性模型 对数二次模型 对数三次模型 a b C0 C1 C2 C0 C1 C2 C3 5 2.014 0.176 4.072 −1.678 0.417 2.868 0 −0.361 0.120 6 1.903 0.224 3.772 −1.446 0.373 2.725 0 −0.292 0.102 7 1.799 0.270 2.904 −0.712 0.218 2.4 0 −0.117 0.052 8 1.696 0.314 2.756 −0.623 0.207 2.306 0 −0.080 0.044 9 1.571 0.367 2.507 −0.456 0.181 2.167 0 −0.023 0.030 10 1.446 0.421 2.661 −0.644 0.233 2.233 −0.097 0 0.033 11 1.341 0.465 2.281 −0.355 0.179 1.982 0 0.040 0.018 12 1.232 0.510 2.306 −0.422 0.203 1.938 0 0.044 0.019 13 1.110 0.562 2.749 −0.857 0.307 2.131 −0.102 0 0.041 14 0.993 0.610 3.385 −1.455 0.445 2.504 −0.368 0 0.061 15 0.848 0.671 2.979 −1.163 0.395 2.185 −0.193 0 0.053 16 0.707 0.729 0.707 0.729 0 0.625 0.781 0 −0.003 17 0.573 0.784 0.573 0.784 0 −0.920 1.741 0 −0.058 18 0.434 0.841 0.434 0.841 0 −2.146 2.491 0 −0.100 19 0.316 0.889 0.316 0.889 0 −2.572 2.732 0 −0.111 20 0.213 0.931 0.213 0.931 0 −4.102 3.676 0 −0.165 21 0.145 0.957 0.145 0.957 0 −4.795 4.093 0 −0.187 22 0.118 0.966 0.118 0.966 0 −4.923 4.159 0 −0.190 23 0.074 0.982 0.074 0.982 0 −4.518 3.885 0 −0.172 24 0.031 0.998 0.031 0.998 0 −3.77 3.396 0 −0.141 25 0.009 1.005 0.009 1.005 0 −2.751 2.743 0 −0.102 26 −0.004 1.009 −0.004 1.009 0 −2.073 2.309 0 −0.076 27 −0.004 1.007 −0.004 1.007 0 −0.758 1.480 0 −0.028 28 0.003 1.002 0.003 1.002 0 −0.307 1.196 0 −0.011 29 −0.007 1.005 −0.007 1.005 0 −0.291 1.182 0 −0.010  下载: 导出CSV
表 2 各估算模型相对误差(单位:%)
Table 2. Relative error range of each estimation model(Unit:%)
深度d/m 模型名称 对数线性模型 对数二次模型 对数三次模型 Boore模型 5 0.01~15.25 0~14.81 0.02~14.79 8.94~27.48 10 0.06~13.70 0~13.25 0.13~13.01 0.26~16.85 15 0.03~12.48 0.55~13.11 0.09~11.13 0.06~8.22 20 0.01~8.70 0.01~8.70 0.03~7.29 0.19~11.71 25 0.01~3.89 0.01~3.89 0.01~4.20 0.60~6.55 29 0~1.12 0.01~3.89 0.01~4.21 0.16~1.51
下载: 导出CSV
-
[1] 党鹏飞, 刘启方, 2019. 新疆乌鲁木齐地区vS30经验估计研究. 地震工程学报, 41(5): 1324—1331 doi: 10.3969/j.issn.1000-0844.2019.05.1324Dang P. F. , Liu Q. F. , 2019. Empirical estimation of vS30 in Urumqi area of Xinjiang. China Earthquake Engineering Journal, 41(5): 1324—1331. (in Chinese) doi: 10.3969/j.issn.1000-0844.2019.05.1324 [2] 胡进军, 姜治军, 谢礼立, 2018. 基于场地卓越周期的VS30估计方法研究——以川甘地区强震台站为例. 地震工程与工程振动, 38(3): 1—9Hu J. J, Jiang Z. J. , Xie L. L. , 2018. Estimation method of VS30 by using site period: a case study of strong motion stations in Sichuan and Gansu Province of China. Earthquake Engineering and Engineering Dynamics, 38(3): 1—9. (in Chinese) [3] 江志杰, 彭艳菊, 方怡等, 2018. 北京平原地区VS30估算模型适用性研究. 震灾防御技术, 13(1): 75—86 doi: 10.11899/zzfy20180107Jiang Z. J. , Peng Y. J. , Fang Y. , et al. , 2018. Applicability of VS30 estimation models for the Beijing plain area. Technology for Earthquake Disaster Prevention, 13(1): 75—86. (in Chinese) doi: 10.11899/zzfy20180107 [4] 刘培玄, 刘红帅, 赵纪生等, 2015. 基于KiK-net台站的中美场地类别对比分析. 地震工程与工程振动, 35(6): 42—46Liu P. X. , Liu H. S. , Zhao J. S. , et al. , 2015. Comparison of site classification between Chinese and American seismic codes based on data of Japanese KiK-net station. Earthquake Engineering and Engineering Dynamics, 35(6): 42—46. (in Chinese) [5] 王笃国, 尤红兵, 张合等, 2021. 海域不同类别场地地震动参数变化规律研究. 震灾防御技术, 16(1): 116—122 doi: 10.11899/zzfy20210112Wang D. G. , You H. B. , Zhang H. , et al. , 2021. Study on the change of earthquake ground motion parameters for different classification sites of ocean areas. Technology for Earthquake Disaster Prevention, 16(1): 116—122. (in Chinese) doi: 10.11899/zzfy20210112 [6] 喻畑, 李小军, 2015. 四川、甘肃地区VS30经验估计研究. 地震工程学报, 37(2): 525—533 doi: 10.3969/j.issn.1000-0844.2015.02.0525Yu T. , Li X. J. , 2015. Empirical estimation of VS30 in the Sichuan and Gansu Provinces. China Earthquake Engineering Journal, 37(2): 525—533. (in Chinese) doi: 10.3969/j.issn.1000-0844.2015.02.0525 [7] 张龙飞, 董斌, 史琳娜, 2020. 基于典型地质特征分析的大同盆地VS30预测研究. 震灾防御技术, 15(1): 102—113 doi: 10.11899/zzfy20200110Zhang L. F. , Dong B. , Shi L. N. , 2020. Study on VS30 prediction of Datong basin based on the analysis of typical geological characteristics. Technology for Earthquake Disaster Prevention, 15(1): 102—113. (in Chinese) doi: 10.11899/zzfy20200110 [8] 中华人民共和国住房和城乡建设部, 中华人民共和国国家质量监督检验检疫总局, 2010. GB 50011-2010 建筑抗震设计规范. 北京: 中国建筑工业出版社.Ministry of Housing and Urban-Rural Development of the People’s Republic of China, General Administration of Quality Supervision, Inspection and Quarantine of the People's Republic of China, 2010. GB 50011—2010 Code for seismic design of buildings. Beijing: China Architecture & Building Press. [9] Boore D. M. , 2004. Estimating $ \bar{V}_{A}(30) $ (or NEHRP Site Classes) from shallow velocity models (Depth < 30 m). Bulletin of the Seismological Society of America, 94(2): 591—597. doi: 10.1785/0120030105[10] Boore D. M. , Thompson E. M. , Cadet H. , 2011. Regional correlations of VS30 and velocities averaged over depths less than and greater than 30 meters. Bulletin of the Seismological Society of America, 101(6): 3046—3059. doi: 10.1785/0120110071 [11] Cadet H. , Duval A. M. , 2009. A Shear wave velocity study based on the Kik-net borehole data: a short note. Seismological Research Letters, 80(3): 440—445. doi: 10.1785/gssrl.80.3.440 [12] Dai Z. J. , Li X. J. , Hou C. L. , 2013. A shear-wave velocity model for VS30 estimation based on a conditional independence property. Bulletin of the Seismological Society of America, 103(6): 3354—3361. doi: 10.1785/0120130025 [13] Hassani B. , Atkinson G. M. , 2016. Applicability of the site fundamental frequency as a VS30 proxy for central and eastern North America. Bulletin of the Seismological Society of America, 106(2): 653—664. doi: 10.1785/0120150259 [14] Federal Emergency Management Agency, 2015. NEHRP recommended seismic provisions for new buildings and other structures (2015 edition). Washington D C: Building Seismic Safety Council, 14. [15] Wang H. Y. , Wang S. Y. , 2015. A new method for estimating VS(30) from a shallow shear-wave velocity profile (depth < 30 m). Bulletin of the Seismological Society of America, 105(3): 1359—1370. doi: 10.1785/0120140103 [16] Xie J. J. , Zimmaro P. , Li X. J. , et al. , 2016. VS30 empirical prediction relationships based on a new soil-profile database for the Beijing plain area, China. Bulletin of the Seismological Society of America, 106(6): 2843—2854. doi: 10.1785/0120160053 [17] Zhao J. X. , Xu H. , 2013. A comparison of VS30 and site period as site-effect parameters in response spectral ground-motion prediction equations. Bulletin of the Seismological Society of America, 103(1): 1—18. doi: 10.1785/0120110251 -


 点击查看大图
计量
- 文章访问数: 431
- HTML全文浏览量: 60
- PDF下载量: 33
- 被引次数: 0
