
Accuracy Assessment of UAV Photogrammetry in High-Relief Area−A Case Study from Guanggaishan-Dieshan Fault in West Qinling Mountain
-
摘要: 经过近10年的迅速发展,无人机摄影测量已成为活动构造研究的常用方法之一。但对于无人机摄影测量的精度评估,尤其是高起伏地区的精度评估存在不足。为此,选择白龙江北岸光盖山-迭山断裂沿线的黑峪寺、化马村,开展无人机摄影测量,并构建正射影像(DOM)和数字地表模型(DSM),配合差分GPS测绘进行校正和精度验证。通过对比实测控制点和图像提取点分析点精度,通过对比实测剖面与提取剖面分析剖面精度。研究结果表明,未经控制点校正的图像提取点与实测点存在较大误差,水平误差为5~8 m,垂直误差为几十米至上百米,但通过少数控制点校正后,点精度可达20 cm以内;6条实测剖面与提取剖面(提取自控制点校正后的图像)平均垂直精度总体为分米级,即0.16~0.65 m,标准差为0.13~0.69 m,略低于低起伏区的精度,对于测量条件恶劣的高起伏区,该精度是可接受的;异常高的垂直误差常出现在地形突变、低矮植被密集、行走困难等测量条件不理想位置。图像控制点中心点的准确识别、提取剖面线的修正准确性等因素也会影响精度评估的可靠性。Abstract: After ~10 years of rapid development, unmanned aerial vehicle (UAV) photogrammetry has become one of the conventional methods for active tectonics research. However, there are deficiencies in the accuracy assessment of UAV Photogrammetry, especially in high relief areas. To make up for this defect, we carried out UAV photogrammetry at two sites of Heiyusi and Huama Village along the Guanggaishan-Dieshan fault to construct ortho-images (DOM) and the digital surface model (DSM), and differential-GPS (DGPS) measurement was used for topographic correction and accuracy assessment. The point accuracy was analyzed by comparing DGPS points with image extraction points; the profile accuracy was analyzed by comparing the DGPS profiles with the extracted profiles. The research results show that there is a large error between the image-extraction points (uncorrected) and the DGPS points, the horizontal error is 5~8 m, and the vertical error is tens of meters to hundreds of meters, but after correction by a few control points, the point accuracy of the DOM and DSM can reach within 20 cm, the average vertical error between six DGPS profiles and extracted profiles (extracted from corrected DSM) is generally at the decimeter level, that is, 0.16~0.65 m, with a standard deviation of 0.13~0.69 m, this accuracy is slightly lower than that in the low relief areas, which is acceptable for the high relief areas with harsh measurement conditions; abnormally high vertical errors often occur in areas with unsatisfactory measurement conditions such as terrain abrupt changes, dense low vegetation, and difficulty in walking, etc. In addition, factors such as the identification error of the centre of the control point, and the correction error of the extracted profile would also affect the accuracy assessment work.
-
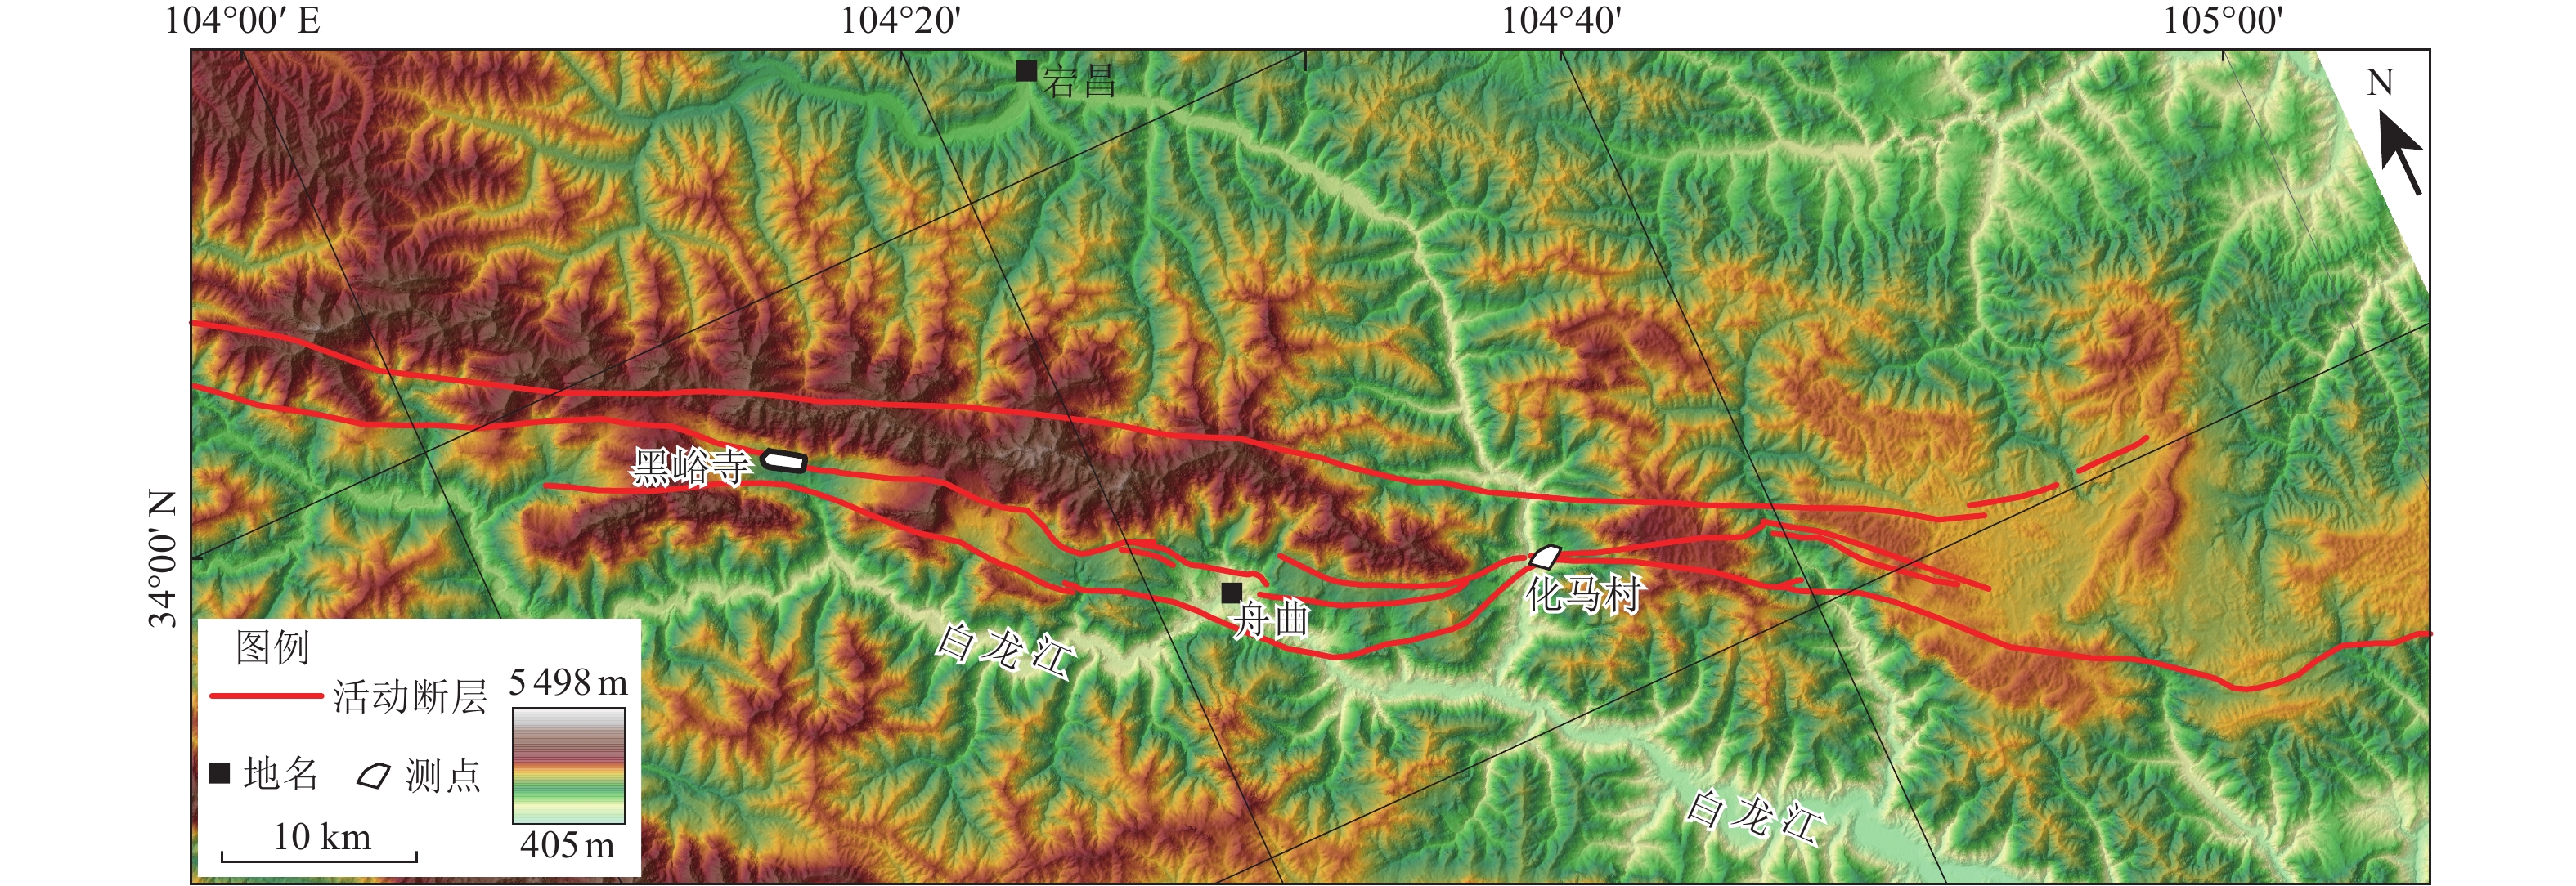
图 1 西秦岭白龙江流域地形地貌及测点分布
Figure 1. Topography and measure sites distribution in Bailongjiang watershed, West Qinling
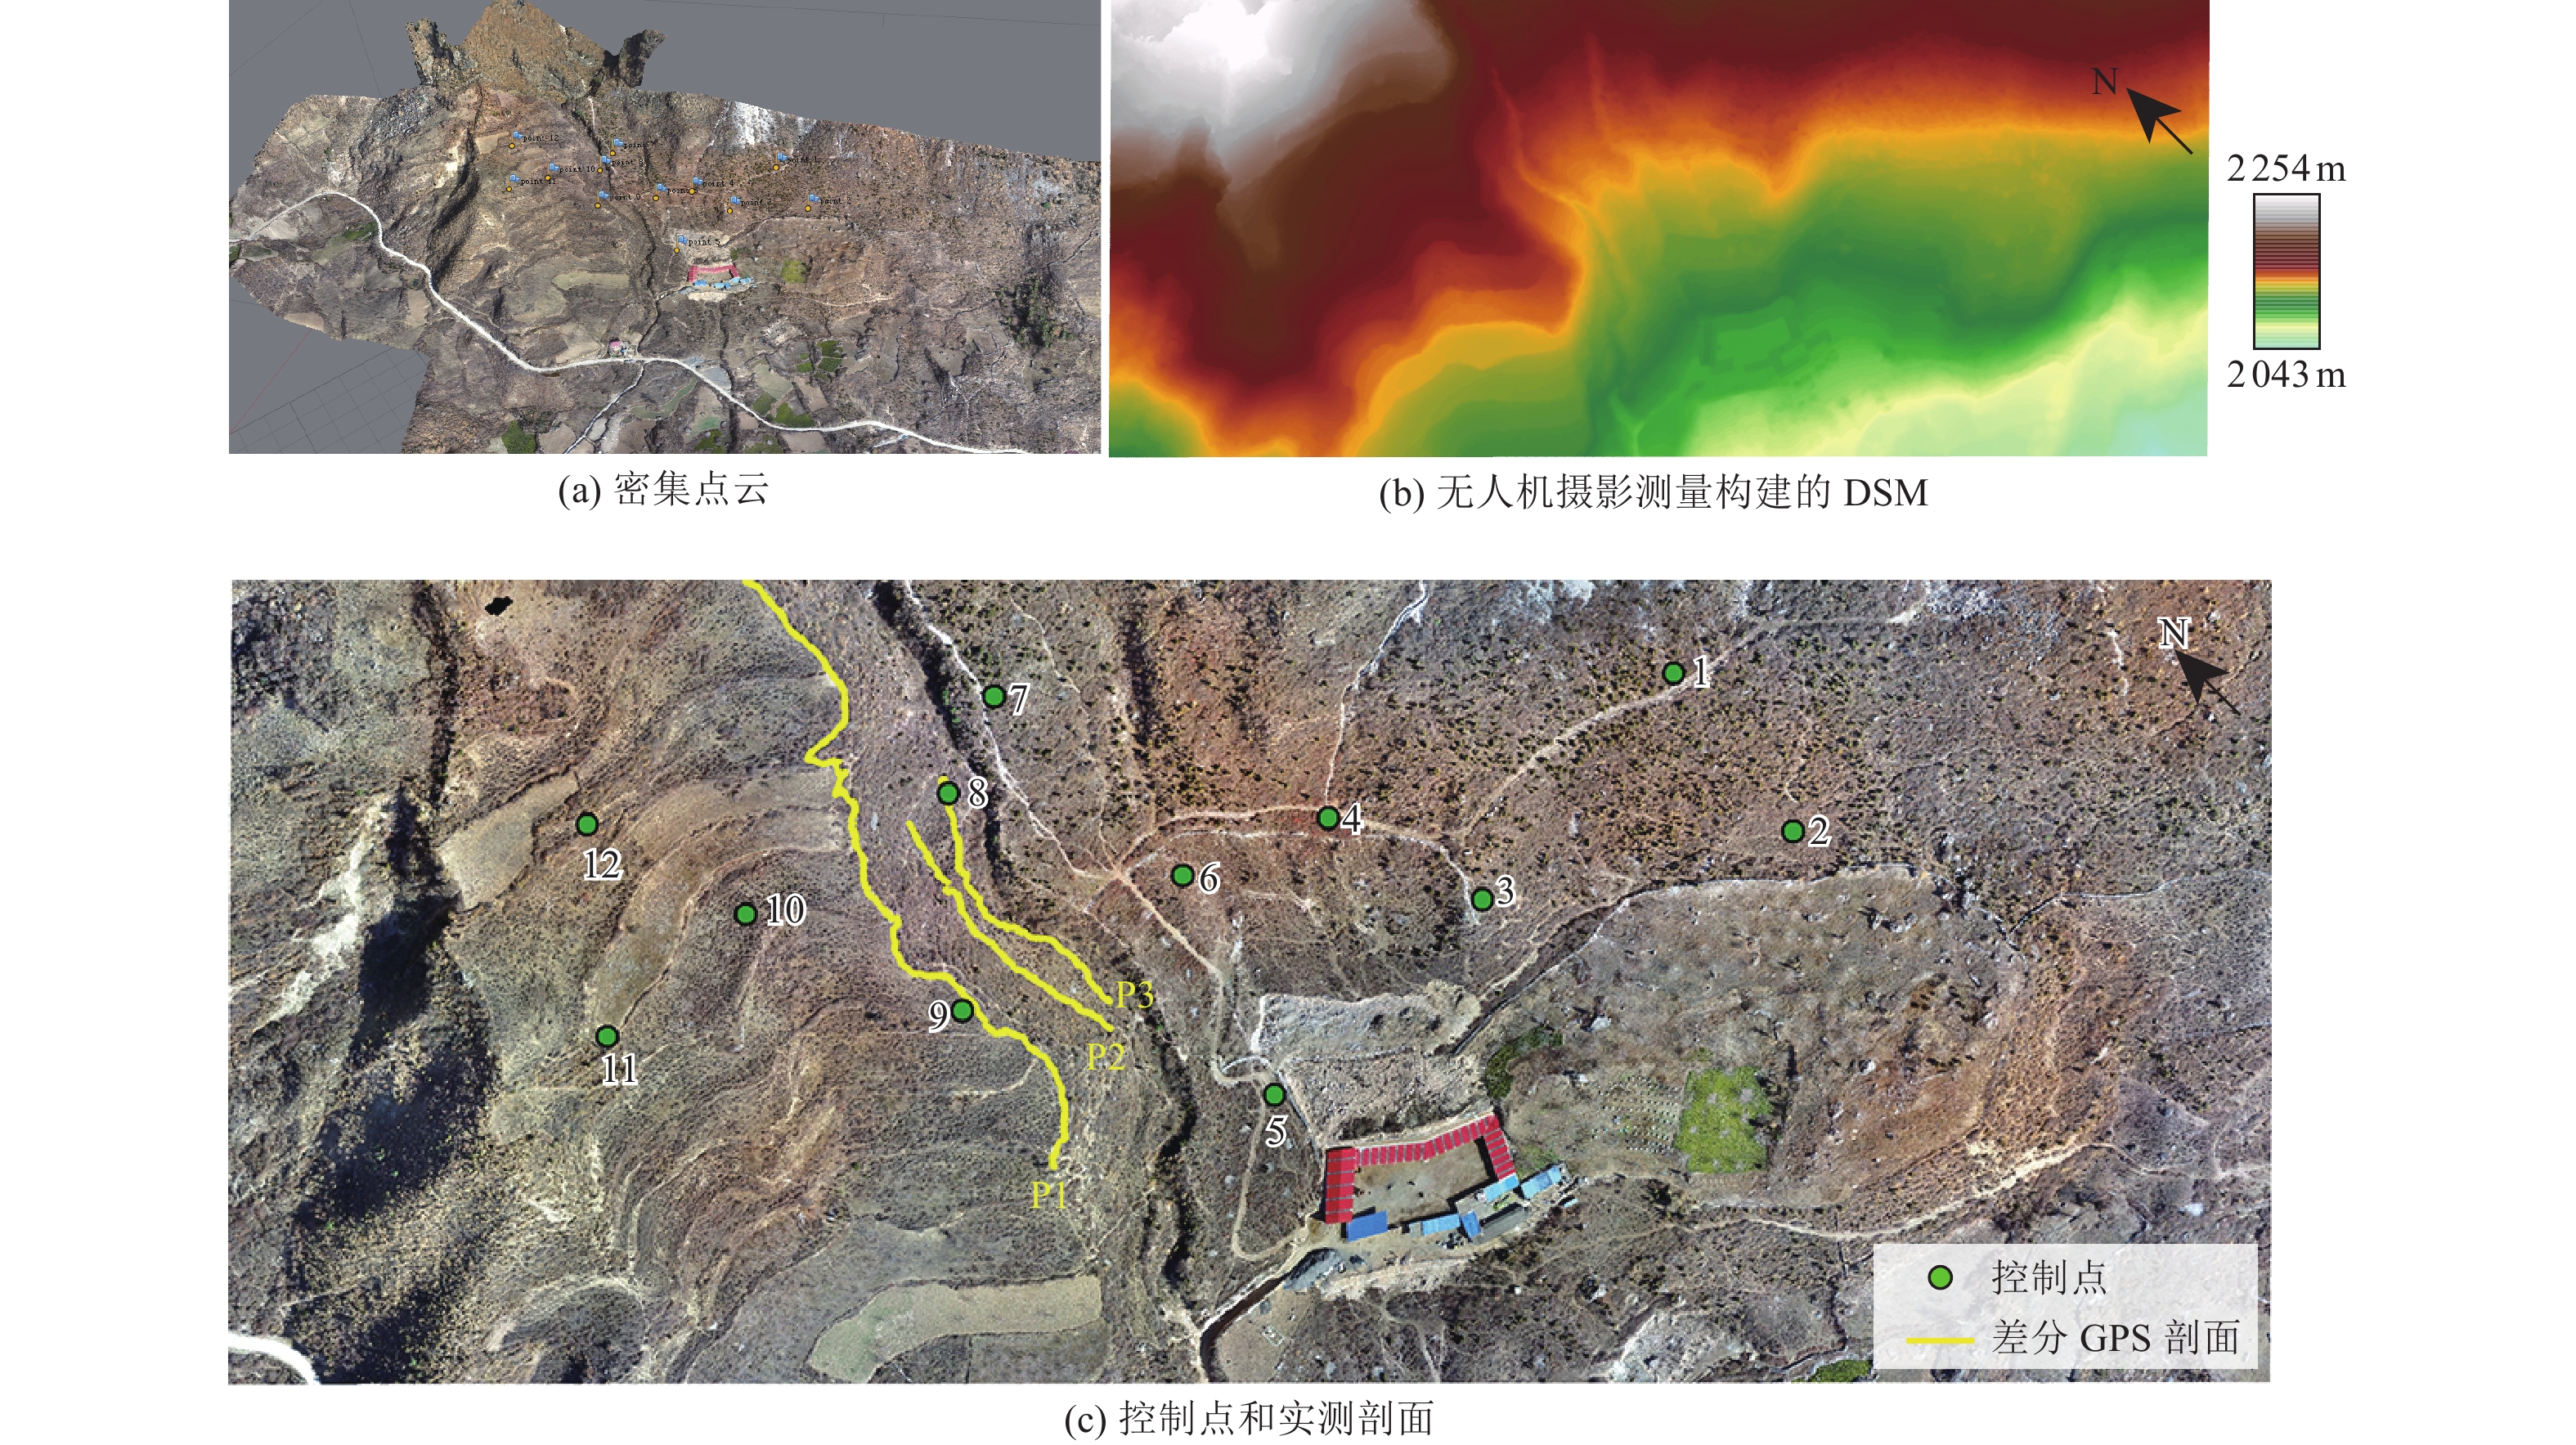
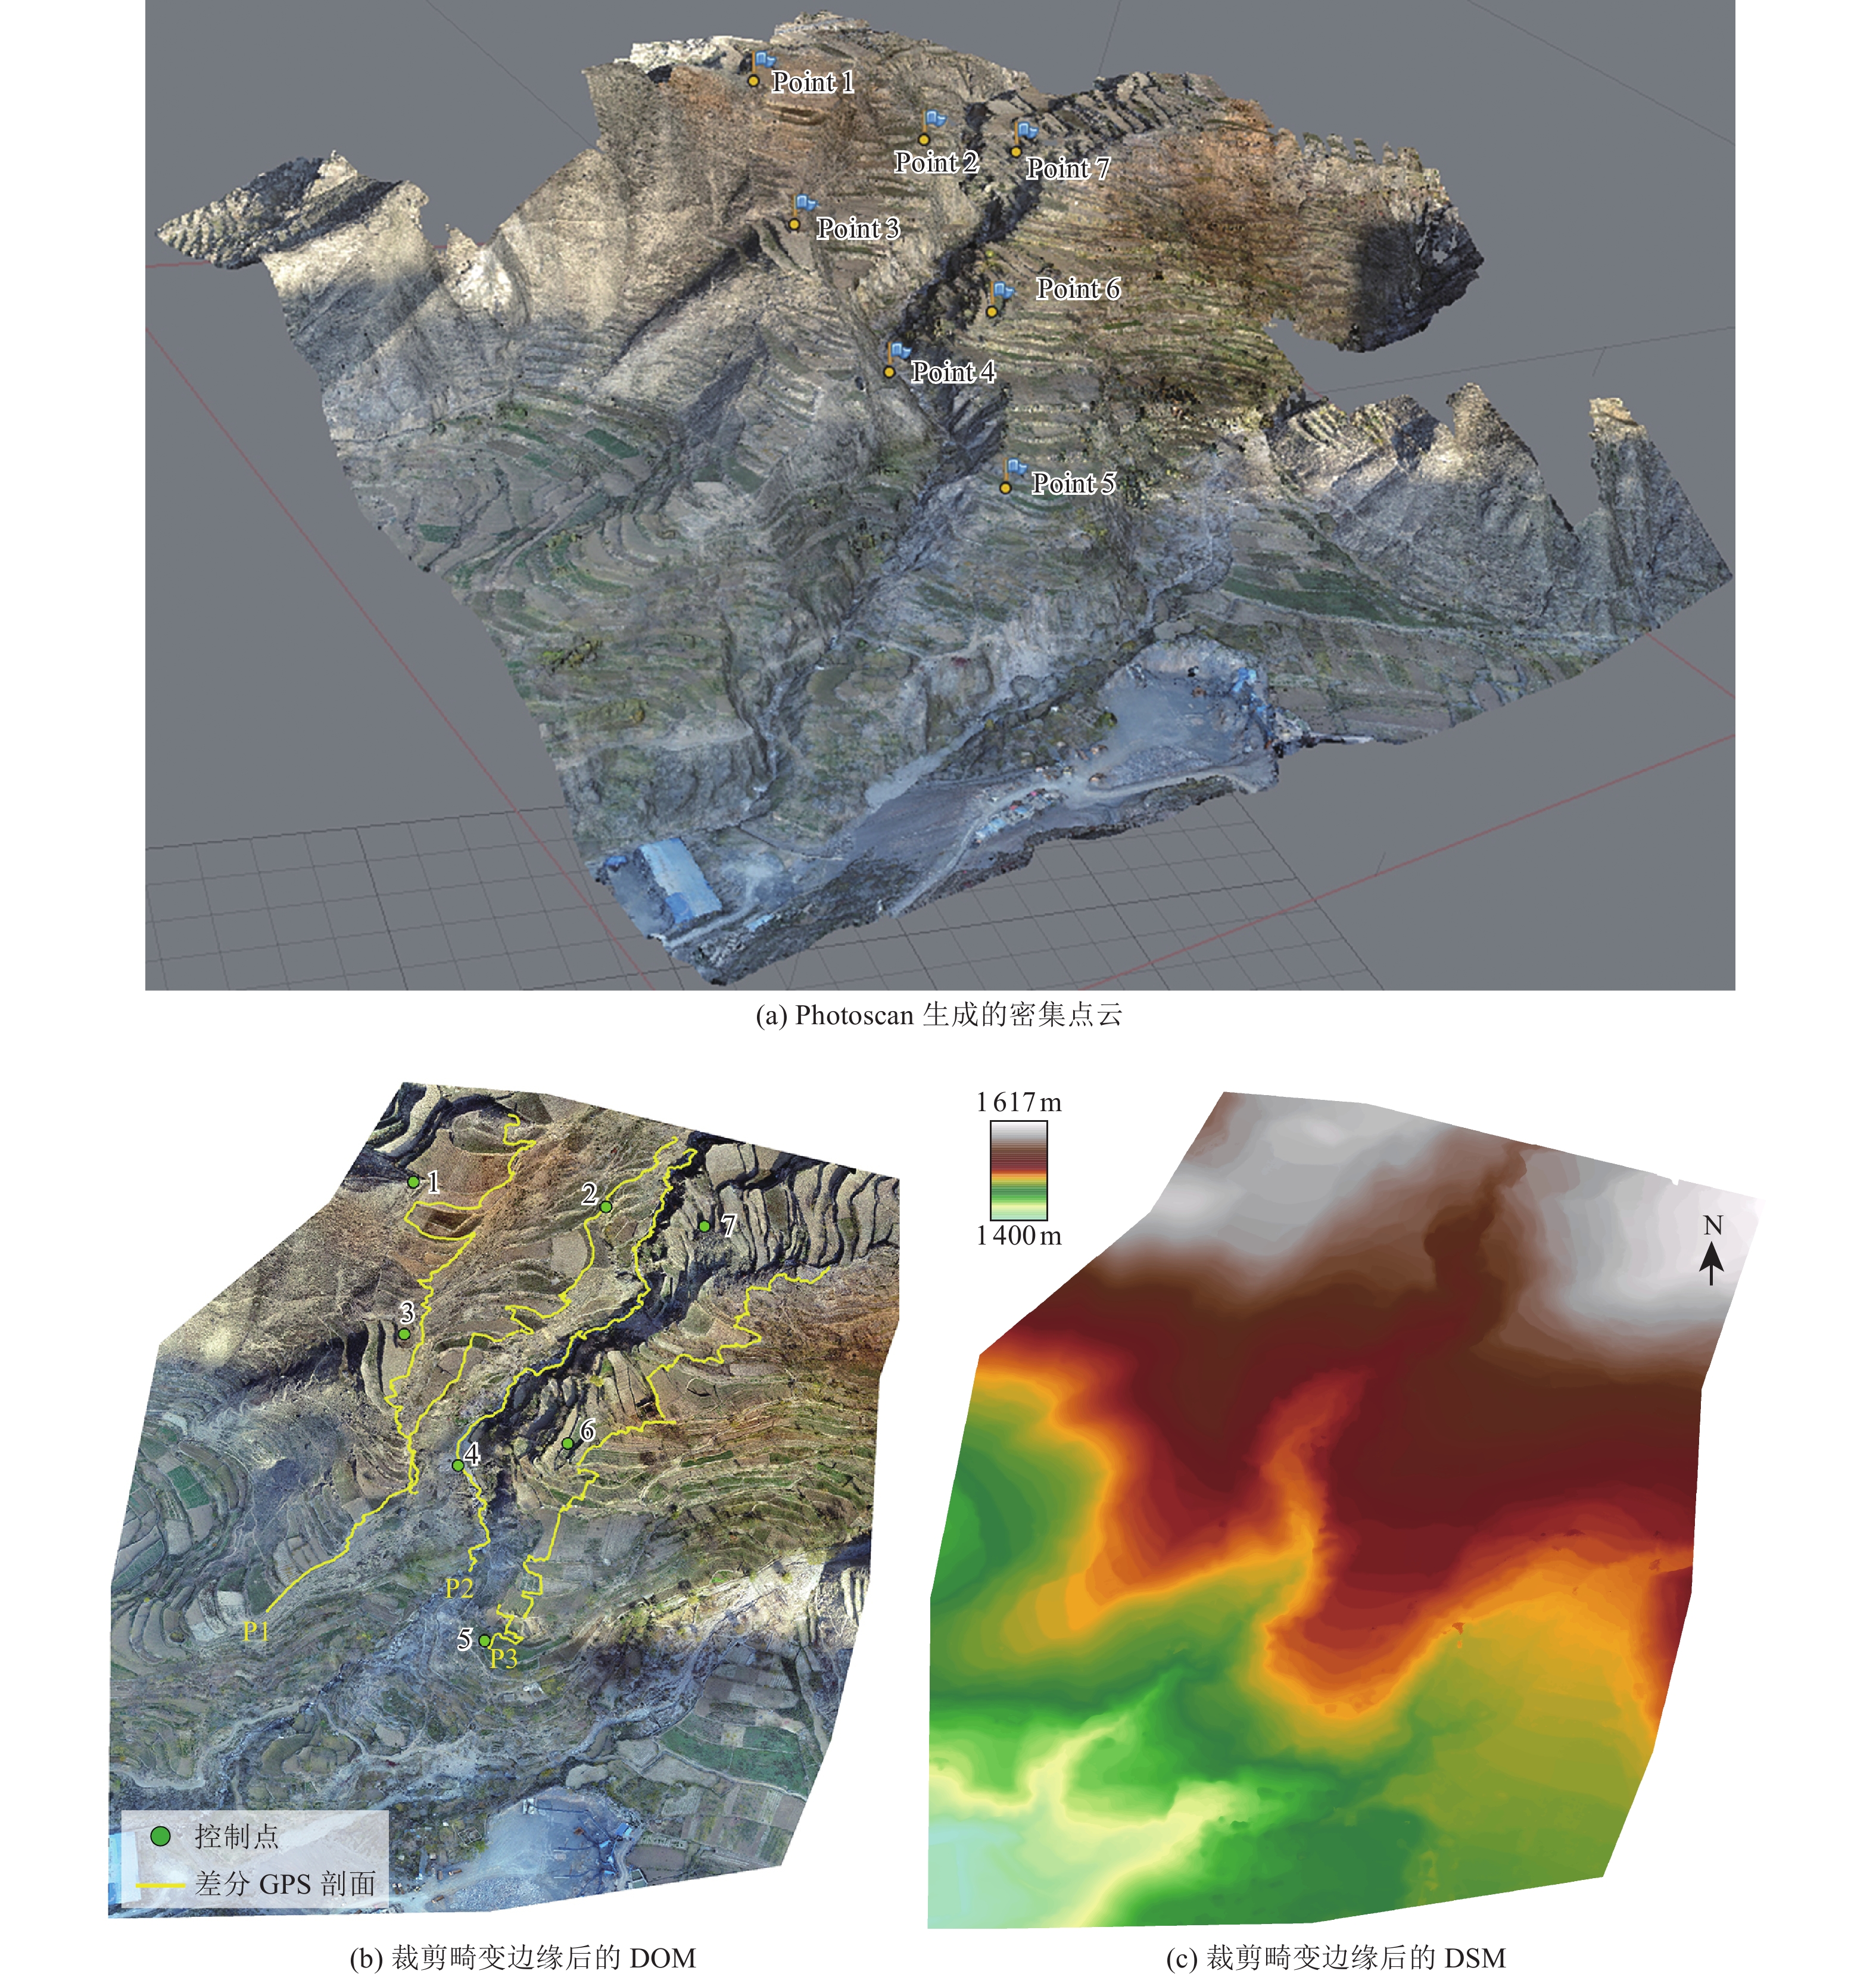
图 3 黑峪寺无人机摄影测量构建的DOM和DSM
Figure 3. DOM and DSM of Heiyusi site constructed by UAV Photogrammetry
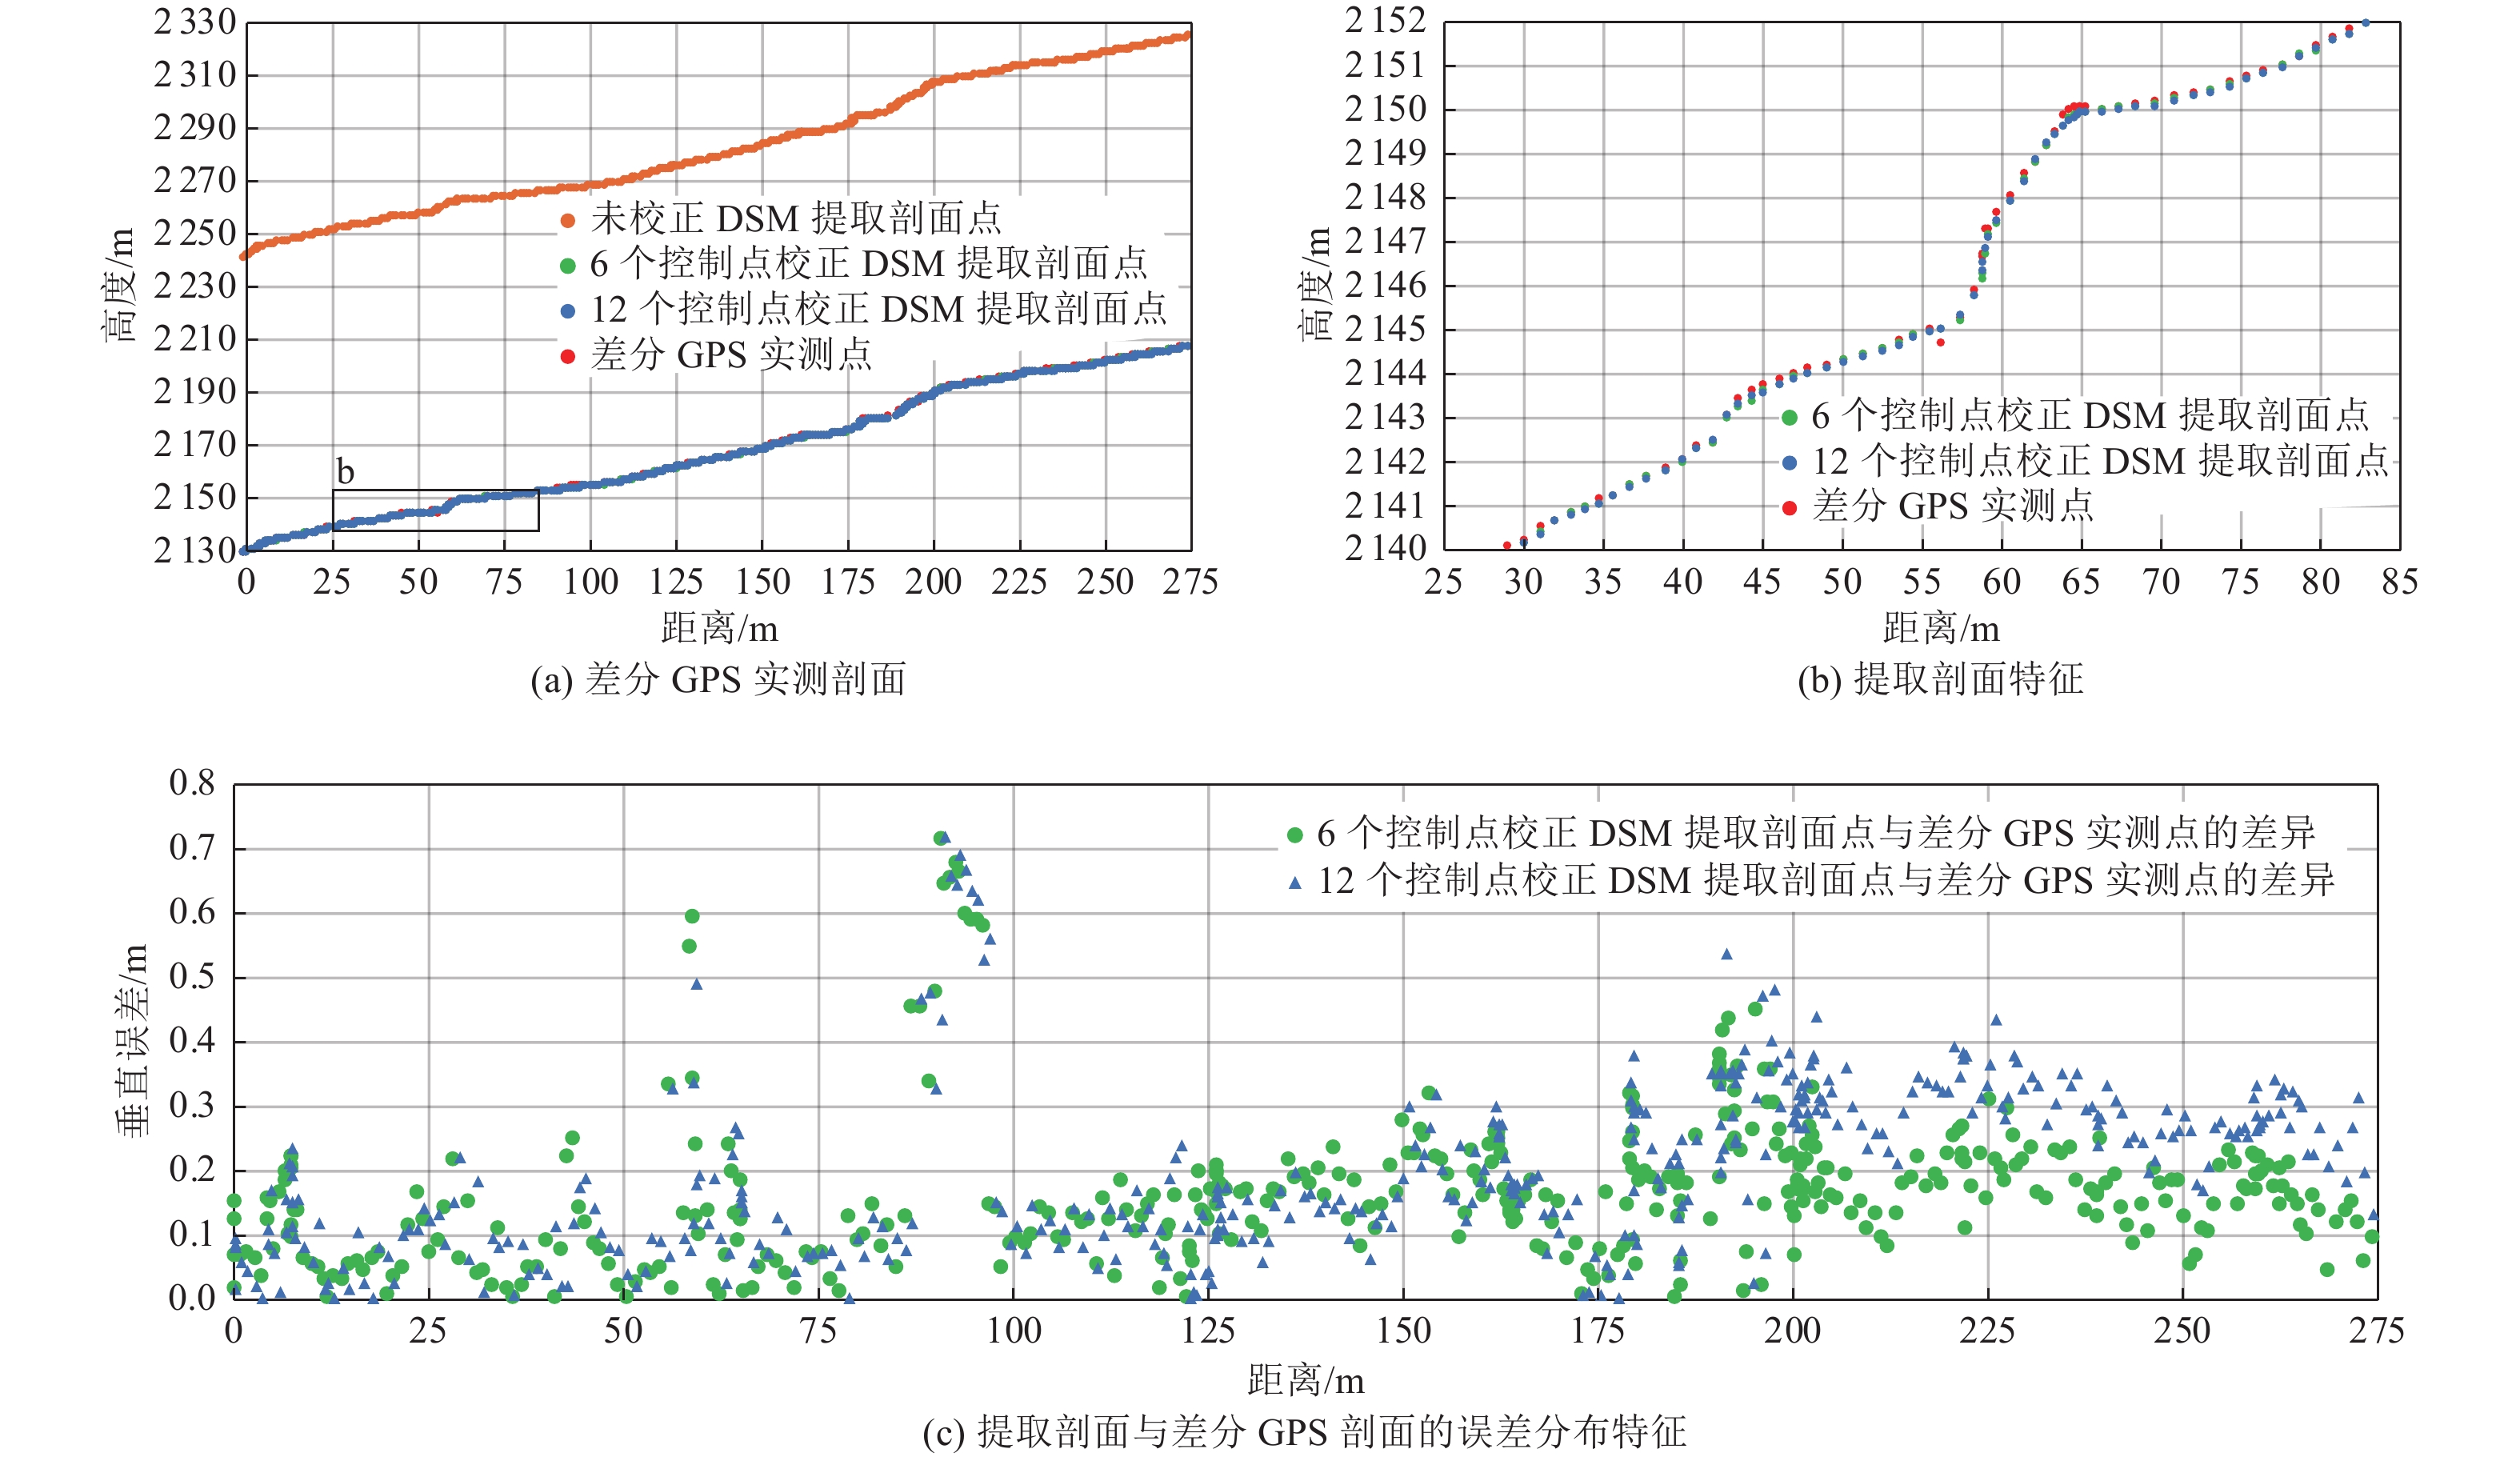
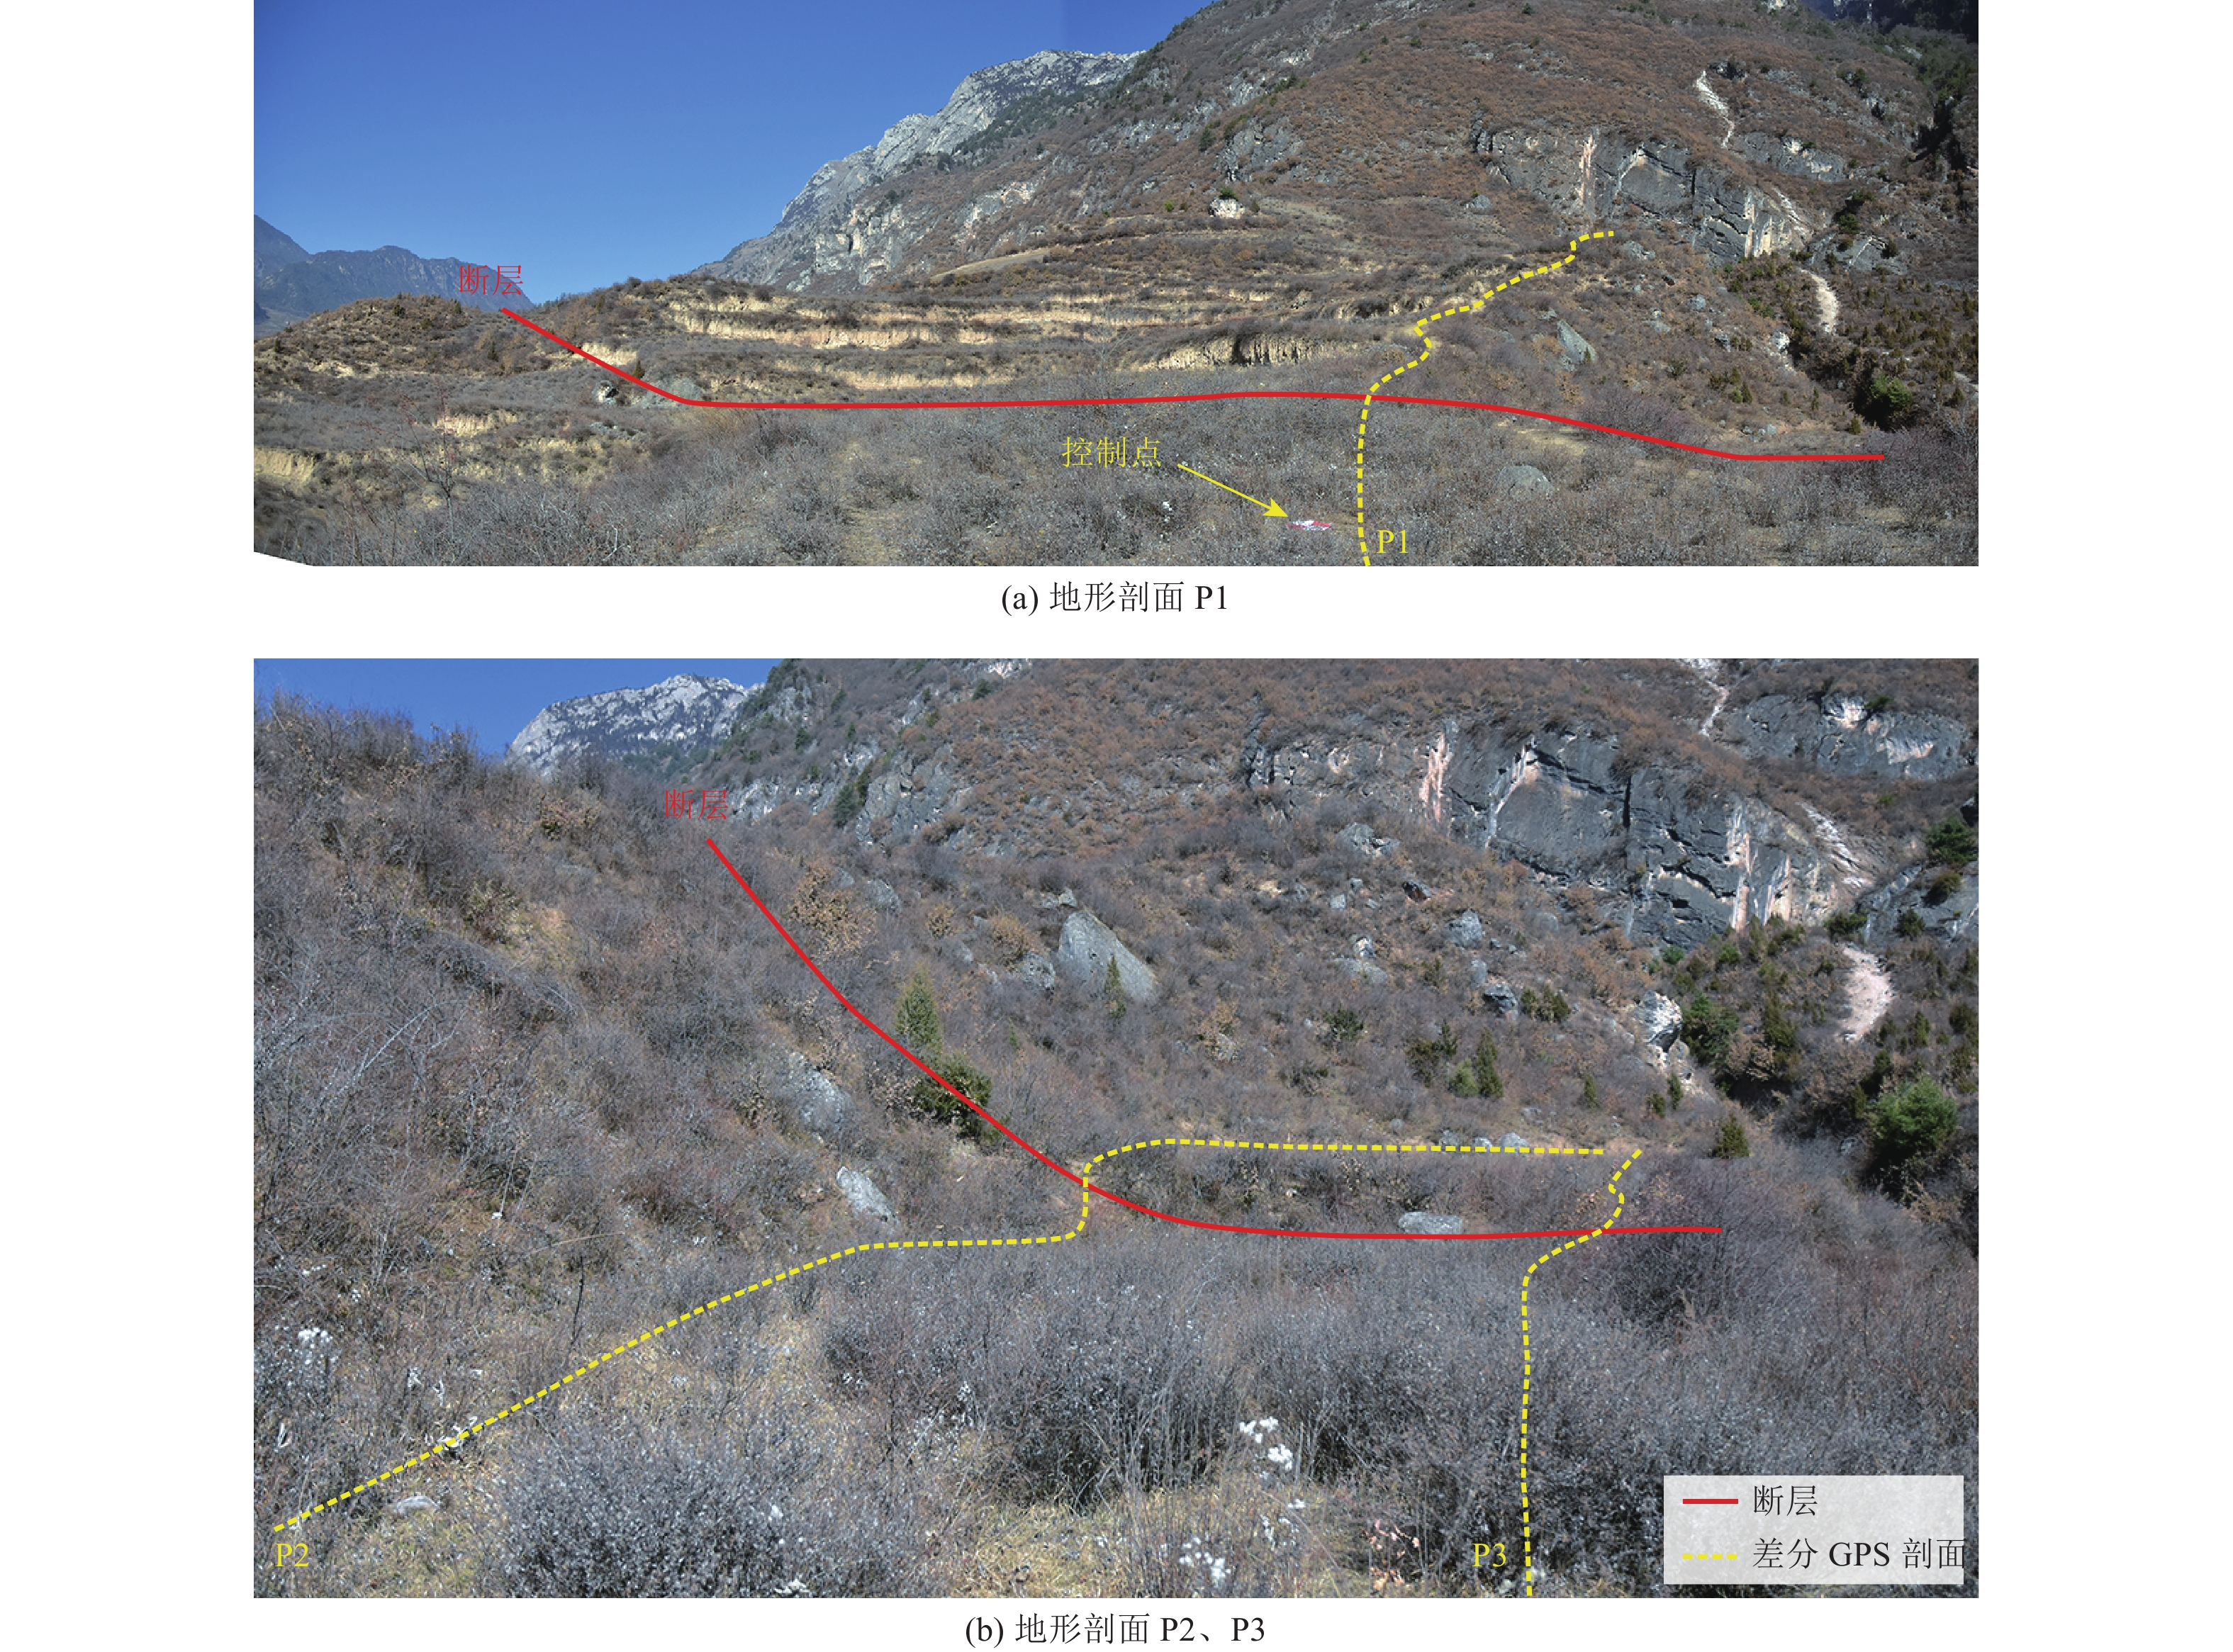
图 5 黑峪寺P1实测剖面与提取剖面对比
Figure 5. Comparison of P1 in Heiyusi between measured profiles and extraction profiles
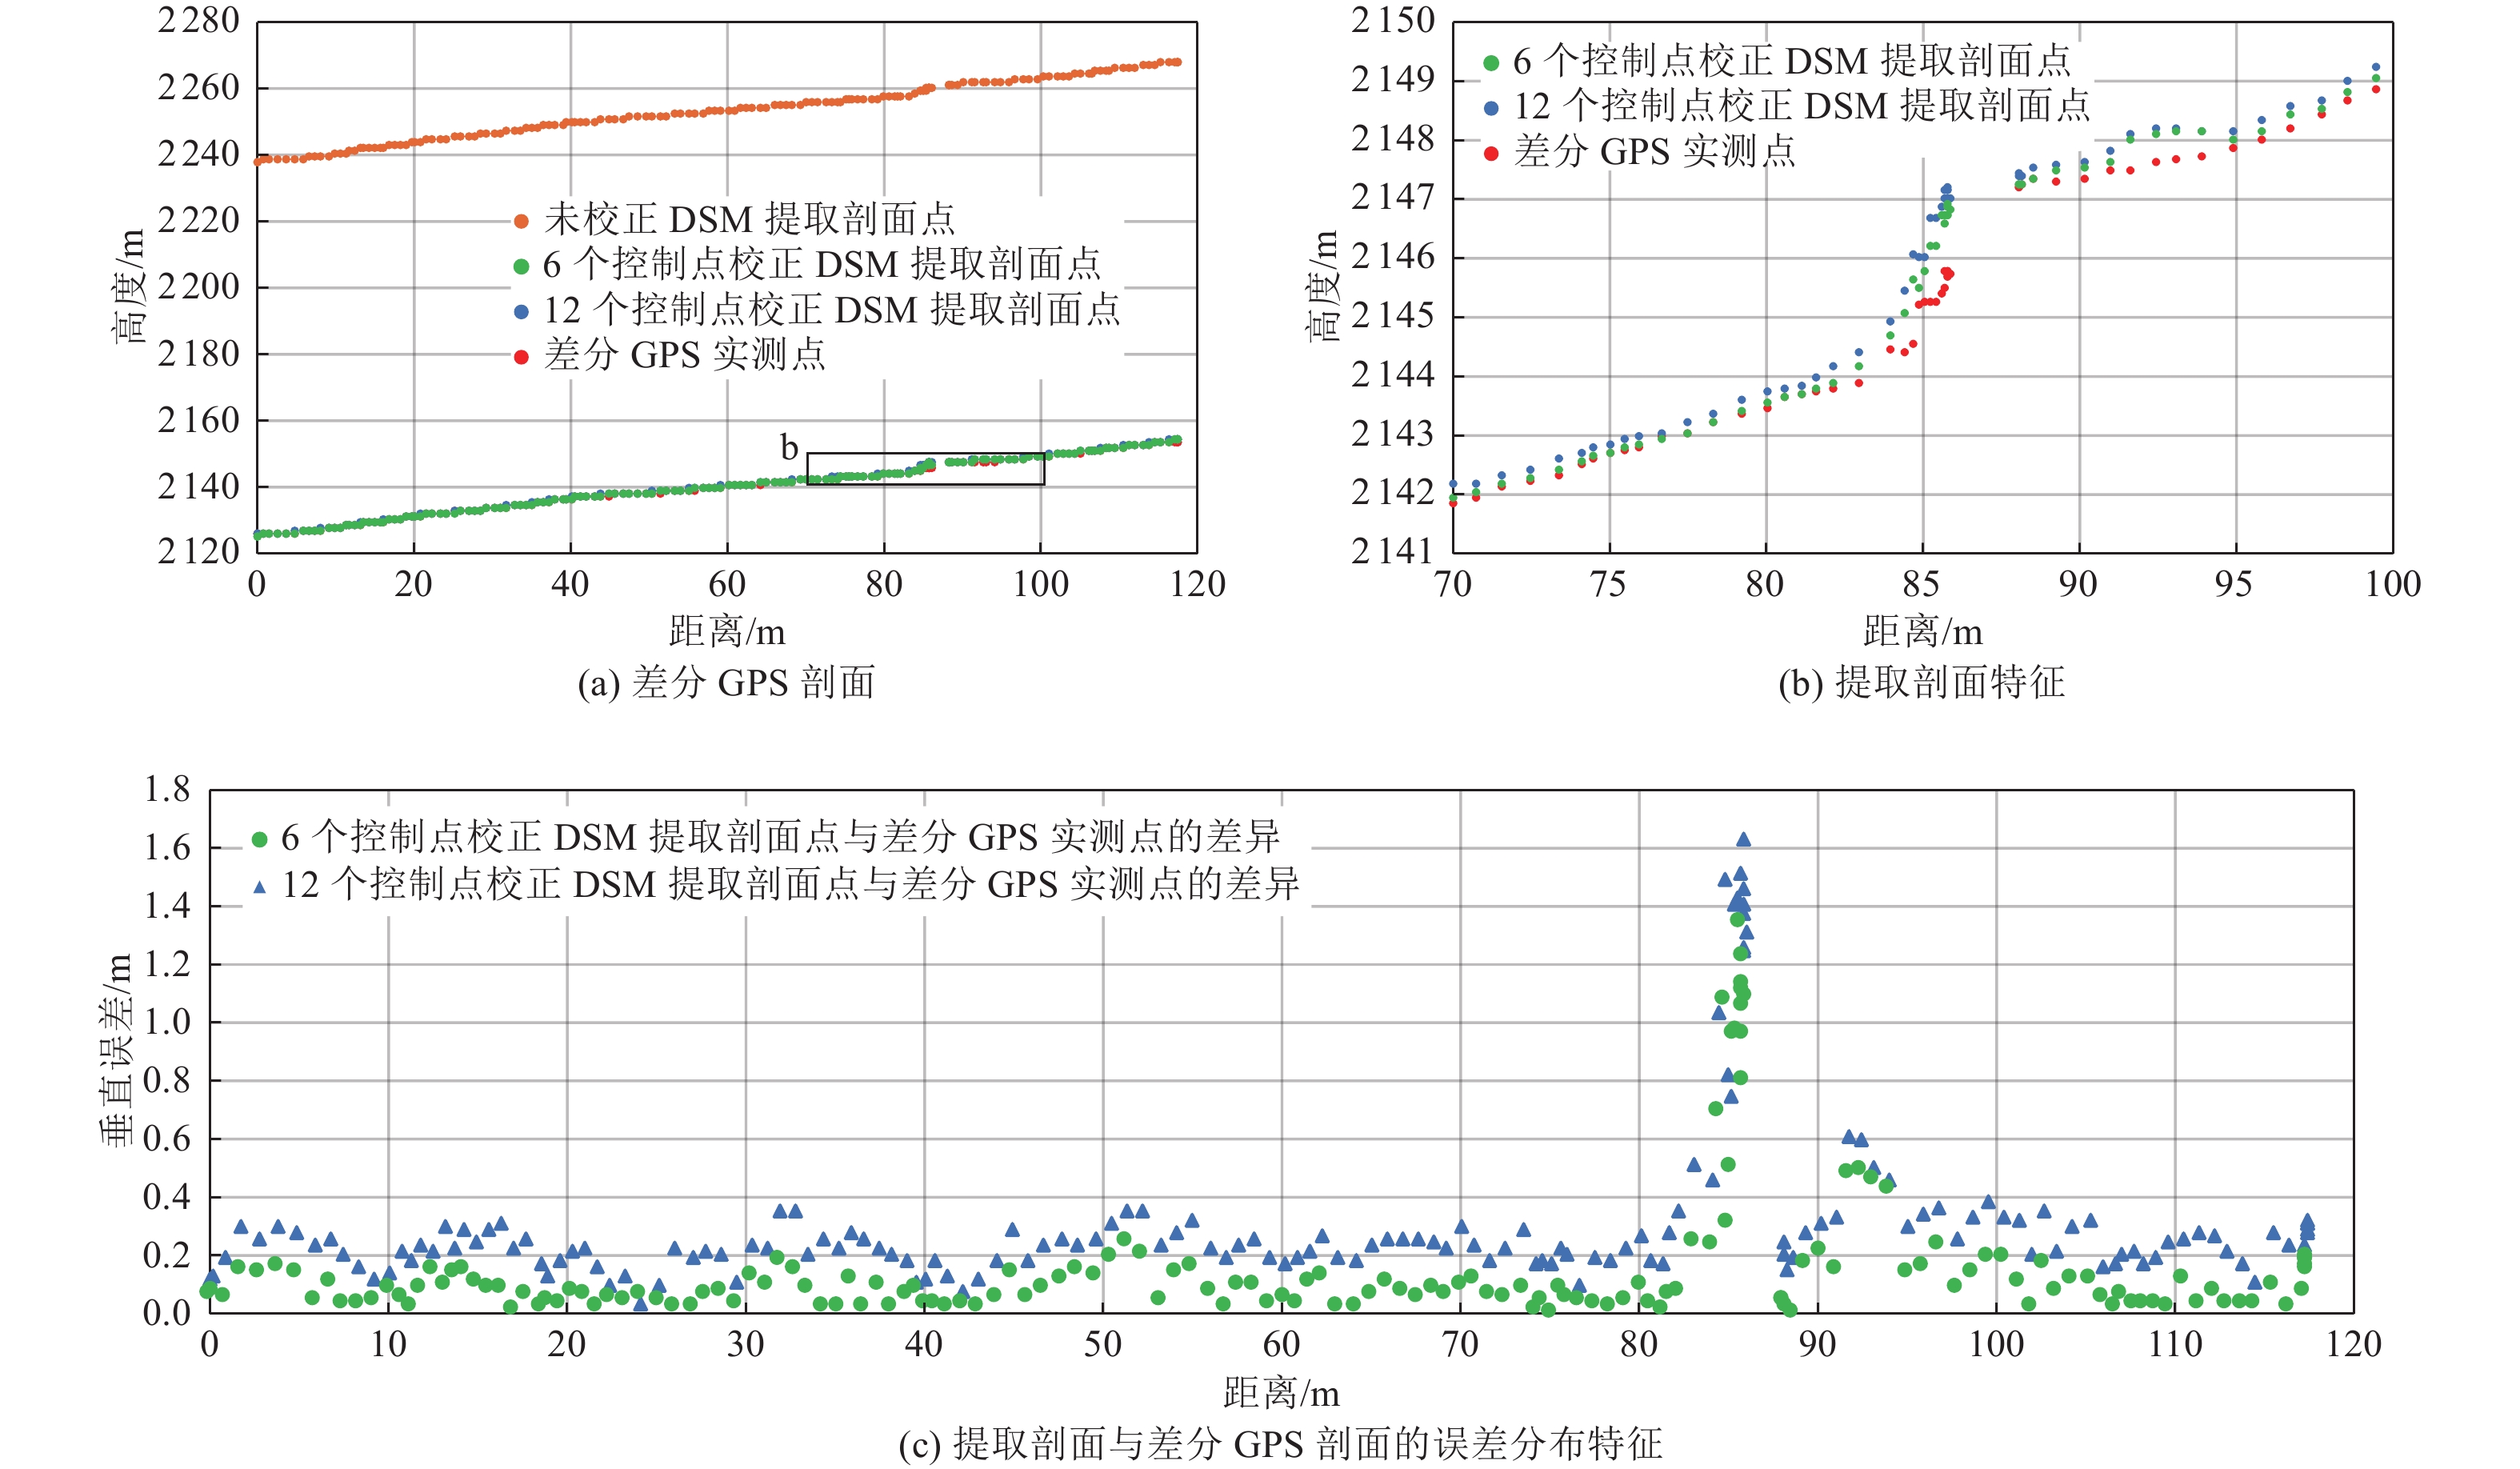
图 6 黑峪寺P2实测剖面与提取剖面对比
Figure 6. Comparison of P2 in Heiyusi between measured profiles and extraction profiles
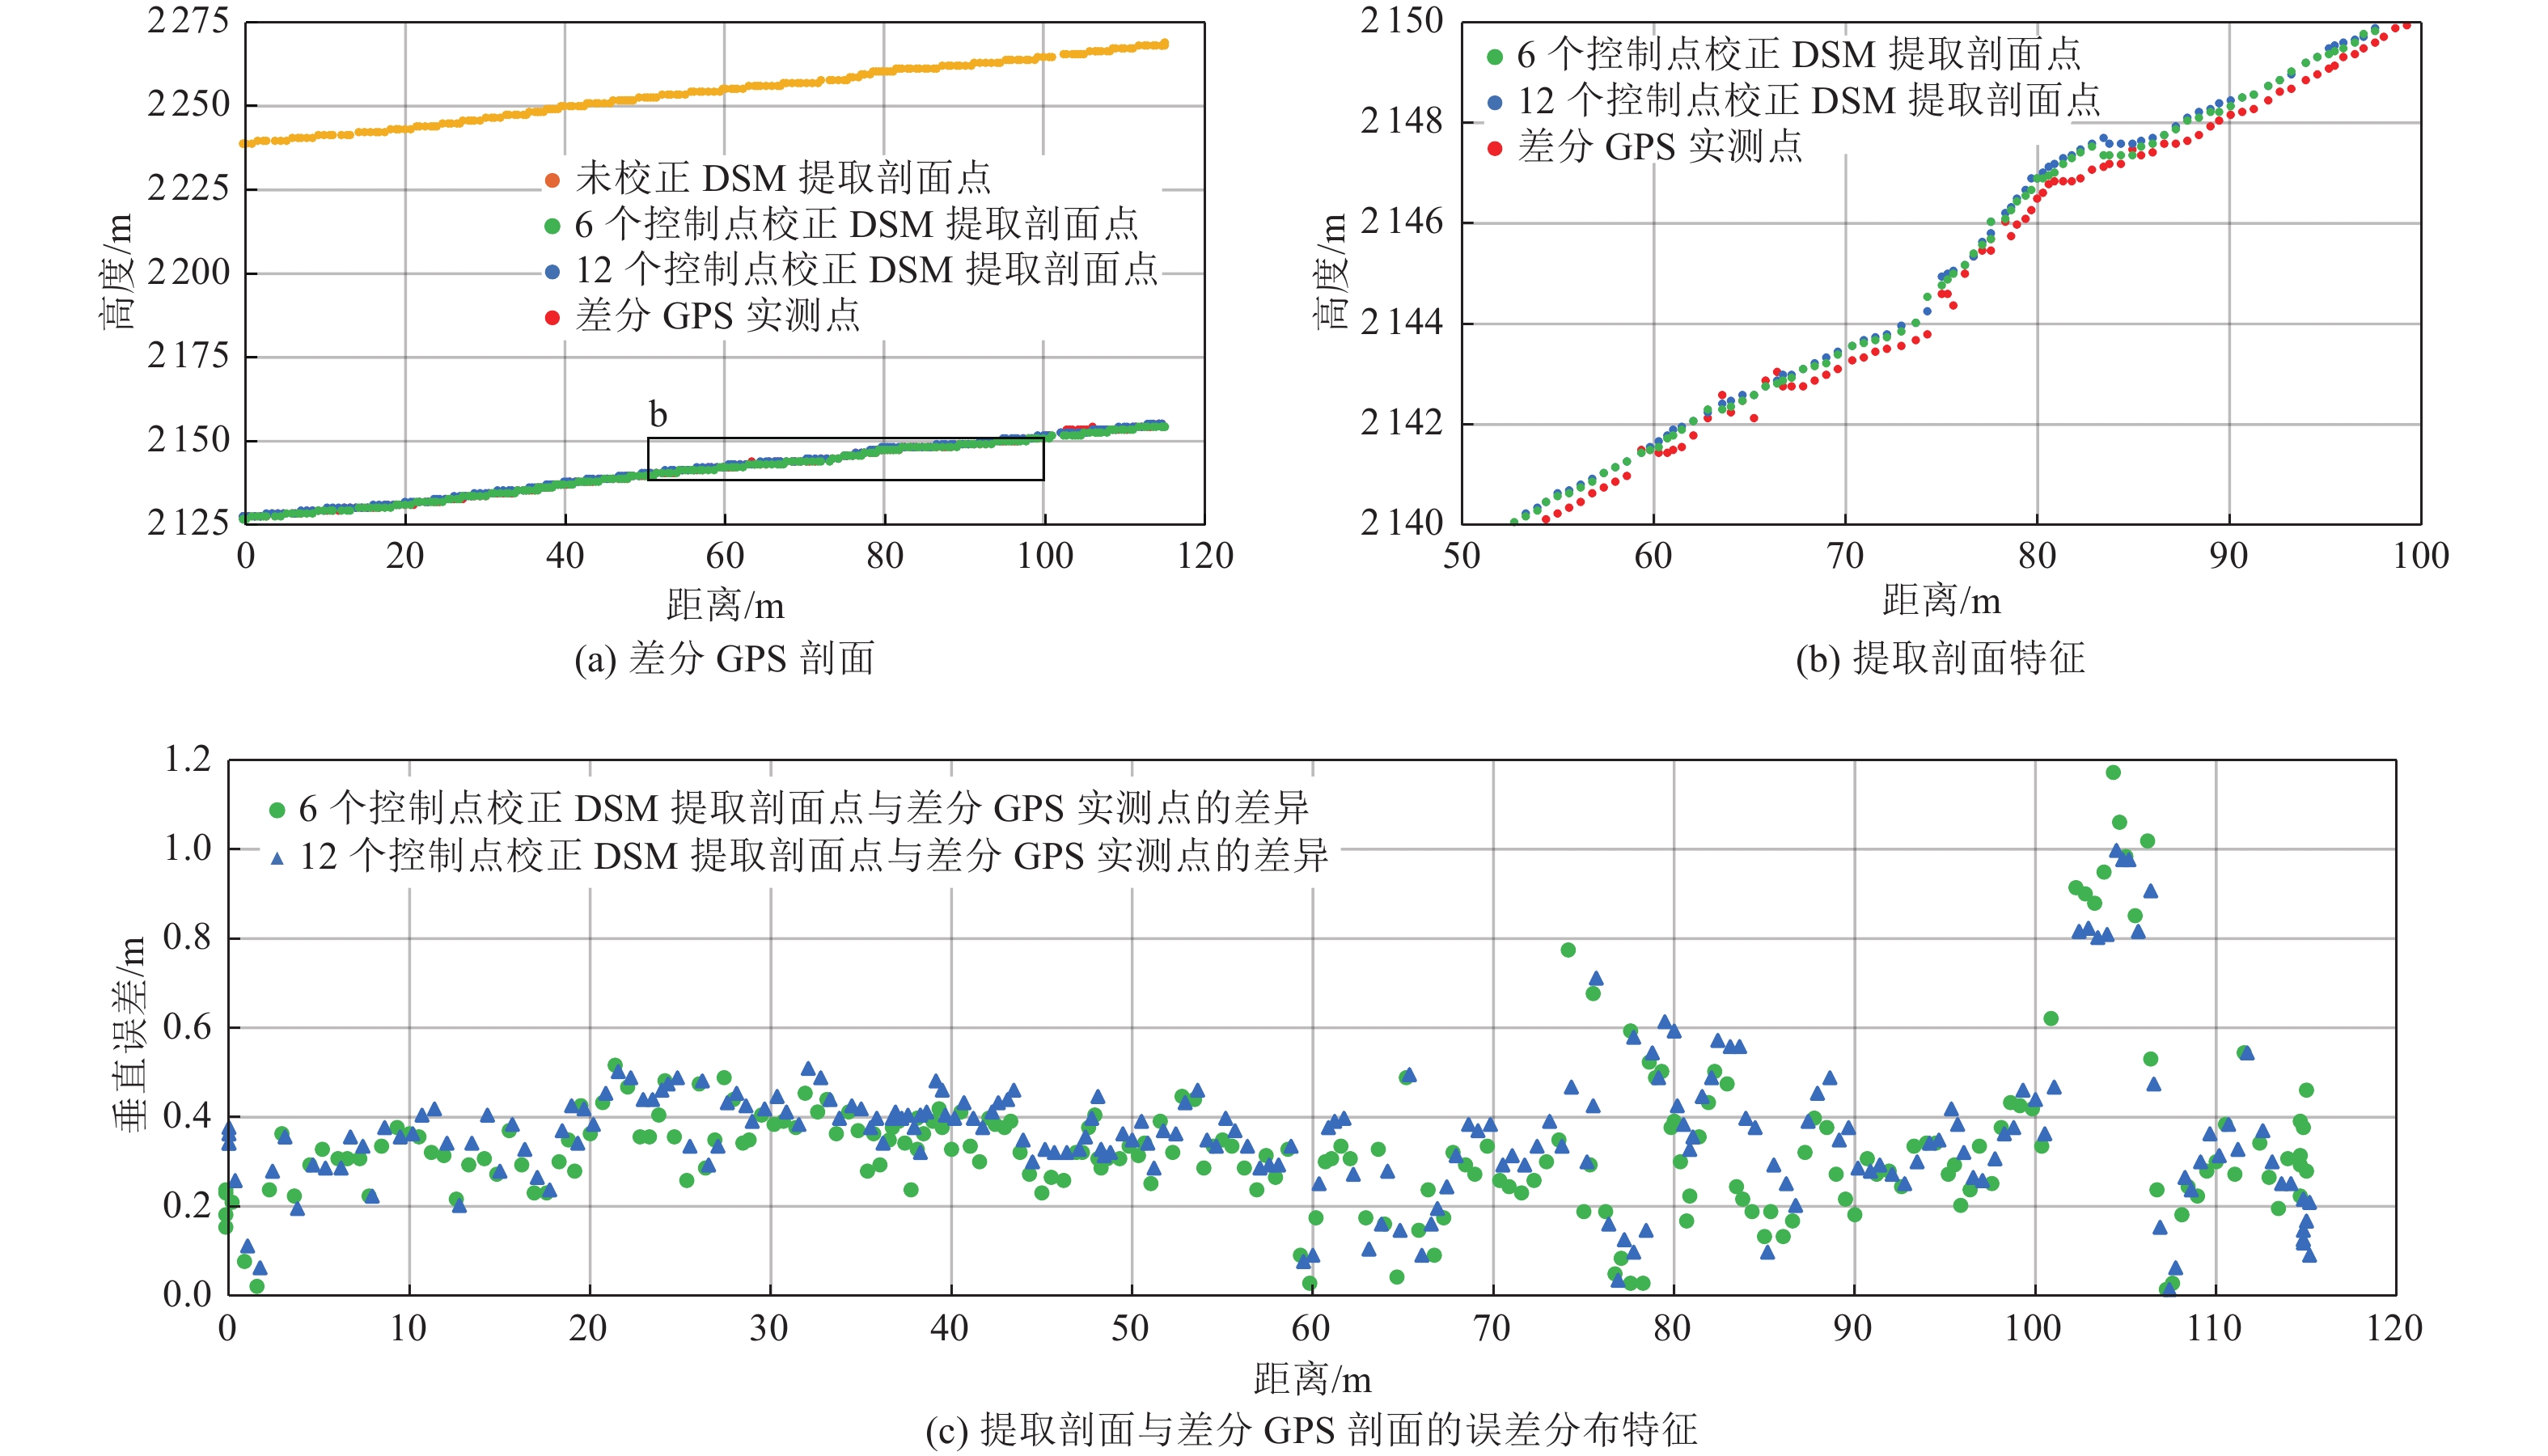
图 7 黑峪寺P3实测剖面与提取剖面对比
Figure 7. Comparison of P3 in Heiyusi between measured profiles and extraction profiles
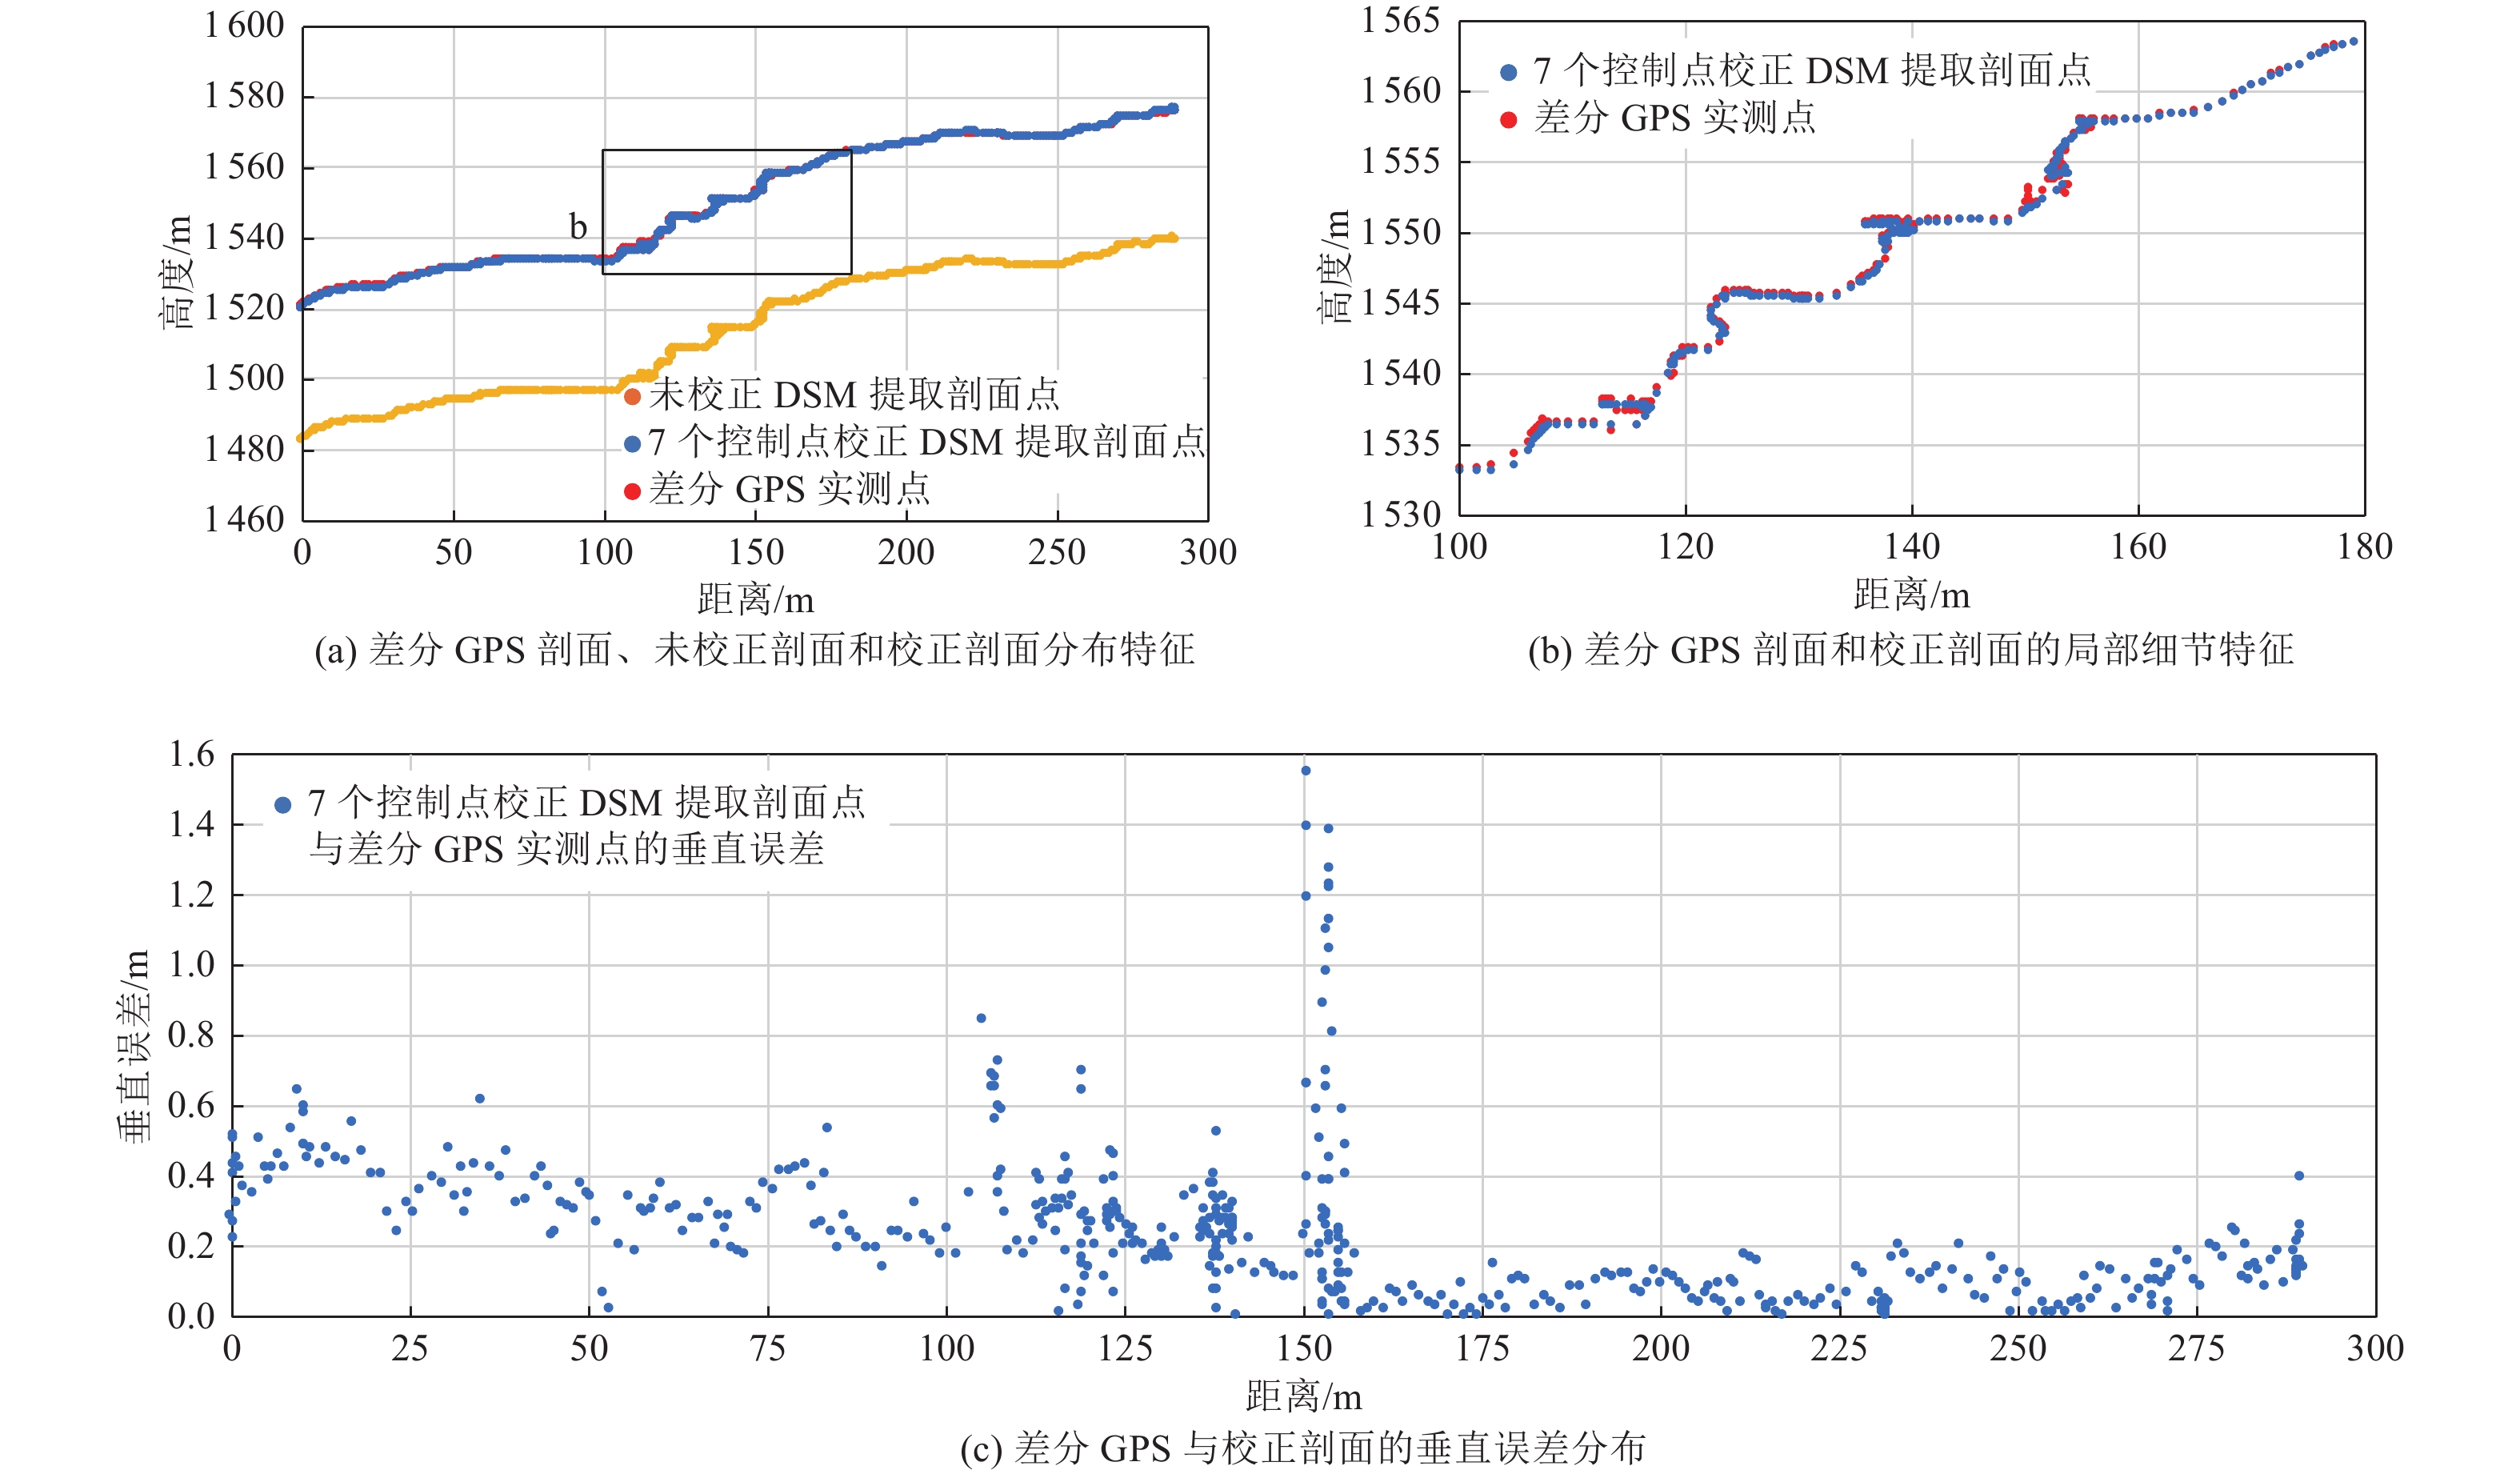
图 10 化马村P1实测剖面与提取剖面对比
Figure 10. Comparison of P1 in Huama between measured profiles and extraction profiles
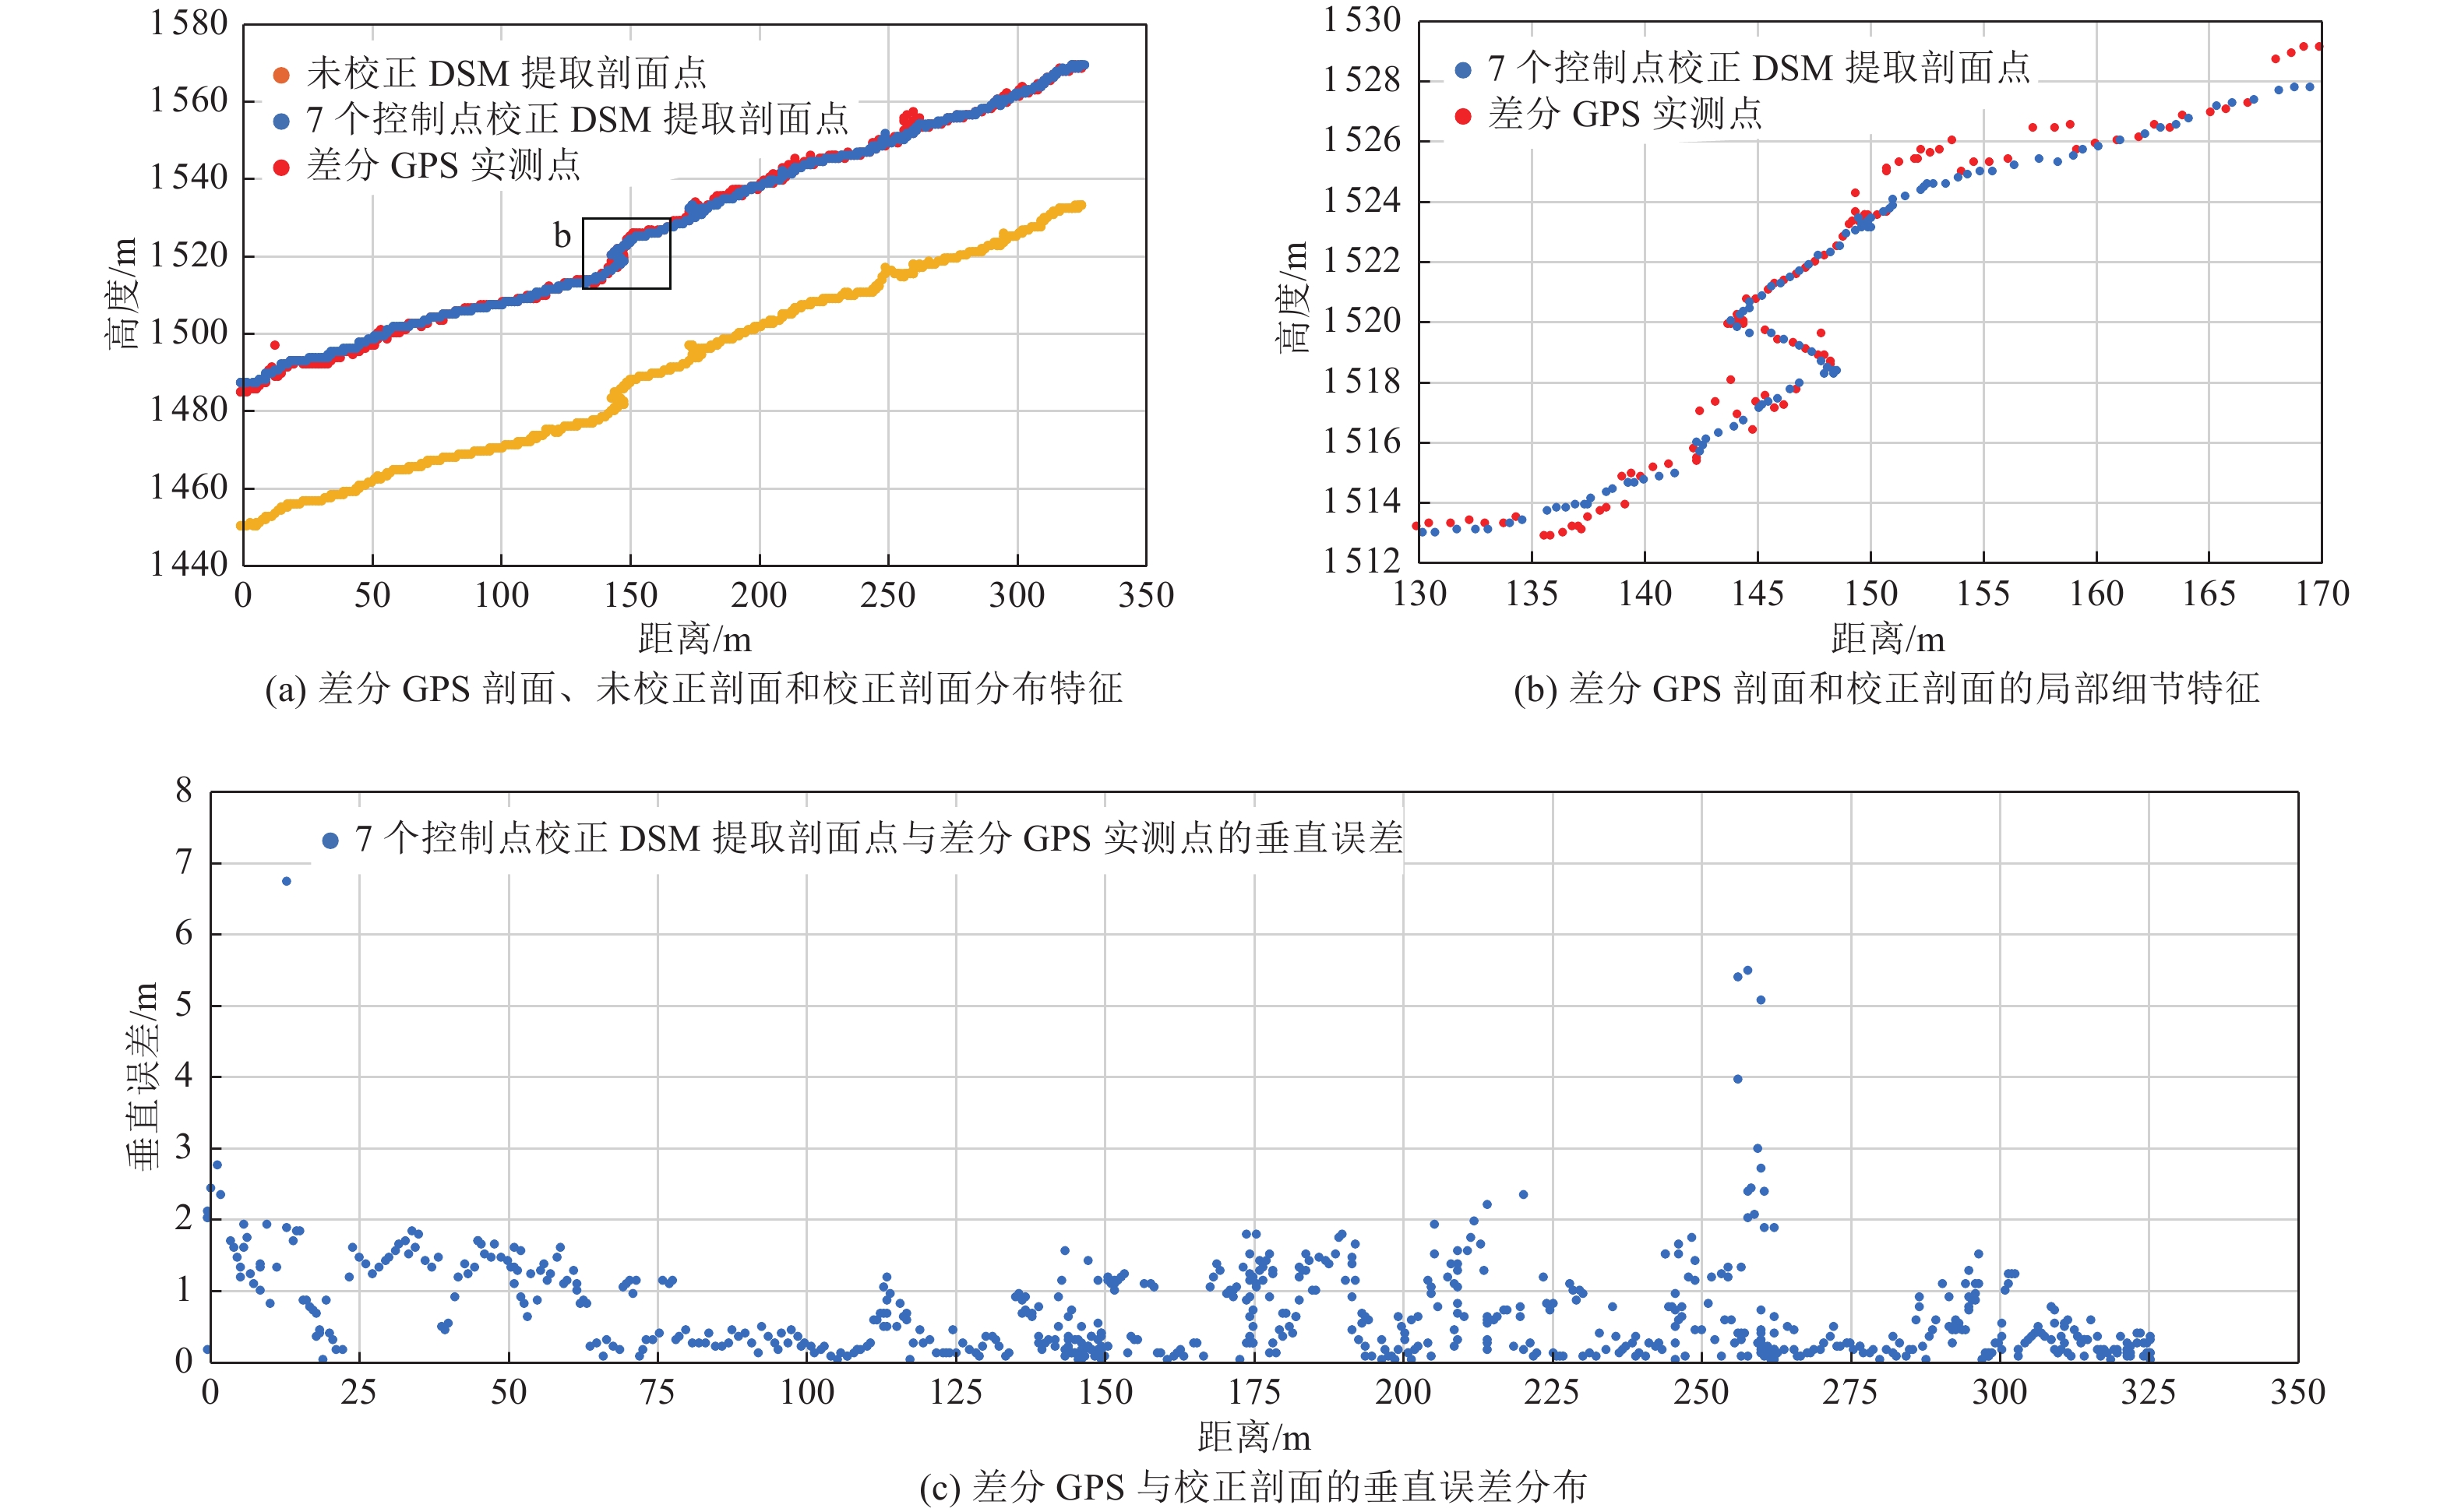
图 11 化马村P2实测剖面与提取剖面对比
Figure 11. Comparison of P2 in Huama between measured profiles and extraction profiles
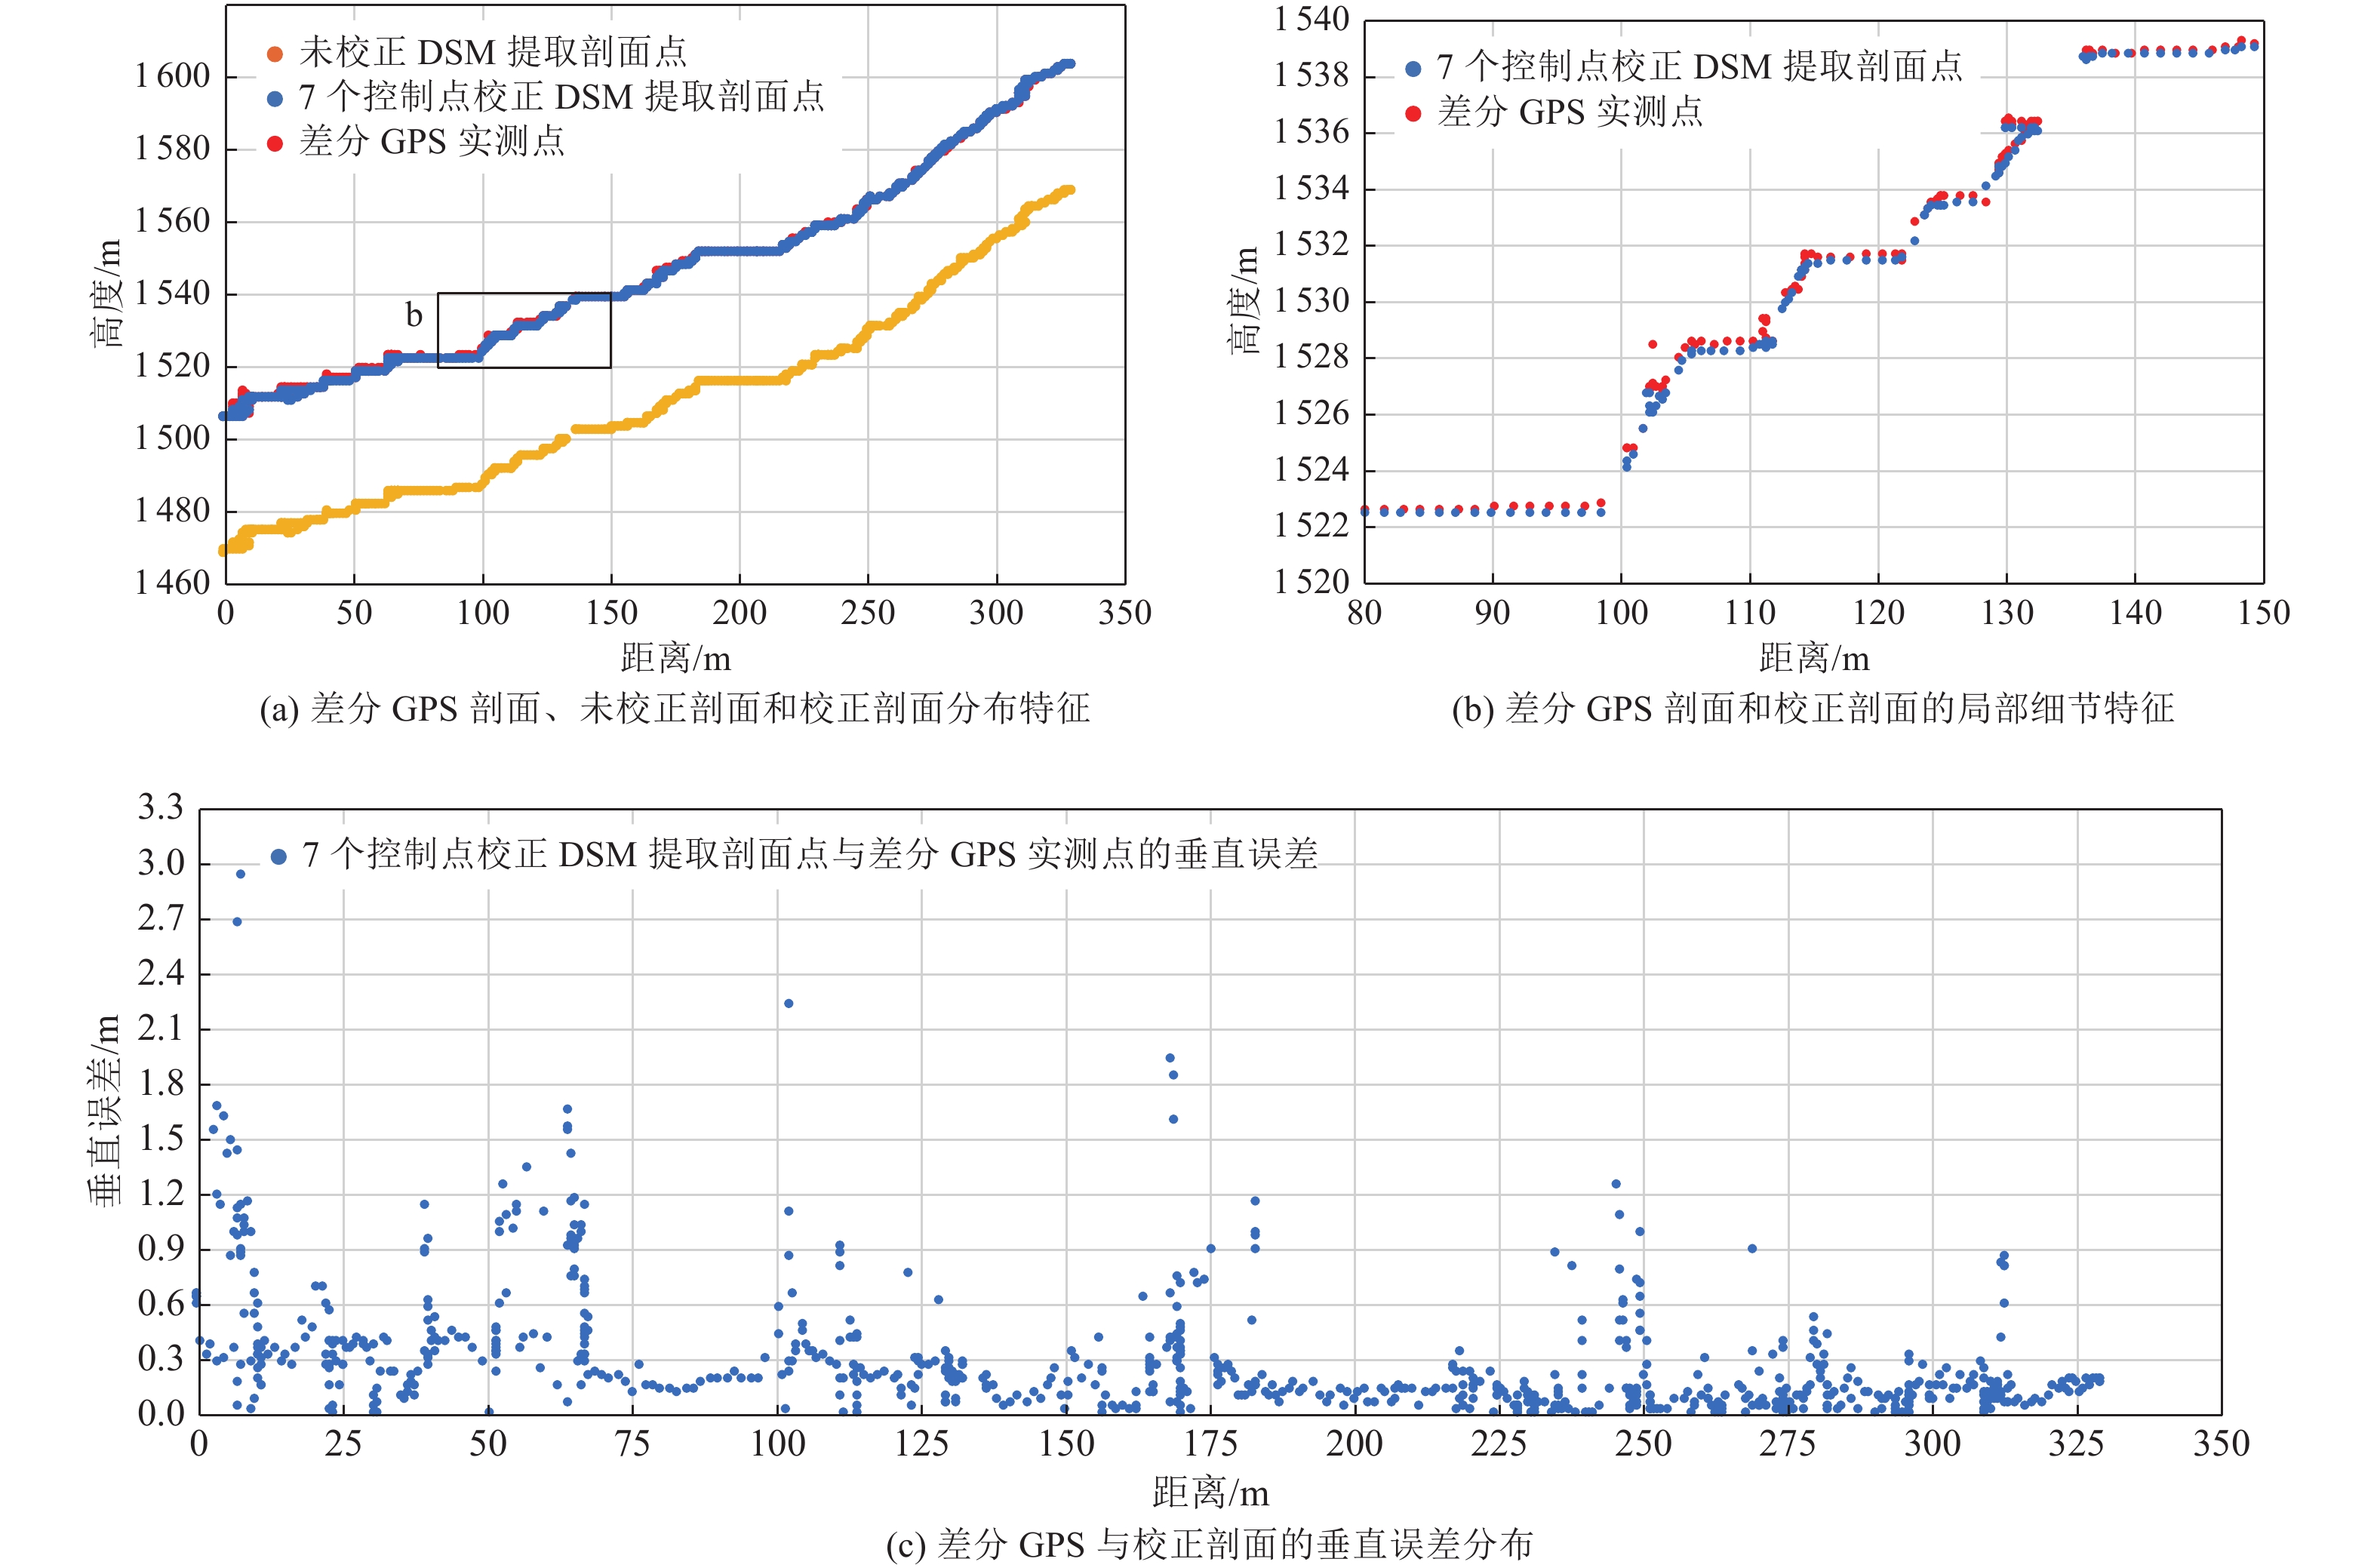
图 12 化马村P3实测剖面与提取剖面对比
Figure 12. Comparison of P3 in Huama between measured profiles and extraction profiles
表 1 黑峪寺和化马村测量情况
Table 1. Measurements of Heiyusi and Huama site
工作点 飞行高度/
m测量面积/
km2图像重叠度/
%照片数量/张 控制点数目/个 点云密度/
点·m−2正射影像(DOM)
分辨率/cm数字地表模型
(DSM)分辨率/cm黑峪寺 124.0 0.725 约70 1 160 12 31.4 4.46 17.8 化马村 98.6 0.385 约70 427 7 47.0 3.65 14.6  下载: 导出CSV
表 2 黑峪寺未校正图像提取控制点与差分GPS实测控制点水平误差和垂直误差
Table 2. Horizontal and vertical errors between uncorrected image extraction points and DGPS measured points
控制点 未校正图像提取控制点 差分GPS实测控制点 水平误差/m 垂直误差/m 经度/° 纬度/° 高度/m 经度/° 纬度/° 高度/m 1 104.186 256 0 33.924 494 0 2 265.156 104.186 241 1 33.924 436 3 2 152.30 6.54 112.85 2 104.186 157 0 33.923 752 0 2 236.890 104.186 139 1 33.923 690 0 2 125.35 7.08 111.54 3 104.185 135 0 33.924 406 0 2 240.789 104.185 117 6 33.924 343 7 2 128.93 7.1 111.86 4 104.184 937 0 33.925 042 0 2 246.660 104.184 919 9 33.924 979 4 2 133.69 7.12 112.97 5 104.184 051 0 33.924 445 0 2 216.075 104.184 030 3 33.924 377 2 2 104.69 7.76 111.38 6 104.184 389 0 33.925 279 0 2 244.573 104.184 371 8 33.925 216 1 2 131.53 7.16 113.05 7 104.184 360 0 33.926 269 0 2 275.363 104.184 346 3 33.926 211 8 2 160.58 6.47 114.79 8 104.183 976 0 33.926 130 0 2 266.602 104.183 961 1 33.926 071 9 2 152.41 6.59 114.19 9 104.183 428 0 33.925 507 0 2 263.471 104.183 411 8 33.925 446 6 2 150.93 6.86 112.54 10 104.183 103 0 33.926 348 0 2 279.589 104.183 087 8 33.926 292 7 2 165.80 6.29 113.79 11 104.182 400 0 33.926 389 0 2 288.628 104.182 384 8 33.926 333 7 2 175.40 6.29 113.23 12 104.182 916 0 33.927 011 0 2 311.029 104.182 903 3 33.926 961 3 2 196.41 5.64 114.62
下载: 导出CSV
表 3 经6个控制点校正后提取的检验点坐标与实测坐标对比
Table 3. Comparison between six control points-corrected test points and measured points
检验点 从DOM和DSM提取坐标 差分GPS实测控制点 水平误差/m 垂直误差/m 经度/° 纬度/° 高度/m 经度/° 纬度/° 高度/m 2 104.186 140 0 33.923 689 0 2 125.46 104.186 139 1 33.923 690 0 2 125.35 0.15 0.11 4 104.184 920 0 33.924 981 0 2 133.82 104.184 919 9 33.924 979 4 2 133.69 0.2 0.13 6 104.184 371 0 33.925 217 0 2 131.74 104.184 371 8 33.925 216 1 2 131.53 0.14 0.22 8 104.183 960 0 33.926 072 0 2 152.54 104.183 961 1 33.926 071 9 2 152.41 0.08 0.13 11 104.182 385 0 33.926 335 0 2 175.32 104.182 384 8 33.926 333 7 2 175.40 0.17 0.07 12 104.182 903 0 33.926 960 0 2 196.22 104.182 903 3 33.926 961 3 2 196.41 0.15 0.19
下载: 导出CSV
表 4 化马村未校正图像提取控制点与差分GPS实测控制点水平误差和垂直误差
Table 4. Directional error at Huama site between extraction points from uncorrected images and measured points
控制点 未校正图像提取控制点 差分GPS实测控制点 水平误差/m 垂直误差/m 经度/° 纬度/° 高度/m 经度/° 纬度/° 高度/m 1 104.540 325 0 33.741 176 0 1 556.67 104.540 288 33.741 114 4 1 594.24 7.65 37.57 2 104.541 607 0 33.741 010 0 1 532.95 104.541 567 33.740 947 4 1 569.41 7.90 36.46 3 104.540 270 0 33.740 160 0 1 512.82 104.540 226 33.740 100 6 1 550.56 7.75 37.74 4 104.540 635 0 33.739 285 0 1 467.24 104.540 585 33.739 227 6 1 503.28 7.86 36.04 5 104.540 810 0 33.738 124 0 1 469.00 104.540 761 33.738 065 9 1 506.09 7.89 37.09 6 104.541 360 0 33.739 435 0 1 500.42 104.541 315 33.739 375 3 1 537.03 7.84 36.60 7 104.542 265 0 33.740 881 0 1 536.25 104.542 224 33.740 818 0 1 572.04 7.97 35.79
下载: 导出CSV
-
[1] 艾明, 2018. 高精度摄影测量方法在活动构造定量参数获取中的应用——以茶卡盆地两侧断裂为例. 北京: 中国地震局地质研究所.Ai M., 2018. Application of high-precision photogrammetry method in obtaining quantitative parameters of active tectonics-A case study of the faults on the two sides of the Caka Basin. Beijing: Institute of Geology, China Earthquake Administrator. (in Chinese) [2] 艾明, 毕海芸, 郑文俊等, 2018. 利用无人机摄影测量技术提取活动构造定量参数. 地震地质, 40(6): 1276—1293Ai M. , Bi H. Y. , Zheng W. J. , et al. , 2018. Using unmanned aerial vehicle photogrammetry technology to obtain quantitative parameters of active tectonics. Seismology and Geology, 40(6): 1276—1293. (in Chinese) [3] 毕海芸, 郑文俊, 曾江源等, 2017. SfM摄影测量方法在活动构造定量研究中的应用. 地震地质, 39(4): 656—674 doi: 10.3969/j.issn.0253-4967.2017.04.003Bi H. Y. , Zheng W. J. , Zeng J. Y. , et al. , 2017. Application of SfM photogrammetry method to the quantitative study of active tectonics. Seismology and Geology, 39(4): 656—674. (in Chinese) doi: 10.3969/j.issn.0253-4967.2017.04.003 [4] 常直杨, 王建, 白世彪等, 2015. 白龙江流域河流纵剖面与基岩侵蚀模型特征. 山地学报, 33(2): 183—190Chang Z. Y. , Wang J. , Bai S. B. , et al. , 2015. Morpho-tectonic analysis of the Bailongjiang drainage basin. Mountain Research, 33(2): 183—190. (in Chinese) [5] 陈洪凯, 李吉均. 1997. 白龙江流域第四纪以来地貌发育基本模式研究. 重庆交通学院学报, 16(1): 15—20Chen H. K., Li J. J., 1997. General approach on geomorphologic evolution in Bailongjiang basin since Quaternary. Journal of Chongqing Jiaotong Institute, 16(1): 15—20. (in Chinese) [6] 梁学战, 陈洪凯, 唐红梅, 2010. 青藏高原东部边缘地区第四纪泥石流发育特性研究. 重庆交通大学学报(自然科学版), 29(6): 978—983Liang X. Z. , Chen H. K. , Tang H. M. , 2010. Studies on debris flow development properties in Quaternary on the eastern edge of Qinghai-Tibet Plateau. Journal of Chongqing Jiaotong University (Natural Sciences), 29(6): 978—983. (in Chinese) [7] 刘兴旺, 袁道阳, 邵延秀等, 2015. 甘肃迭部—白龙江南支断裂中东段晚第四纪构造活动特征. 地球科学与环境学报, 37(6): 111—119 doi: 10.3969/j.issn.1672-6561.2015.06.010Liu X. W. , Yuan D. Y. , Shao Y. X. , et al. , 2015. Characteristics of late Quaternary tectonic activity in the middle-eastern segment of the southern branch of Diebu-Bailongjiang fault, Gansu. Journal of Earth Sciences and Environment, 37(6): 111—119. (in Chinese) doi: 10.3969/j.issn.1672-6561.2015.06.010 [8] 苏琦, 梁明剑, 袁道阳等, 2016. 白龙江流域构造地貌特征及其对滑坡泥石流灾害的控制作用. 地球科学, 41(10): 1758—1770Su Q. , Liang M. J. , Yuan D. Y. , et al. , 2016. Geomorphic features of the Bailongjiang river drainage basin and its relationship with geological disaster. Earth Science, 41(10): 1758—1770. (in Chinese) [9] 王朋涛, 邵延秀, 张会平等, 2016. sUAV摄影技术在活动构造研究中的应用——以海原断裂骟马沟为例. 第四纪研究, 36(2): 433—442 doi: 10.11928/j.issn.1001-7410.2016.02.18Wang P. T. , Shao Y. X. , Zhang H. P. , et al. , 2016. The application of sUAV Photogrammetry in active tectonics: Shanmagou site of Haiyuan fault, for example. Quaternary Sciences, 36(2): 433—442. (in Chinese) doi: 10.11928/j.issn.1001-7410.2016.02.18 [10] 魏占玉, Ramon A, 何宏林等, 2015. 基于SfM方法的高密度点云数据生成及精度分析. 地震地质, 37(2): 636—648 doi: 10.3969/j.issn.0253-4967.2015.02.024Wei Z. Y. , Ramon A. , He H. L. , et al. , 2015. Accuracy analysis of terrain point cloud acquired by “Structure from Motion” using aerial photos. Seismology and Geology, 37(2): 636—648. (in Chinese) doi: 10.3969/j.issn.0253-4967.2015.02.024 [11] 杨海波, 杨晓平, 黄雄南等, 2016. 移动摄影测量数据与差分GPS数据的对比分析——以祁连山北麓洪水坝河东岸断层陡坎为例. 地震地质, 38(4): 1030—1046 doi: 10.3969/j.issn.0253-4967.2016.04.018Yang H. B. , Yang X. P. , Huang X. N. , et al. , 2016. Data comparative analysis between SfM data and DGPS data: a case study from fault scarp in the east bank of Hongshuiba river, northern margin of the Qilian Shan. Seismology and Geology, 38(4): 1030—1046. (in Chinese) doi: 10.3969/j.issn.0253-4967.2016.04.018 [12] 余斌, 杨永红, 苏永超等, 2010. 甘肃省舟曲8.7特大泥石流调查研究. 工程地质学报, 18(4): 437—444 doi: 10.3969/j.issn.1004-9665.2010.04.001Yu B. , Yang Y. H. , Su Y. C. , et al. , 2010. Research on the giant debris flow hazards in Zhouqu county, Gansu Province on August 7, 2010. Journal of Engineering Geology, 18(4): 437—444. (in Chinese) doi: 10.3969/j.issn.1004-9665.2010.04.001 [13] 俞晶星, 郑文俊, 袁道阳等, 2012. 西秦岭西段光盖山-迭山断裂带坪定-化马断裂的新活动性与滑动速率. 第四纪研究, 32(5): 957—967 doi: 10.3969/j.issn.1001-7410.2012.05.13Yu J. X. , Zheng W. J. , Yuan D. Y. , et al. , 2012. Late Quaternary active characteristics and slip-rate of Pingding-Huama fault, the eastern segment of Guanggaishan-Dieshan fault zone (West Qinling Mountain). Quaternary Sciences, 32(5): 957—967. (in Chinese) doi: 10.3969/j.issn.1001-7410.2012.05.13 [14] 袁道阳, 雷中生, 何文贵等, 2007. 公元前186年甘肃武都地震考证与发震构造探讨. 地震学报, 29(6): 654—663Yuan D. Y., Lei Z. S., He W. G., et al., 2007. Textual research of Wudu earthquake in 186 B. C. in Gansu Province, China and discussion on its causative structure. Acta Seismologica Sinica, 29(6): 654—663. (in Chinese) [15] 张波, 王爱国, 袁道阳等, 2018. 基于多源遥感解译和野外验证的断裂几何展布——以西秦岭光盖山-迭山南麓断裂为例. 地震地质, 40(5): 1018—1039 doi: 10.3969/j.issn.0253-4967.2018.05.005Zhang B. , Wang A. G. , Yuan D. Y. , et al. , 2018. Fault geometry defined by multiple remote sensing images interpretation and field verification: A case study from southern Guanggaishan-Dieshan fault, Western Qinling. Seismology and Geology, 40(5): 1018—1039. (in Chinese) doi: 10.3969/j.issn.0253-4967.2018.05.005 [16] Bemis S. P. , Micklethwaite S. , Turner D. , et al. , 2014. Ground-based and UAV-based photogrammetry: a multi-scale, high-resolution mapping tool for structural geology and paleoseismology. Journal of Structural Geology, 69: 163—178. doi: 10.1016/j.jsg.2014.10.007 [17] Harwin S. , Lucieer A. , 2012. Assessing the accuracy of georeferenced point clouds produced via multi-view stereopsis from unmanned aerial vehicle (UAV) imagery. Remote Sensing, 4(6): 1573—1599. doi: 10.3390/rs4061573 [18] Javernick L. , Brasington J. , Caruso B. , 2014. Modeling the topography of shallow braided rivers using structure-from-motion photogrammetry. Geomorphology, 213: 166—182. doi: 10.1016/j.geomorph.2014.01.006 [19] Johnson K. , Nissen E. , Saripalli S. , et al. , 2014. Rapid mapping of ultrafine fault zone topography with structure from motion. Geosphere, 10(5): 969—986. doi: 10.1130/GES01017.1 [20] Lowe D. G. , 2004. Distinctive image features from scale-invariant keypoints. International Journal of Computer Vision, 60(2): 91—110. doi: 10.1023/B:VISI.0000029664.99615.94 [21] Lucieer A. , De Jong S. M. , Turner D. , 2014. Mapping landslide displacements using structure from motion (SfM) and image correlation of multi-temporal UAV photography. Progress in Physical Geography: Earth and Environment, 38(1): 97—116. doi: 10.1177/0309133313515293 [22] Mancini F. , Dubbini M. , Gattelli M. , et al. , 2013. Using unmanned aerial vehicles (UAV) for high-resolution reconstruction of topography: the structure from motion approach on coastal environments. Remote Sensing, 5(12): 6880—6898. doi: 10.3390/rs5126880 [23] Moreels P. , Perona P. , 2007. Evaluation of features detectors and descriptors based on 3D objects. International Journal of Computer Vision, 73(3): 263—284. doi: 10.1007/s11263-006-9967-1 [24] Westoby M. J. , Brasington J. , Glasser N. F. , et al. , 2012. ‘Structure-from-Motion’ photogrammetry: a low-cost, effective tool for geoscience applications. Geomorphology, 179: 300—314. doi: 10.1016/j.geomorph.2012.08.021 -


 点击查看大图
计量
- 文章访问数: 206
- HTML全文浏览量: 96
- PDF下载量: 17
- 被引次数: 0
