
Positioning Accuracy Analysis of the New Portable Industry-level Unmanned Aerial Vehicle Phantom 4RTK
-
摘要: 本文针对新型便携式行业级无人机精灵4RTK开展了实测数据的定位精度分析,从有、无控制点情况下的绝对定位精度和无控制点情况下的相对定位精度2方面入手,详细计算后者水平距离和高程差的测量误差,探讨网络RTK技术的无控制点情况在活动构造中的应用。结果表明,无人机精灵4RTK在天气较晴朗、飞行高度100 m、镜头角度正射向下、旁向和航向重叠率均为70%等实测条件下,有控制点情况下水平位置和高程测量误差均<4.5 cm,无控制点情况下水平位置测量误差<0.60 m、高程测量误差<1.90 m;无控制点情况下,当实际水平距离<300 m时,水平距离测量误差<0.100 m,当高程差<2.8 m时,高程差测量误差<0.100 m;以复合运动性质的发震断层为例,初步探讨认为无人机精灵4RTK的网络RTK技术在无控制点情况下提取活动构造的定量参数时,其水平位移量精度能够达到厘米级,垂直位错量精度可能达不到厘米级,当垂直位错量小于8.0 m时,精度能够达到0.157 m。Abstract: This paper carried out a study on positioning accuracy of measured data for the new portableindustry-level unmanned aerial vehicle Phantom 4RTK. Starting from the absolute positioning accuracy with and without control points and relative positioning accuracy without control points aspects, the measurement errors of the horizontal distance and elevation difference of the latter are calculated in detail, and the application of the network RTK technology without control points in active tectonics is discussed. The results show that the horizontal position and elevation measurement errors of unmanned aerial vehicle Phantom 4RTK are less than 4.5 cm with control points under the measured conditions of sunny weather, flying altitude of 100 m, camera angle downwards, lateral and course overlap rate of 70%. Without control points,the measurement errors of horizontal position and elevation are less than 4.5 cm, in the case of no control points the horizontal position measurement error is less than 0.60 m, and the elevation measurement error is less than 1.90 m. In the case of no control points, when the actual horizontal distance is less than 300 m, the horizontal distance measurement error is less than 0.100 m, when the elevation difference is less than 2.8 m, the elevation difference measurement error is less than 0.100 m. Taking causative faults of composite motion as an example, this paper preliminarily discussed that the network RTK technology based on Phantom 4RTK can extract the quantitative parameters of the active tectonics without control points, the accuracy of the horizontal displacement can reach centimeter level, but the accuracy of the vertical dislocation may not reach centimeter level, when the vertical dislocation is less than 8.0 m, the accuracy can reach 0.157 m.
-
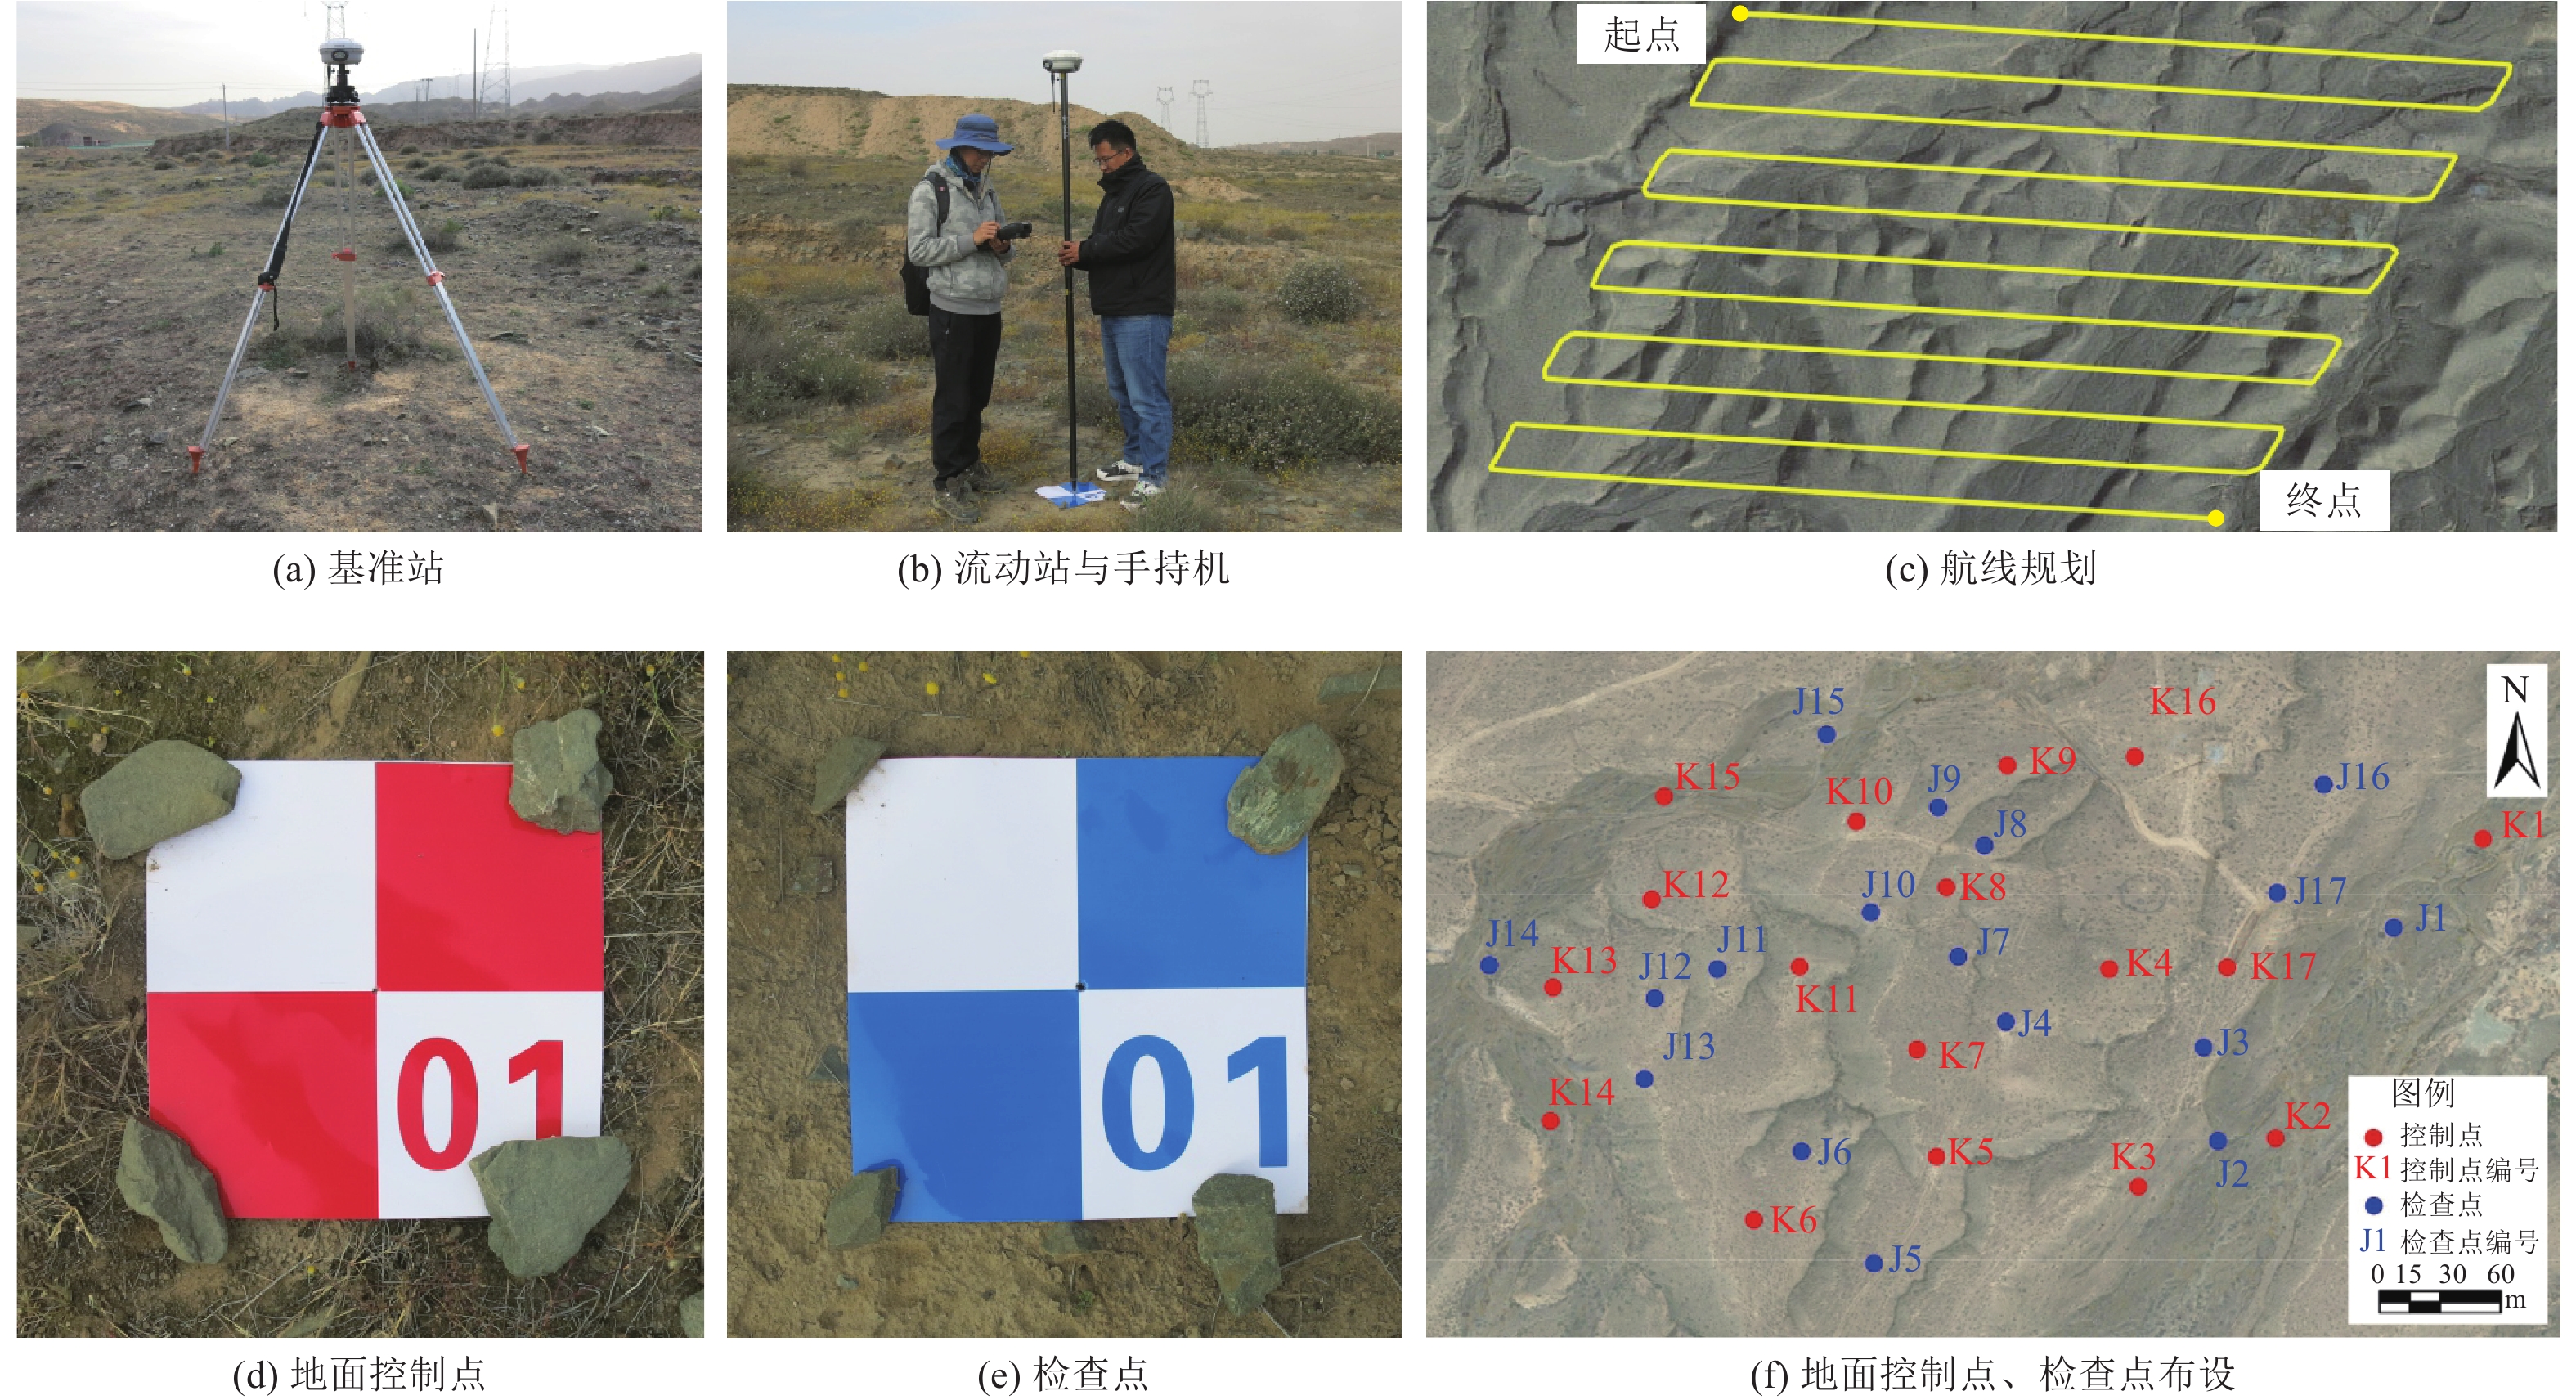
图 1 Trimble R8差分GPS、地面控制点和检查点、航线规划
Figure 1. Trimble R8 differential GPS, ground control points and checkpoints, route planning
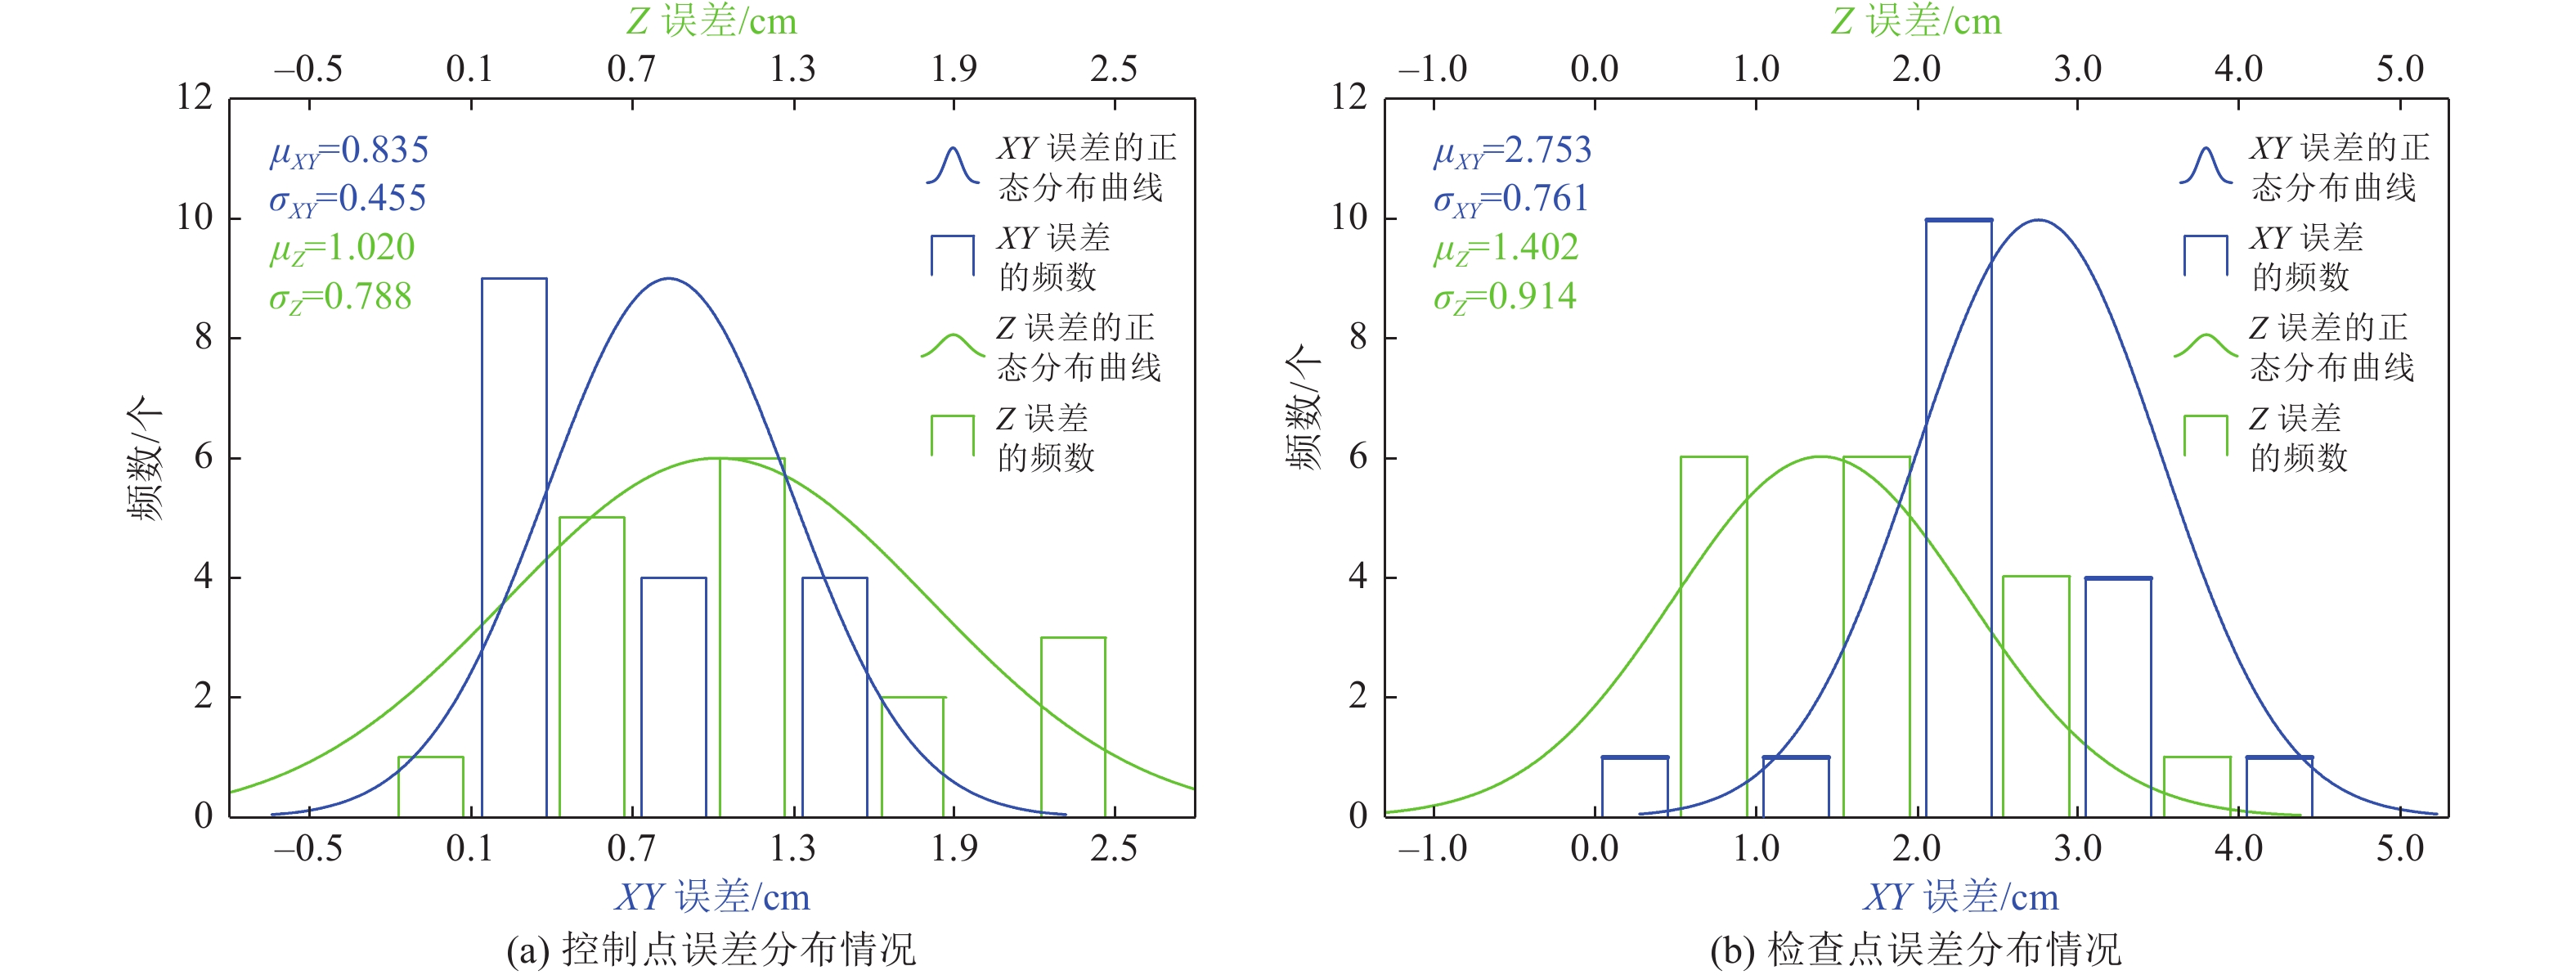
图 3 有控制点情况下误差分布直方图及正态分布曲线
Figure 3. Histogram and normal distribution curve of error distribution of variables at control points and checkpoints with control point
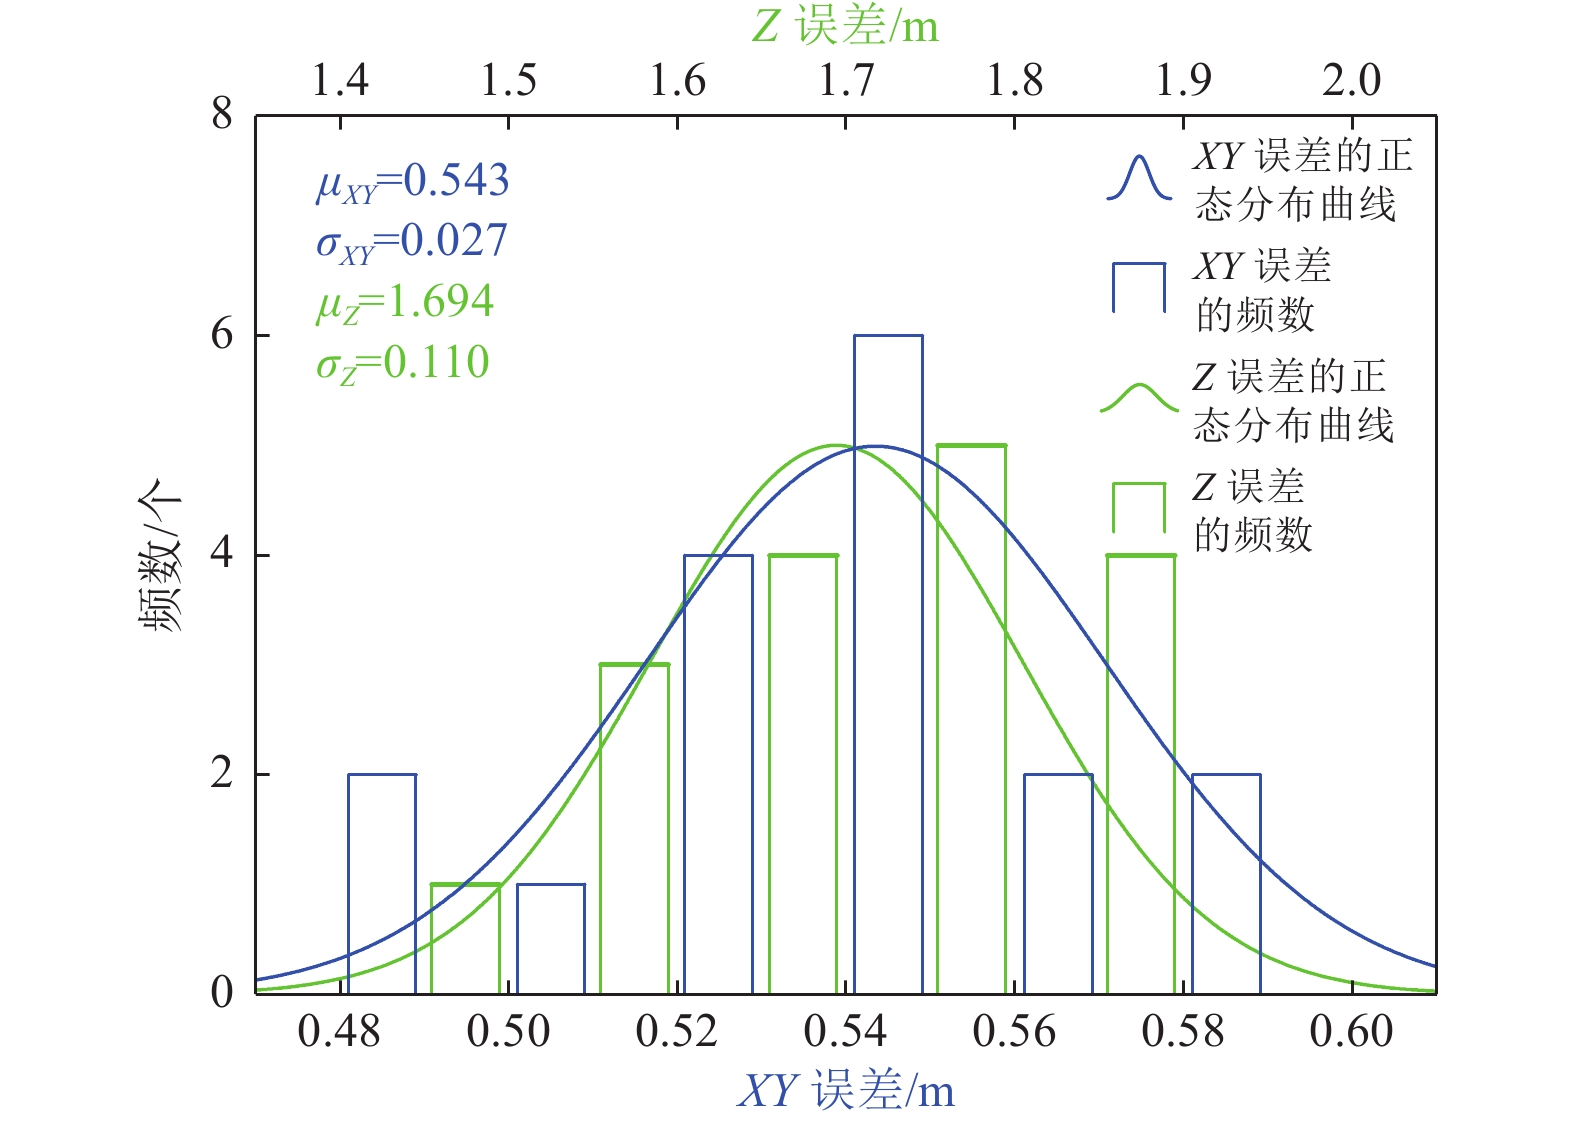
图 4 无控制点情况下检查点各变量误差分布直方图及正态分布曲线
Figure 4. Histogram and normal distribution curve of error distribution of each variable at checkpoint without control point
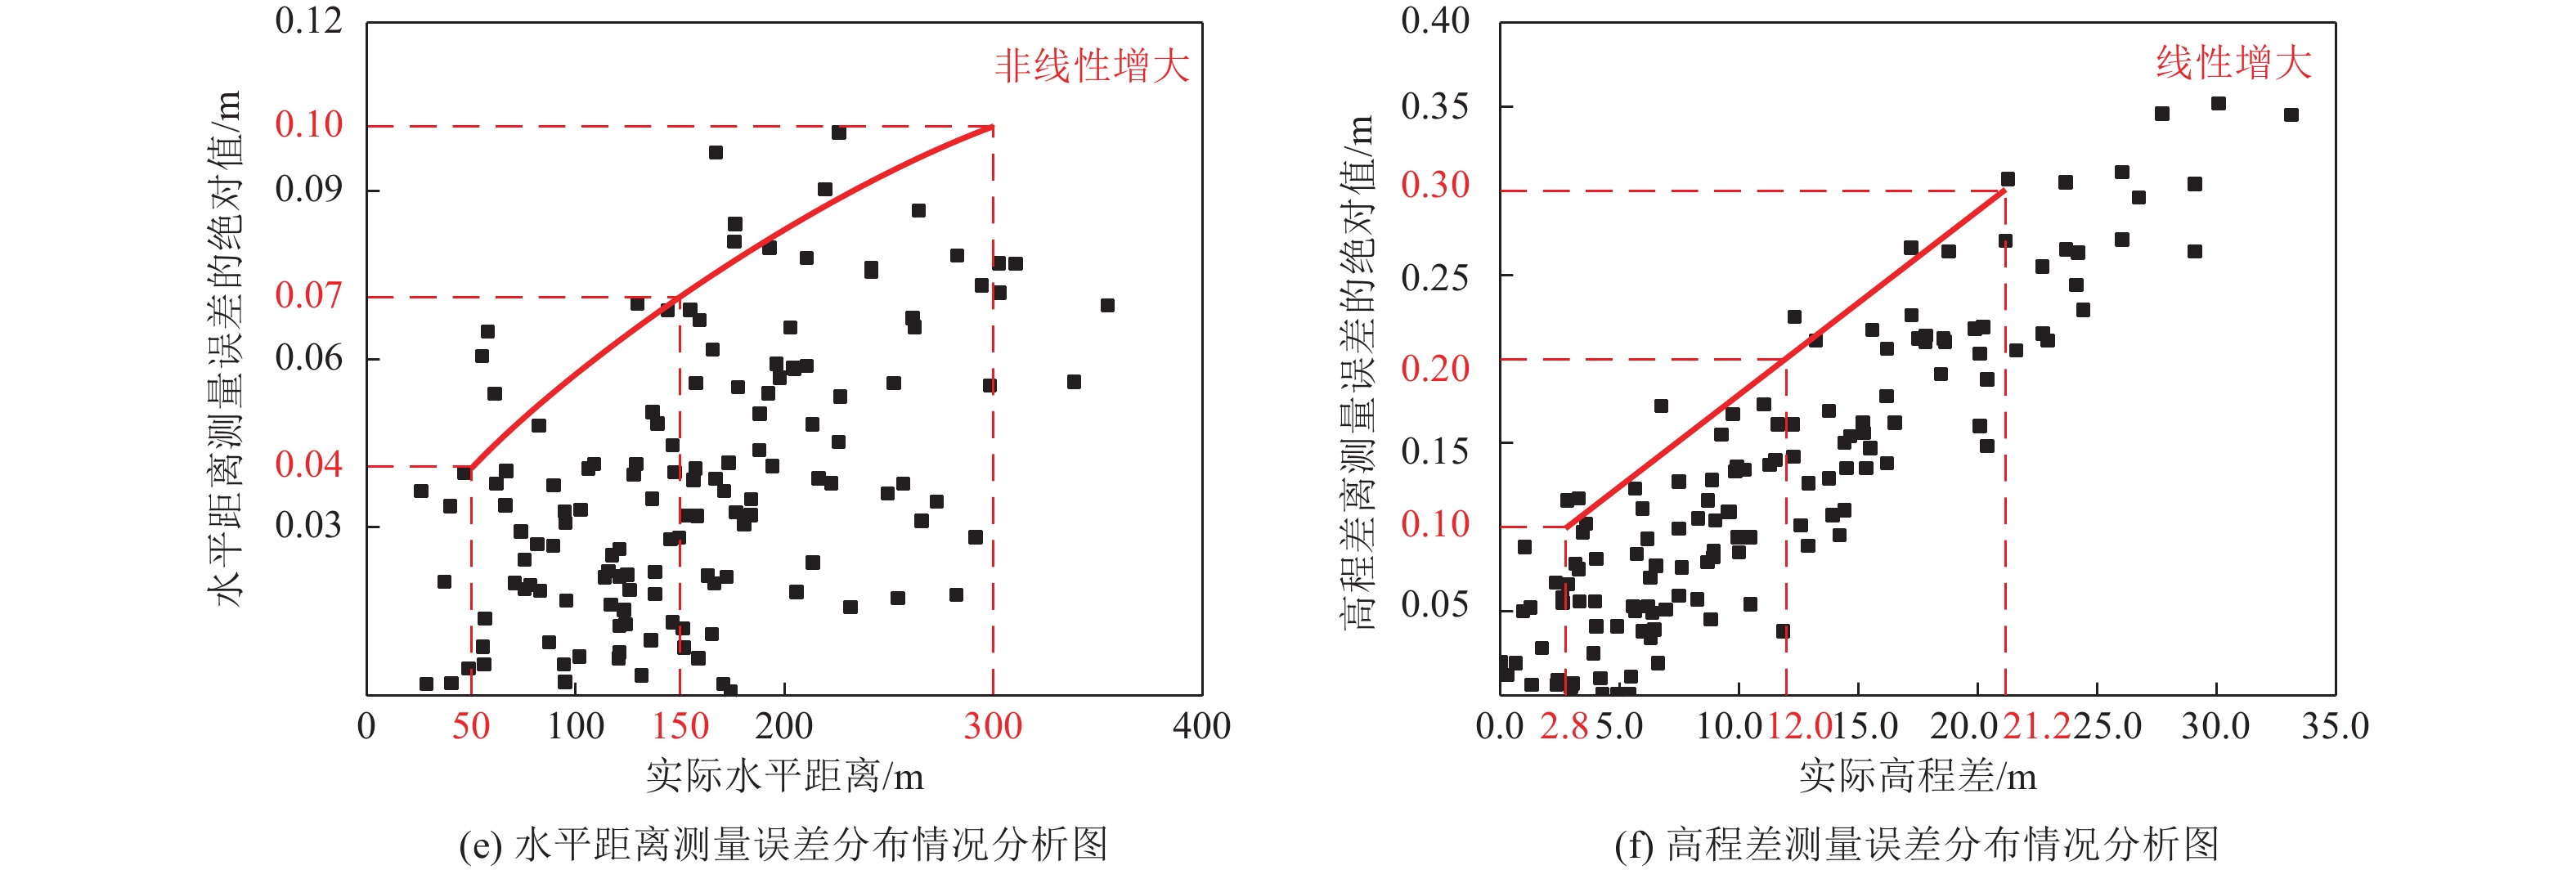
5 无控制点情况下水平距离和高程差测量误差分析
5. Measurement error analysis of horizontal distance and elevation difference without control point
表 1 有控制点情况下的误差分析结果
Table 1. Error analysis results of control points and checkpoints with control point
控制点
编号X误差
/cmY误差
/cmXY误差
/cmZ误差
/cm检查点
编号X误差
/cmY误差
/cmXY误差
/cmZ误差
/cmK1 0.143 0.821 0.834 −0.208 J1 2.172 3.695 4.286 0.100 K2 −0.312 0.237 0.778 −0.345 J2 1.748 1.973 2.636 −0.700 K3 −0.330 −0.034 0.692 1.548 J3 −2.530 −1.634 3.012 −1.716 K4 −0.244 0.236 0.395 −2.303 J4 −1.683 −1.625 2.339 −1.579 K5 1.133 −0.313 0.529 0.219 J5 2.161 2.327 3.176 3.300 K6 0.597 1.411 1.757 2.349 J6 −1.740 −1.534 2.320 −1.538 K7 −0.623 −0.029 0.619 0.212 J7 −1.620 −2.188 2.722 1.500 K8 1.017 0.068 1.420 1.066 J8 −2.629 −0.314 2.648 1.000 K9 −1.255 0.402 0.445 1.018 J9 −3.329 −1.302 3.575 2.300 K10 −0.705 −0.328 0.392 −0.299 J10 1.424 2.337 2.737 −0.200 K11 −0.051 −0.690 0.331 −0.764 J11 −2.310 −2.935 3.735 1.500 K12 −0.324 −0.225 0.339 −0.958 J12 −2.764 −1.033 2.951 1.500 K13 −0.005 −0.529 1.176 −1.112 J13 0.808 0.240 0.843 2.300 K14 0.379 −1.716 1.532 −1.883 J14 −1.872 −2.067 2.789 −1.400 K15 −0.422 0.454 0.624 2.221 J15 0.970 2.121 2.332 −0.300 K16 1.300 0.572 1.019 −0.026 J16 −0.241 1.862 1.878 2.200 K17 −0.295 −0.333 1.318 −0.810 J17 −0.310 2.805 2.822 1.200 均值 0.537 0.494 0.835 1.020 均值 1.783 1.882 2.753 1.402 中误差 0.670 0.666 0.945 1.274 中误差 1.964 2.065 2.850 1.643 注:控制点和检查点的X误差、Y误差和Z误差均值为其绝对值的均值。  下载: 导出CSV
表 2 无控制点情况下检查点误差分析结果
Table 2. Error analysis results of checkpoint without control point
检查点
序号X误差
/mY误差
/mXY误差
/mZ误差
/m检查点
序号X误差
/mY误差
/mXY误差
/mZ误差
/mJ1 −0.352 −0.423 0.550 −1.843 J11 −0.318 −0.453 0.553 −1.637 J2 −0.328 −0.416 0.530 −1.707 J12 −0.321 −0.444 0.548 −1.631 J3 −0.361 −0.460 0.585 −1.716 J13 −0.274 −0.415 0.497 −1.578 J4 −0.339 −0.443 0.558 −1.579 J14 −0.281 −0.450 0.530 −1.804 J5 −0.299 −0.384 0.487 −1.497 J15 −0.281 −0.450 0.531 −1.842 J6 −0.306 −0.430 0.528 −1.538 J16 −0.340 −0.445 0.560 −1.849 J7 −0.313 −0.451 0.549 −1.632 J17 −0.360 −0.432 0.562 −1.793 J8 −0.348 −0.453 0.572 −1.741 均值 0.320 0.439 0.543 1.694 J9 −0.325 −0.482 0.582 −1.726 中误差 0.321 0.439 0.544 1.698 J10 −0.293 −0.425 0.517 −1.688 注:控制点和检查点的X误差、Y误差和Z误差均值为其绝对值的均值。
下载: 导出CSV
表 3 强震造成地表破裂的参数表
Table 3. Parameter table of surface rupture caused by strong earthquake
序号 发震时间 地点 震级/M 发震断层性质 地表破裂 水平位移量/m 垂直位错量/m 1 1607-07-12 甘肃酒泉 7¼ 逆—左旋 3.0 1.0 2 1679-09-02 三河平谷 8 右旋—正 3.9 3.2 3 1709-10-14 宁夏中卫南 7½ 逆—左旋 5.0~6.0 1.0~2.0 4 1713-02-26 云南寻甸 6¾ 正—左旋 2.3 2.0 5 1739-01-03 宁夏银川、平罗 8 正—右旋 1.5 0.9 6 1902-08-22 新疆阿图什 8¼ 左旋—逆 20.0 5.0 7 1920-12-16 宁夏海原 8.5 逆—左旋 10.0~11.0 7.0~8.0 8 1927-05-23 甘肃古浪 8.0 逆—左旋 6.0 7.1 9 1933-08-25 四川叠溪 7.5 逆—左旋 5.0 3.0~4.0 10 1937-01-07 青海托索湖 7.5 逆—左旋 8.0 5.0~6.0 11 1947-03-17 青海达日 7.7 逆—左旋 5.0~10.0 5.0~6.0 12 1951-11-18 西藏当雄 8.0 正—右旋 7.3 1.5 13 1952-08-18 西藏那曲西南 7.5 左旋—正 5.0 5.5 14 1954-02-11 甘肃山丹 7¼ 右旋—正 2.9~4.0 1.0~1.2 15 1970-01-05 云南通海 7.8 逆—右旋 3.3 0.5 16 1985-08-23 新疆乌恰 7.4 右旋—逆 1.6 1.6 17 1996-02-03 云南丽江 7.0 左旋—正 0.3 0.3 18 2008-03-21 新疆于田 7.3 左旋—正 1.8 2.0 19 2008-05-12 四川汶川 8.0 右旋—逆 4.0~5.0 4.0~5.0 20 2021-5-22 青海玛多 7.4 逆—左旋 2.9~4.0 1.0~2.0 注:数据源自张维岐等,1988;邓起东等,1989;国家地震局地质研究所等,1990;黄静宜,2016;潘家伟等,2021;王未来等,2021。
下载: 导出CSV
-
[1] 程理, 苏刚, 李光涛等, 2019. 云南中甸-大具断裂上新发现的地震地表破裂带. 震灾防御技术, 14(4): 797—809 doi: 10.11899/zzfy20190411Cheng L. , Su G. , Li G. T. , et al. , 2019. New finding of earthquake surface rupture on Zhongdian-Daju fault. Technology for Earthquake Disaster Prevention, 14(4): 797—809. (in Chinese) doi: 10.11899/zzfy20190411 [2] 邓起东, 张维岐, 张培震等, 1989. 海原走滑断裂带及其尾端挤压构造. 地震地质, 11(1): 1—14.Deng Q. D. , Zhang W. Q. , Zhang P. Z. , et al. , 1989. Haiyuan strike-slip fault zone and its compressional structures of the end. Seismology and Geology, 11(1): 1—14. (in Chinese) [3] 邓起东, 于贵华, 叶文华, 1992. 地震地表破裂参数与震级关系的研究. 北京: 地震出版社.Deng Q. D. , Yu G. H. , Ye W. H. , 1992. Relationship between earthquake magnitude and parameters of surface ruptures associated with historical earthquakes. Beijing: Seismological Press. (in Chinese) [4] 国家地震局地质研究所, 宁夏回族自治区地震局, 1990. 海原活动断裂带. 北京: 地震出版社. [5] 李伟, 张红月, 孙衍建等, 2021. 地区级实景三维模型色彩均衡方法实验. 山东国土资源, 37(7): 86—90Li W. , Zhang H. Y. , Sun Y. J. , et al. , 2021. Experiment on color equalization method of regional real scene 3D model. ShangDong Land and Resources, 37(7): 86—90. (in Chinese) [6] 黄静宜, 2016. 强震地表破裂评估方法研究. 哈尔滨: 中国地震局工程力学研究所.Huang J. Y., 2016. Research on the method for evaluating the earthquake surface rupture. Harbin: Institute of Engineering Mechanics, China Earthquake Administration. (in Chinese) [7] 李冀, 熊晶, 熊保颂等, 2021. 便携式消费级无人机相机标定有效性评估. 测绘通报, (4): 131—135Li J. , Xiong J. , Xiong B. S. , et al. , 2021. Effectiveness evaluation of camera calibration for portable consumer UAV. Bulletin of Surveying and Mapping, (4): 131—135. (in Chinese) [8] 刘超, 雷启云, 余思汗等, 2021a. 基于无人机摄影测量技术的地震地表破裂带定量参数提取——以1709年中卫南M7½地震为例. 地震学报, 43(1): 113—123Liu C. , Lei Q. Y. , Yu S. H. , et al. , 2021a. Using UAV photogrammetry technology to extract the quantitative parameters of earthquake surface rupture zone: a case study of the southern Zhongwei M7½ earthquake in 1709. Acta Seismologica Sinica, 43(1): 113—123. (in Chinese) [9] 刘超, 杜鹏, 王银等, 2021b. 基于无人机摄影测量技术研究有无地面控制点的差异性在地震方面的应用. 华南地震, 41(1): 84—93Liu C. , Du P. , Wang Y. , et al. , 2021b. Research on the application of the difference with or without ground control points in earthquake based on UAV photogrammetry technology. South China Journal of Seismology, 41(1): 84—93. (in Chinese) [10] 潘家伟, 白明坤, 李超等, 2021.2021年5月22日青海玛多MS7.4地震地表破裂带及发震构造. 地质学报, 95(6): 1655—1670 doi: 10.3969/j.issn.0001-5717.2021.06.001Pan J. W. , Bai M. K. , Li C. , et al. , 2021. Coseismic surface rupture and seismogenic structure of the 2021-05-22 Maduo (Qinghai) MS7.4 earthquake. Acta Geologica Sinica, 95(6): 1655—1670. (in Chinese) doi: 10.3969/j.issn.0001-5717.2021.06.001 [11] 王未来, 房立华, 吴建平等, 2021. 2021年青海玛多MS7.4地震序列精定位研究. 中国科学: 地球科学, 51(7): 1193—1202.Wang W. L., Fang L. H., Wu J. P., et al., 2021. Aftershock sequence relocation of the 2021 MS7.4 Maduo earthquake, Qinghai, China. Science China Earth Sciences, 64(8): 1371—1380. (in Chinese) [12] 魏占玉, Ramon A, 何宏林等, 2015. 基于SfM方法的高密度点云数据生成及精度分析. 地震地质, 37(2): 636—648 doi: 10.3969/j.issn.0253-4967.2015.02.024Wei Z. Y. , Ramon A. , He H. L. , et al. , 2015. Accuracy analysis of terrain point cloud acquired by “Structure from Motion” using aerial photos. Seismology and Geology, 37(2): 636—648. (in Chinese) doi: 10.3969/j.issn.0253-4967.2015.02.024 [13] 熊保颂, 2020. 基于便携式无人机SfM方法的活动构造地貌位错测量应用研究. 武汉: 中国地震局地震研究所.Xiong B. S., 2020. Offset measurement along active fault based on portable UAV and structure from motion. Wuhan: Institute of Seismology, China Earthquake Administration. (in Chinese) [14] 熊保颂, 李雪, 2020. 基于便携式无人机SfM方法的活动构造地貌位错测量——以阿尔金断裂中段为例. 科学技术与工程, 20(26): 10848—10855. doi: 10.3969/j.issn.1671-1815.2020.26.044Xiong B. S. , Li X. , 2020. Offset measurement along active fault based on portable unmanned aerial vehicle and structure from motion: a case study of the middle section in Altyn-Tagh fault. Science Technology and Engineering, 20(26): 10848—10855. (in Chinese) doi: 10.3969/j.issn.1671-1815.2020.26.044 [15] 张维岐, 焦德成, 柴炽章等, 1988. 宁夏香山-天景山弧形断裂带新活动特征及1709年中卫南7½级地震形变带. 地震地质, 10(3): 12—20Zhang W. Q. , Jiao D. C. , Chai C. Z. , et al. , 1988. Neotectonic features of the Xiangshan-Tianjingshan arc fracture zone and the seismic deformation zone of 1709 south of Zhongwei M=7½ earthquake. Seismology and Geology, 10(3): 12—20. (in Chinese) [16] 赵云景, 龚绪才, 杜文俊等, 2015. PhotoScan Pro软件在无人机应急航摄中的应用. 国土资源遥感, 27(4);179—182.Zhao Y. J., Gong X. C., Du W. J., et al., 2015. UAV imagery data processing for emergency response based on PhotoScan Pro. Remote Sensing for Land & Resources, 27(4): 179—182. (in Chinese) [17] 中国地震局, 2019. DB/T 71—2018 活动断层探察 断错地貌测量. 北京: 中国标准出版社.China Earthquake Administration, 2019. DB/T 71—2018 Active fault survey—Measurement of faulted landform. Beijing: Standards Press of China. (in Chinese) [18] James M. R. , Robson S. , 2012. Straightforward reconstruction of 3D surfaces and topography with a camera: Accuracy and geoscience application. Journal of Geophysical Research: Earth Surface, 117(F3): F03017. [19] Lucieer A. , De Jong S. M. , Turner D. , 2014. Mapping landslide displacements using Structure from Motion (SfM) and image correlation of multi-temporal UAV photography. Progress in Physical Geography: Earth and Environment, 38(1): 97—116. [20] Ryan J. C. , Hubbard A. L. , Box J. E. , et al. , 2015. UAV photogrammetry and structure from motion to assess calving dynamics at Store Glacier, a large outlet draining the Greenland ice sheet. The Cryosphere, 9(1): 1—11. [21] Snavely N. , Seitz S. M. , Szeliski R. , 2008. Modeling the world from internet photo collections. International Journal of Computer Vision, 80(2): 189—210. -


 点击查看大图
计量
- 文章访问数: 309
- HTML全文浏览量: 93
- PDF下载量: 19
- 被引次数: 0
