Calculations of b Value in Qaidam Basin—Altun Seismic Belt
-
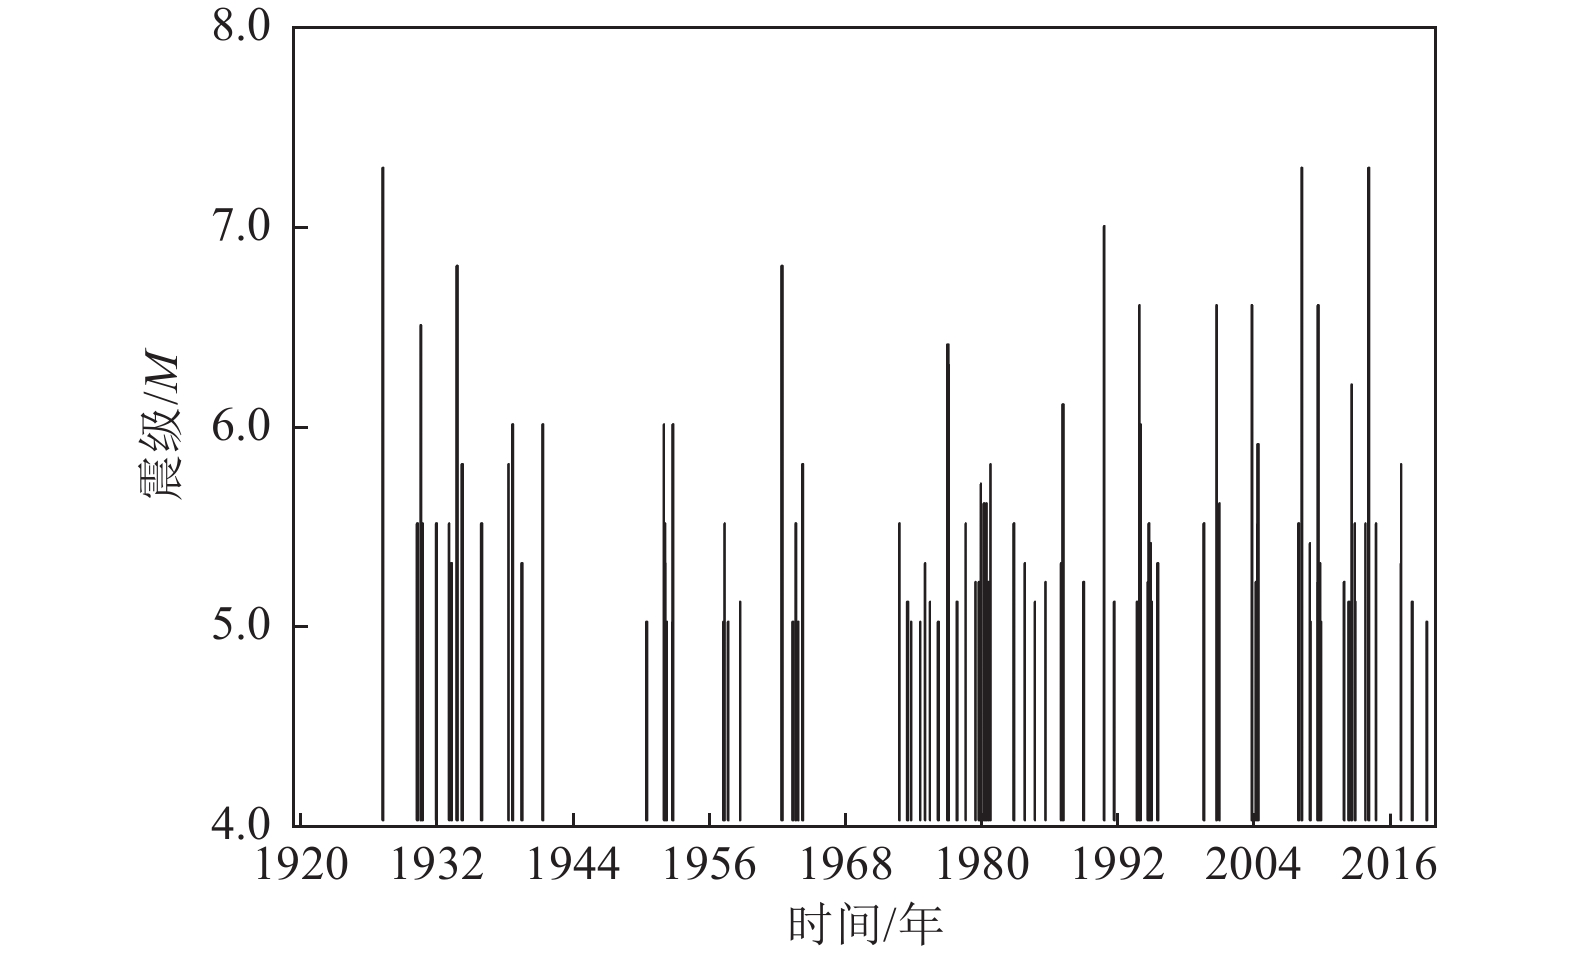
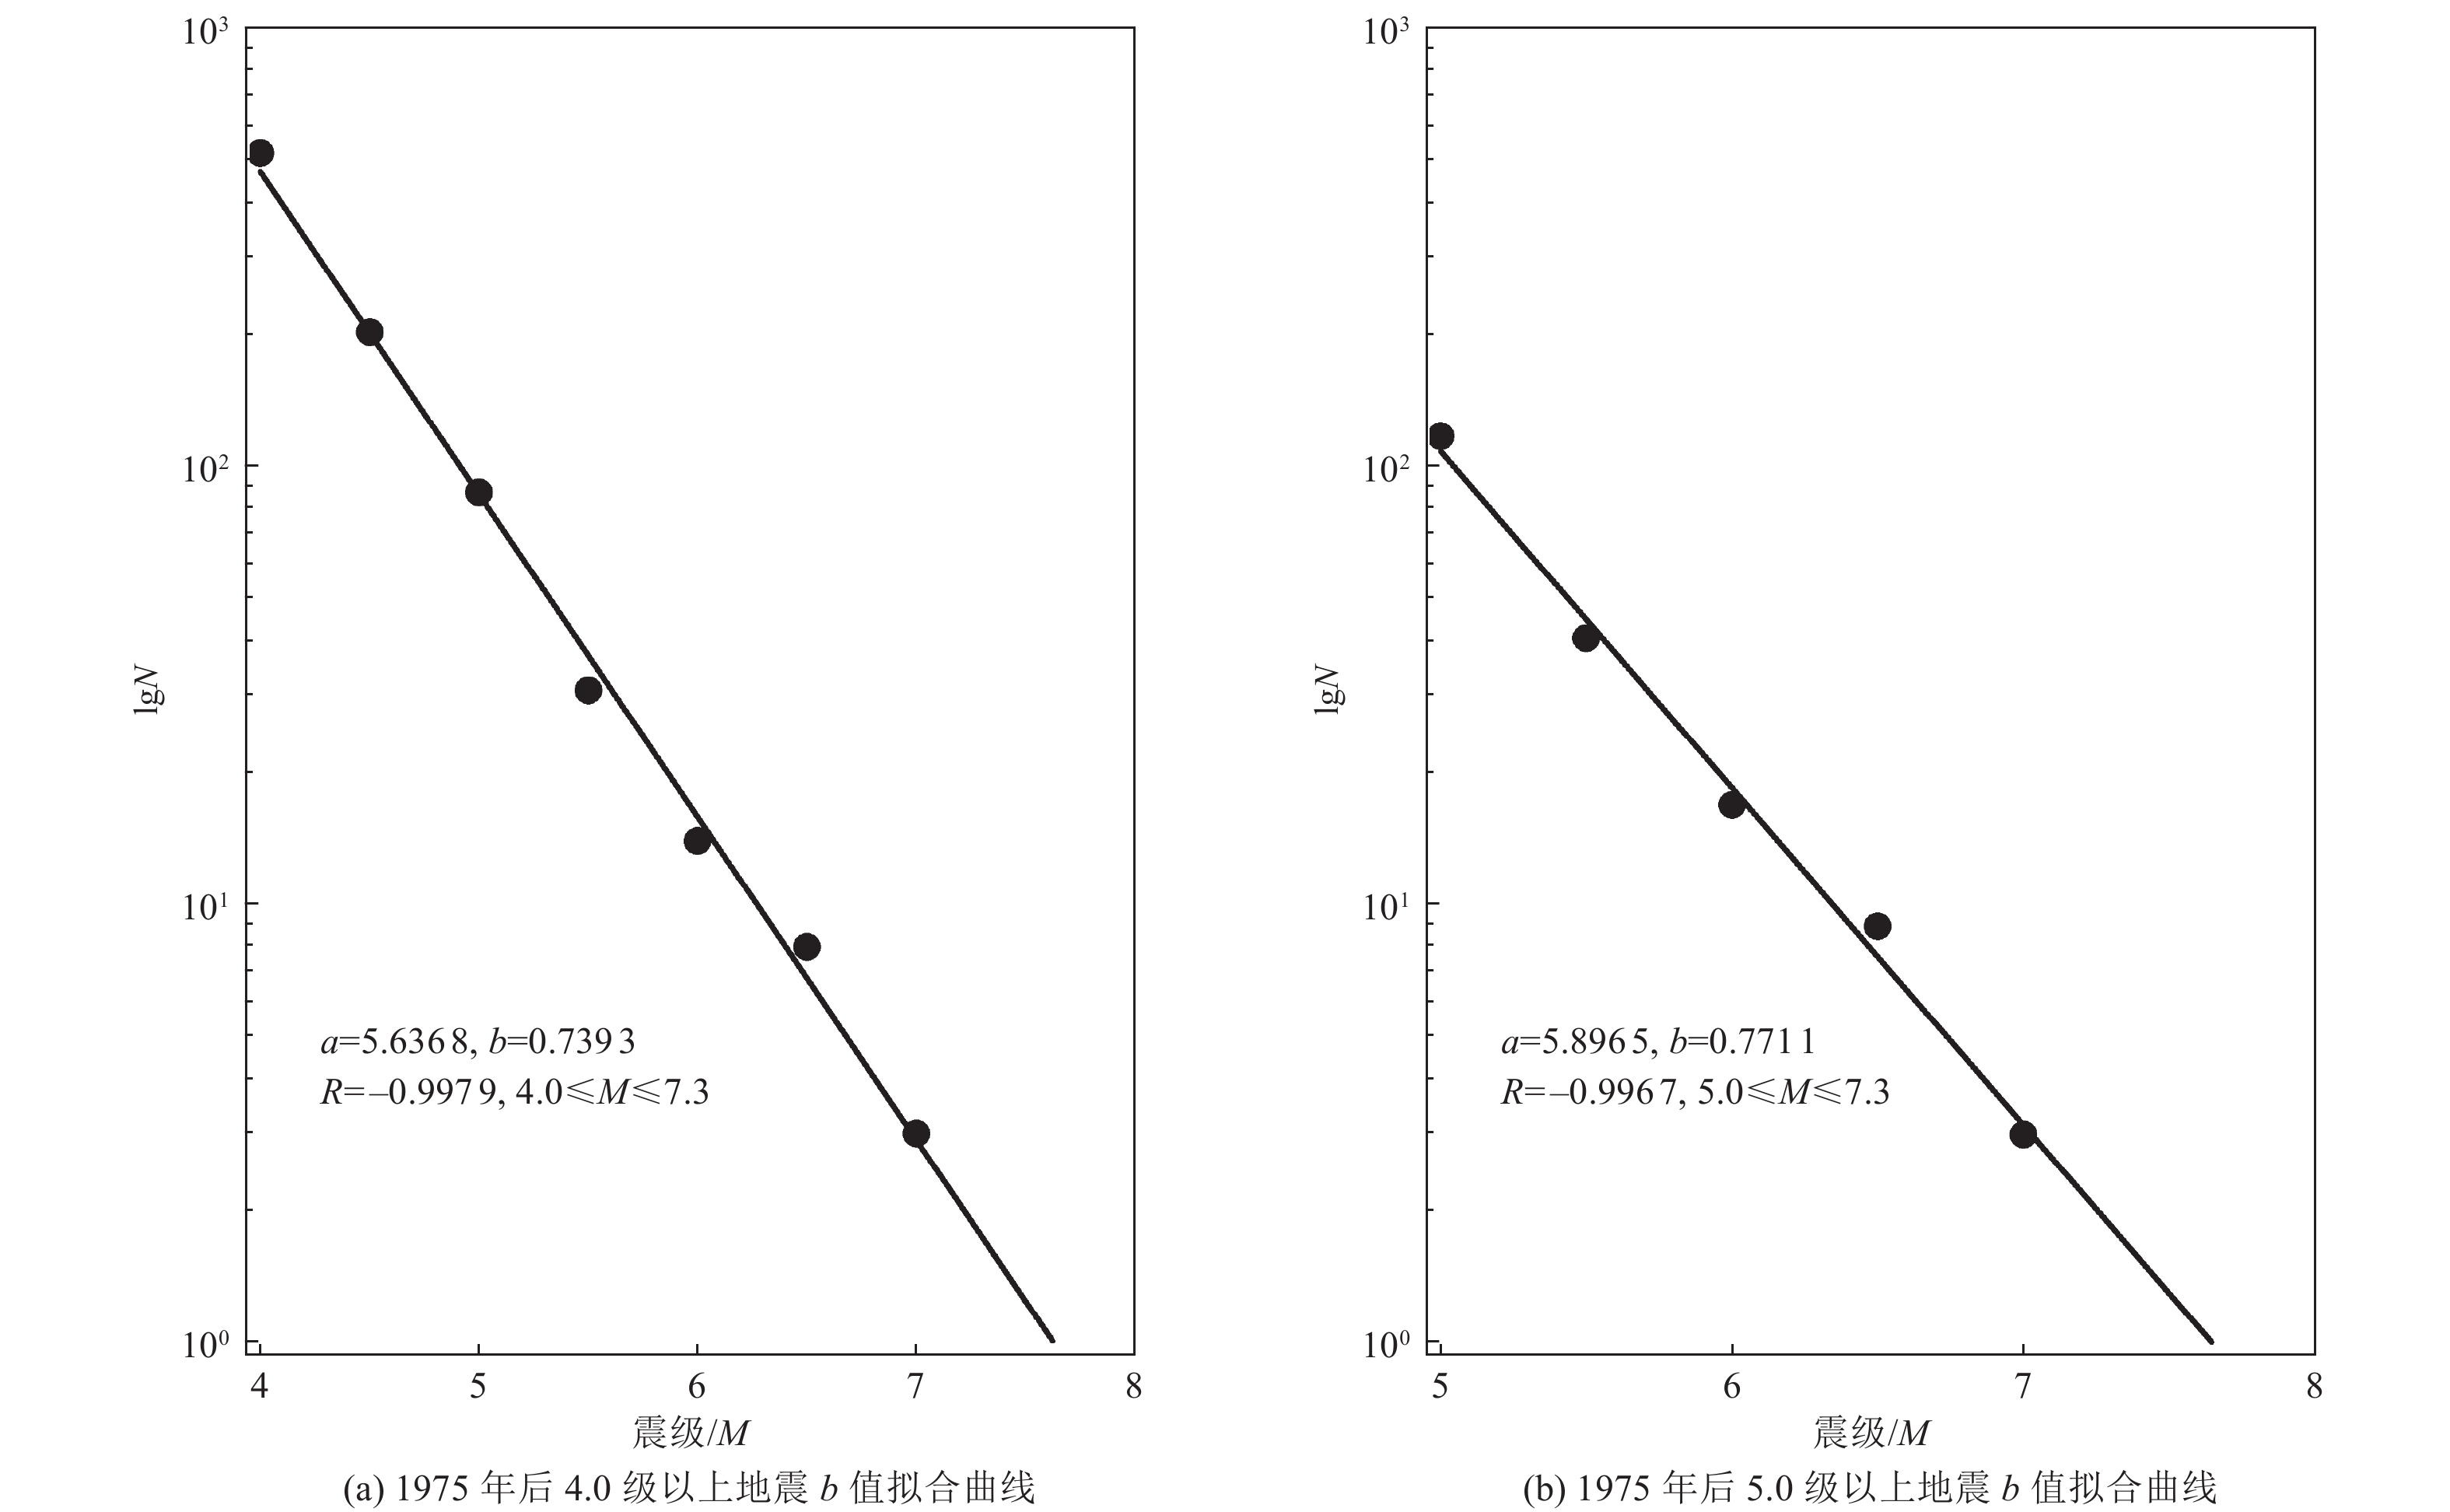
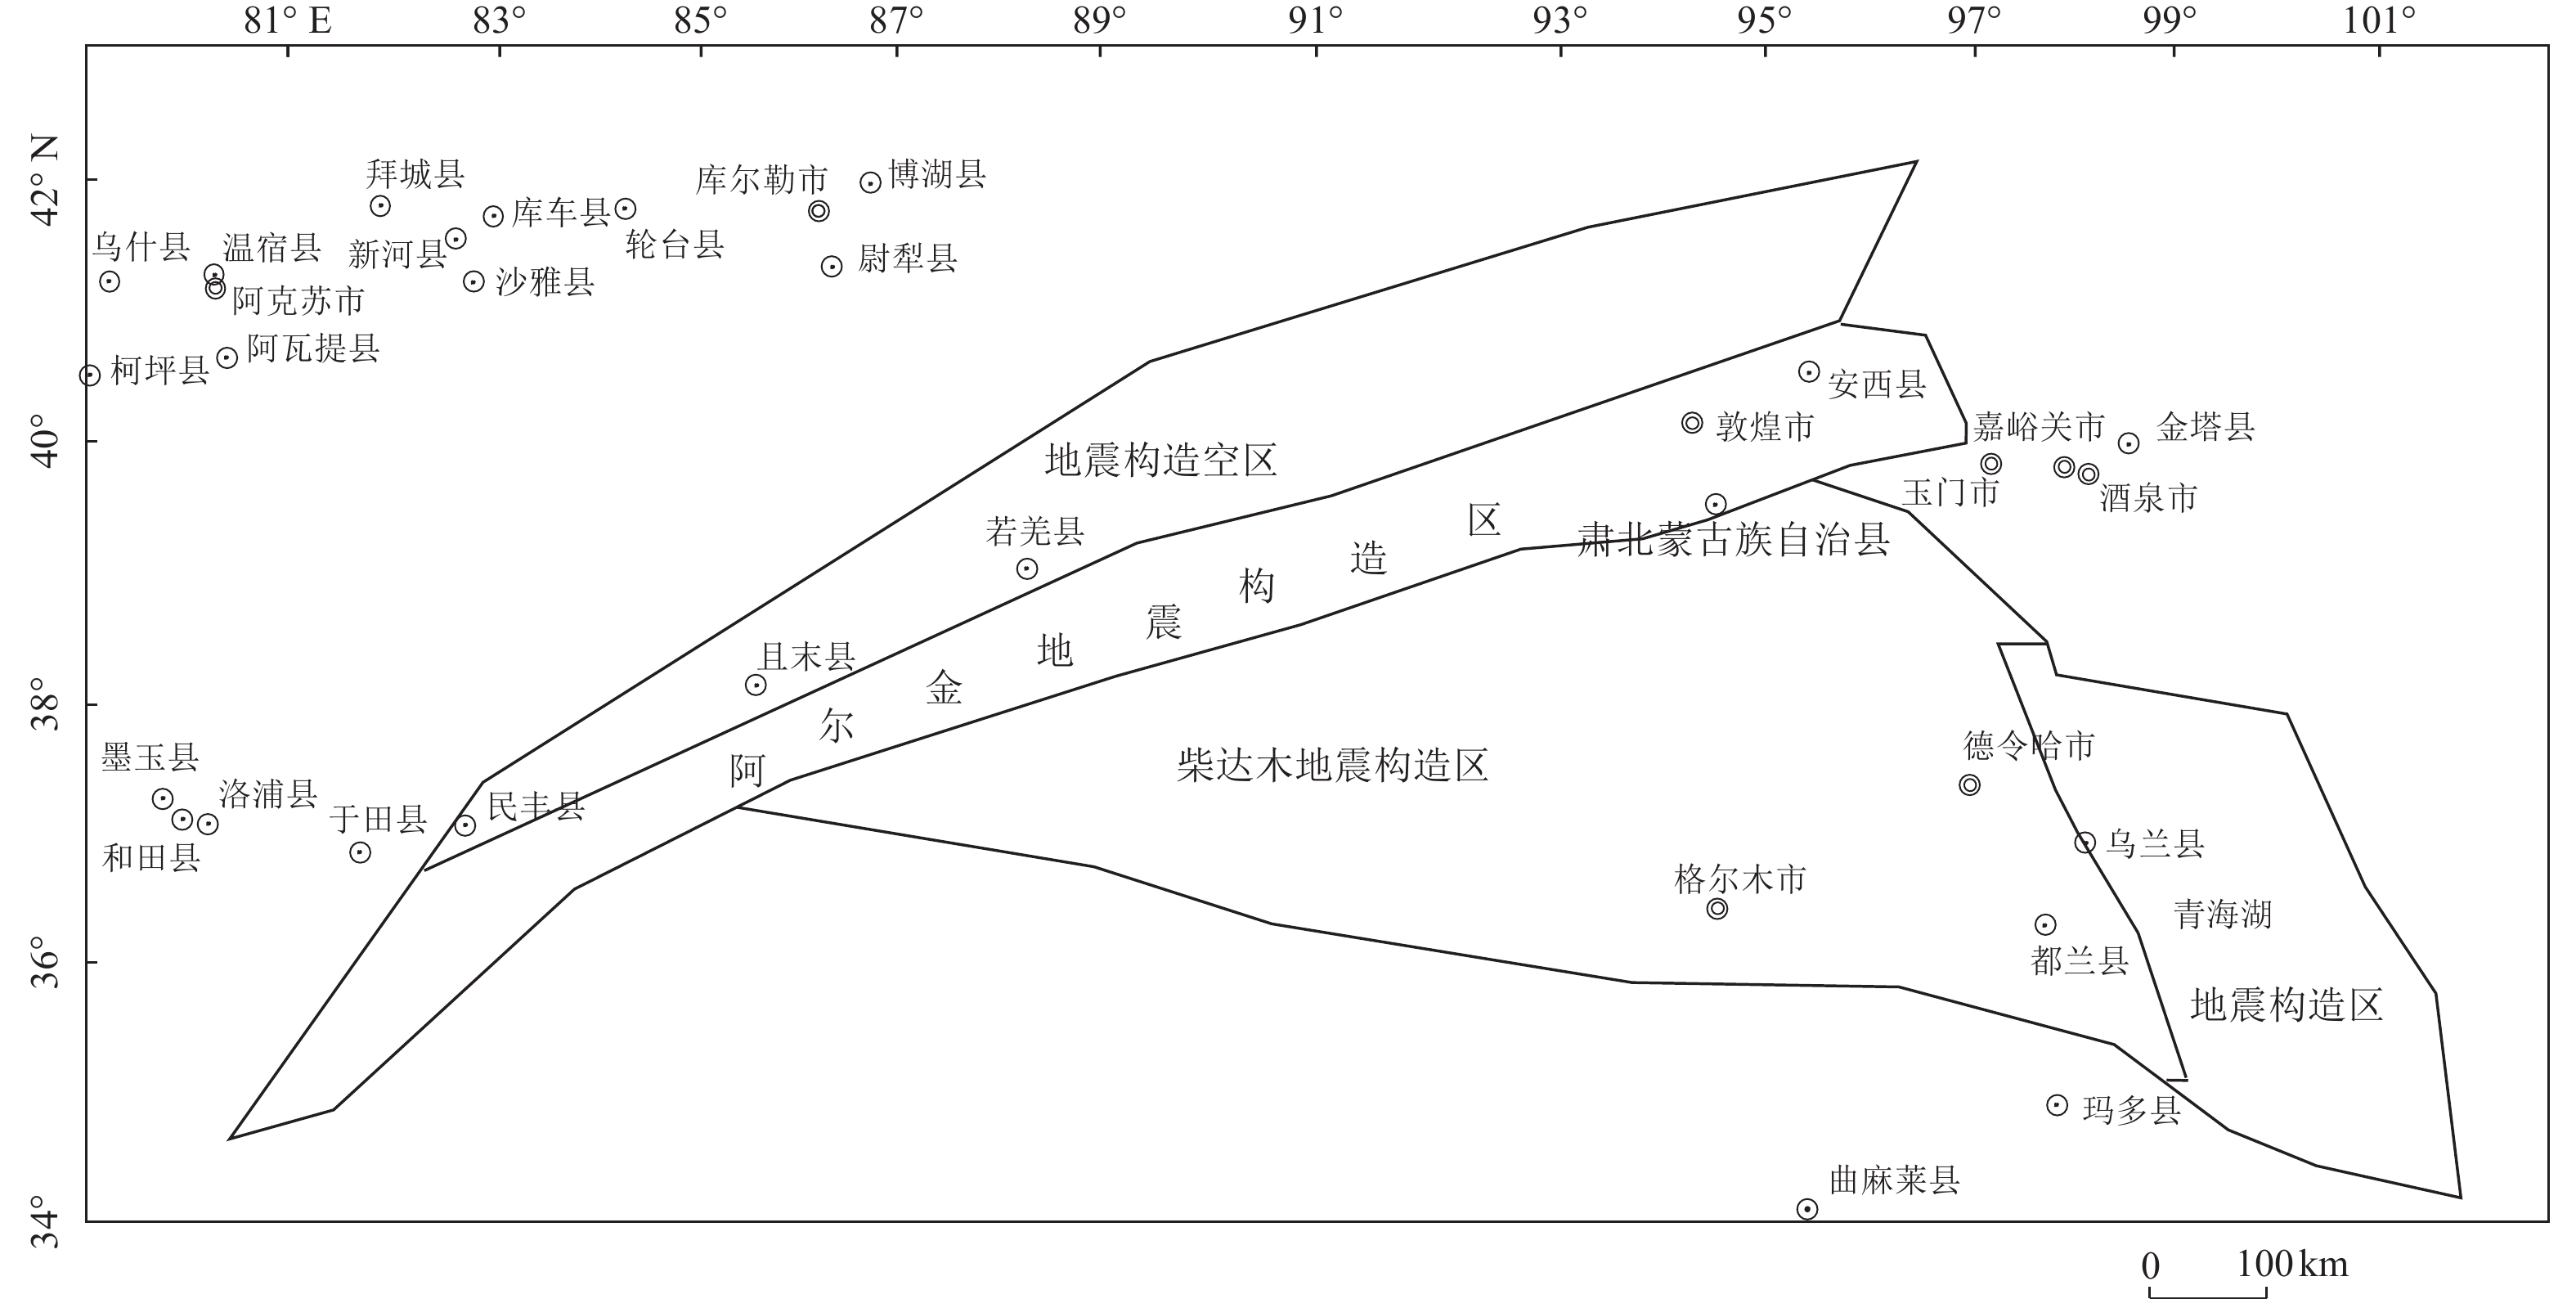
摘要: 目前工程地震中使用的b值来源于《中国地震动参数区划图》(GB 18306—2015),地震资料仅考虑至2010年,距今有10多年的地震资料缺失,在此期间柴达木—阿尔金地震带发生了7级以上强震,因此需验证该地区b值是否体现高震级段地震危险性水平。为此,利用1920—2019年地震资料,对柴达木—阿尔金地震带b值进行统计研究,确定b值为0.76。根据该地震带不同构造区提取地震目录,按照震级完整时段计算各自b值,得到b值范围为0.536 5~0.801 9,最大差值为0.272 6,该结果低于《中国地震动参数区划图》(GB 18306—2015)确定的b值,体现了近期大地震的发生对该地震带活动强度和大震重现期等地震活动特征和活动水平的影响,本研究确定的b值可作为《中国地震动参数区划图》(GB 18306—2015)的补充,可为科学建立重大建设工程地震危险性计算模型提供基础依据。
-
关键词:
- 柴达木—阿尔金地震带 /
- b值 /
- 最小二乘法 /
- 构造区
Abstract: At present, the b value used in engineering earthquakes comes from GB 18306—2015 "Seismic ground motion parameters zonation map of China". The seismic data for deriving b value is by 2010, and there has been an accumulation of seismic data for 10 years. A strong earthquake of magnitude 7 or more occurred during the period, therefore it is necessary to verify whether the b value in this area can reflect the seismic hazard level of the high-magnitude section. In this paper, based on seismic data in 1920—2019, the b value of the Qaidam—Altun seismic belt was calculated and analyzed, and the b value was determined to be 0.76. The earthquake catalogue was extracted according to the different structural areas of the belt, and the respective b values were calculated according to the full period of magnitude. The range of b values is (0.5365~0.8019), and the maximum difference is 0.272 6. The result is lower than the b value determined by GB 18306—2015, which reflects the impact of recent large earthquakes on the seismic activity intensity and return period of the seismic belt and other seismic activity characteristics and activity levels.As a supplement to GB 18306—2015, the b value determined in this paper can provide a scientific basis for the establishment of seismic hazard calculation model of major infrastructure.-
Key words:
- Qaidam Basin—altun seismic belt /
- b value /
- Least squares method /
- Structural areas
-
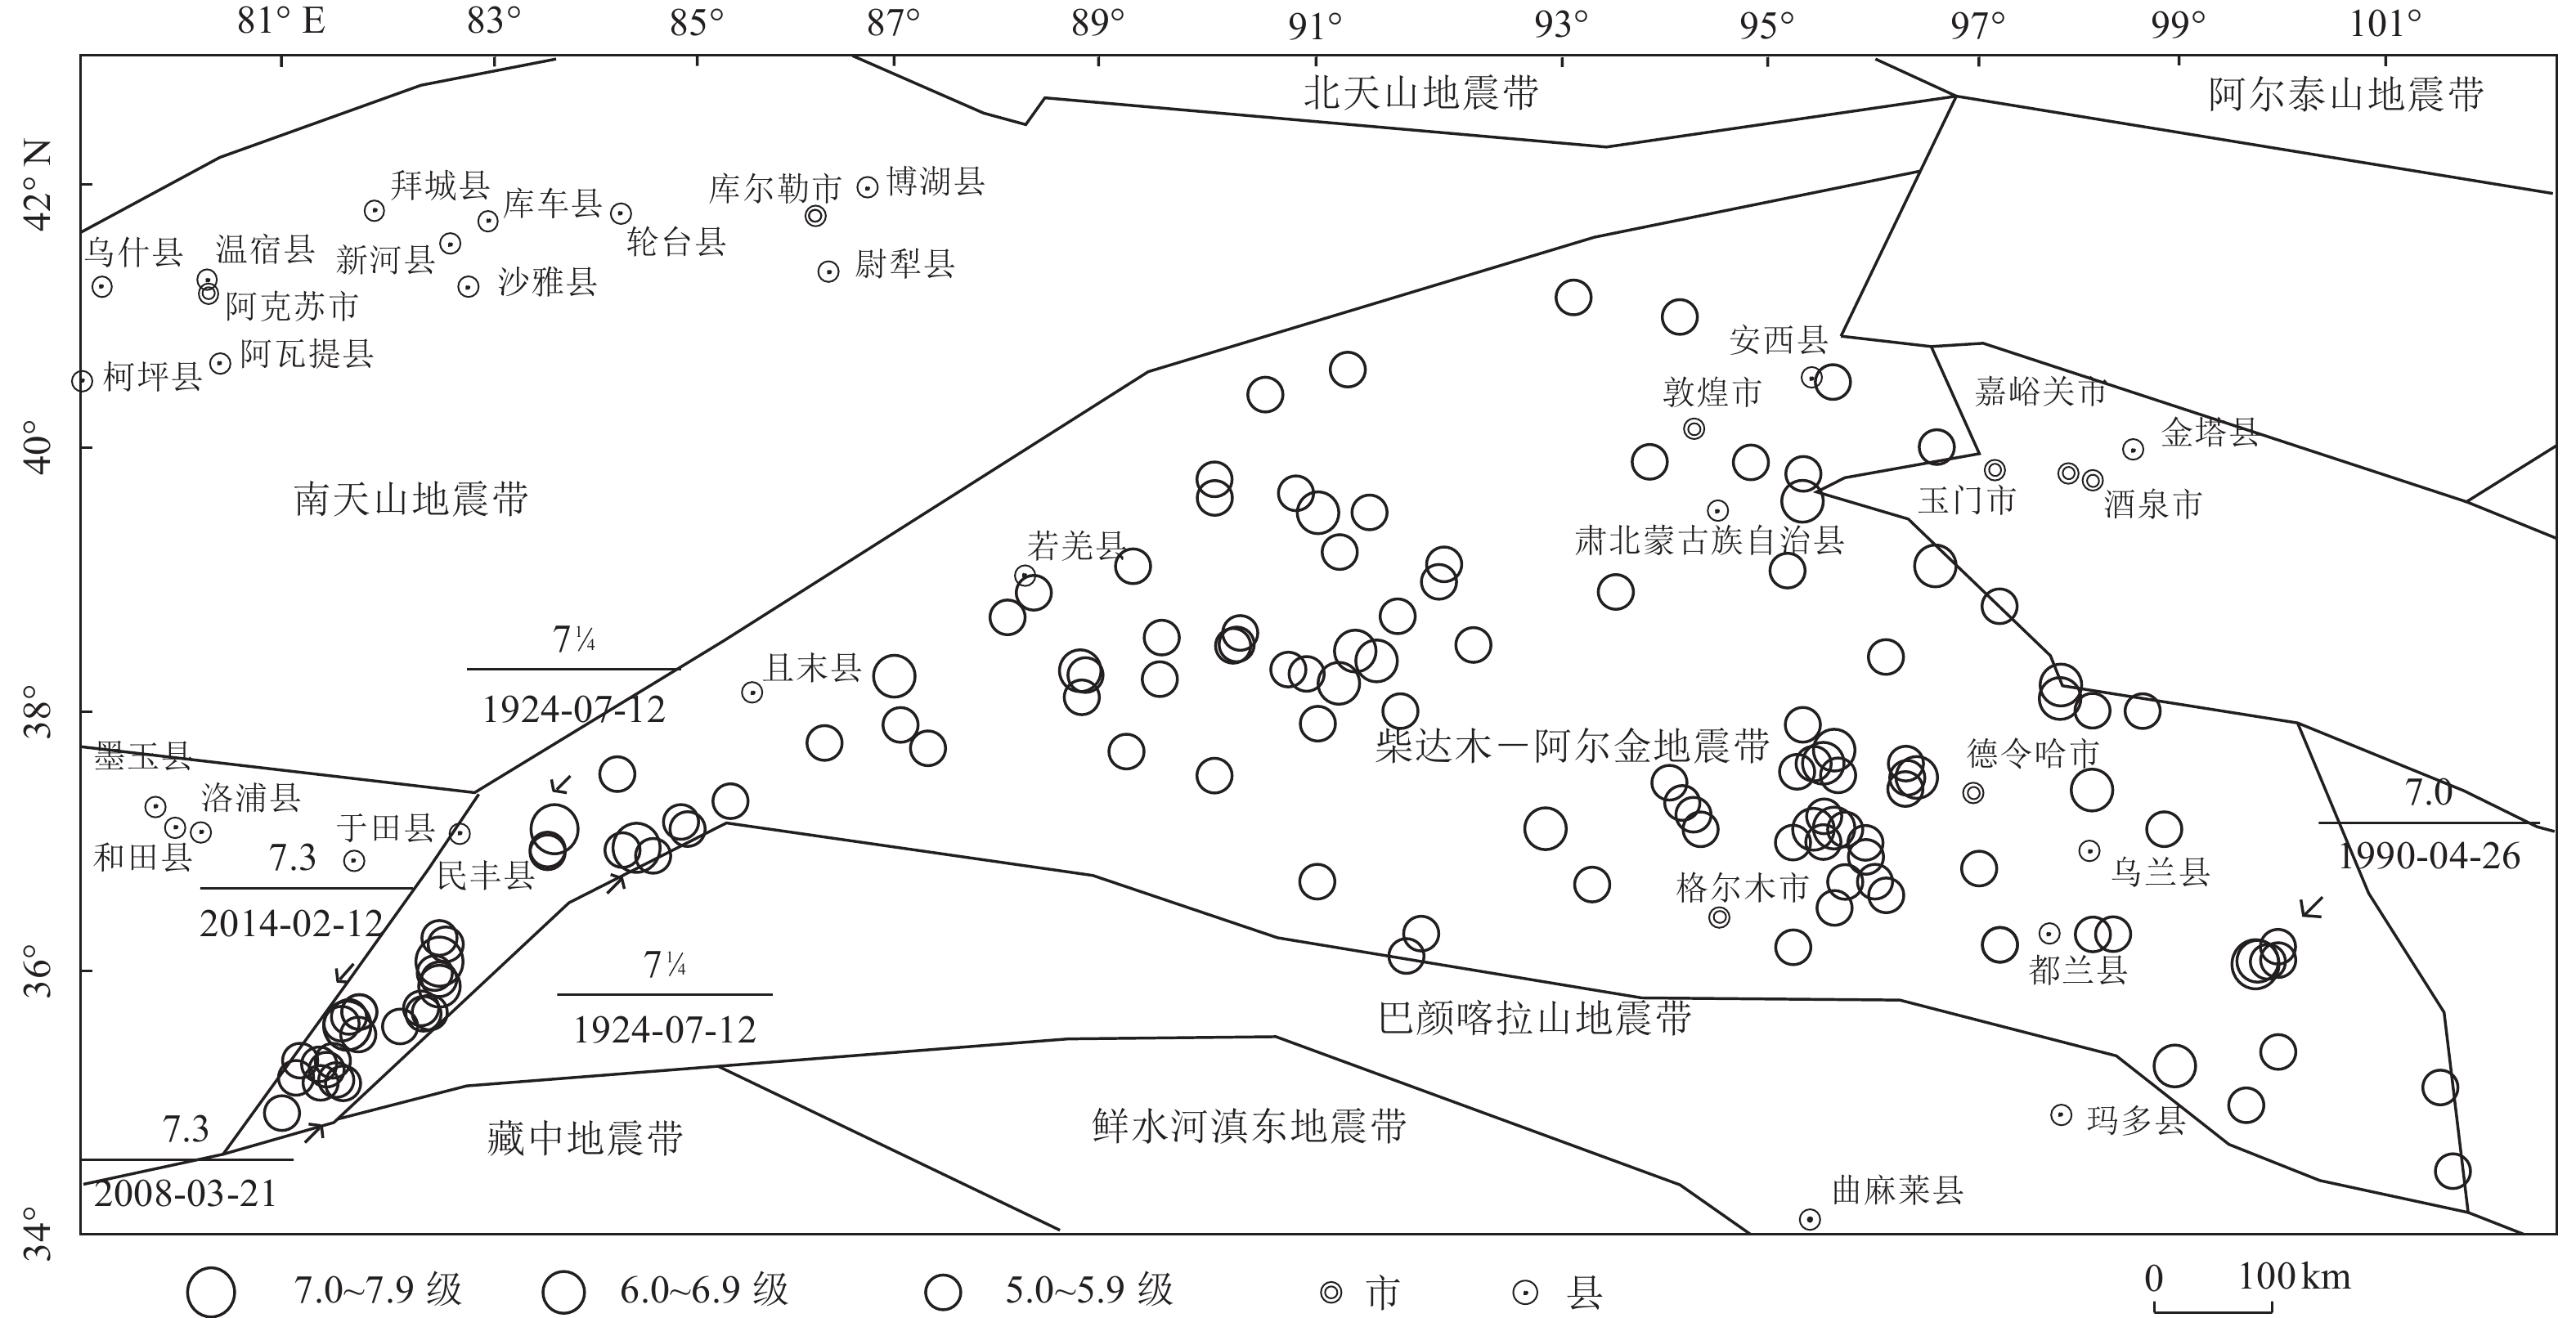
表 1 柴达木—阿尔金地震带1920—2019年M≥6.0地震目录
Table 1. Earthquake catalog M≥6.0 of Qaidam—Altun Seismic belt from 1920 to 2019
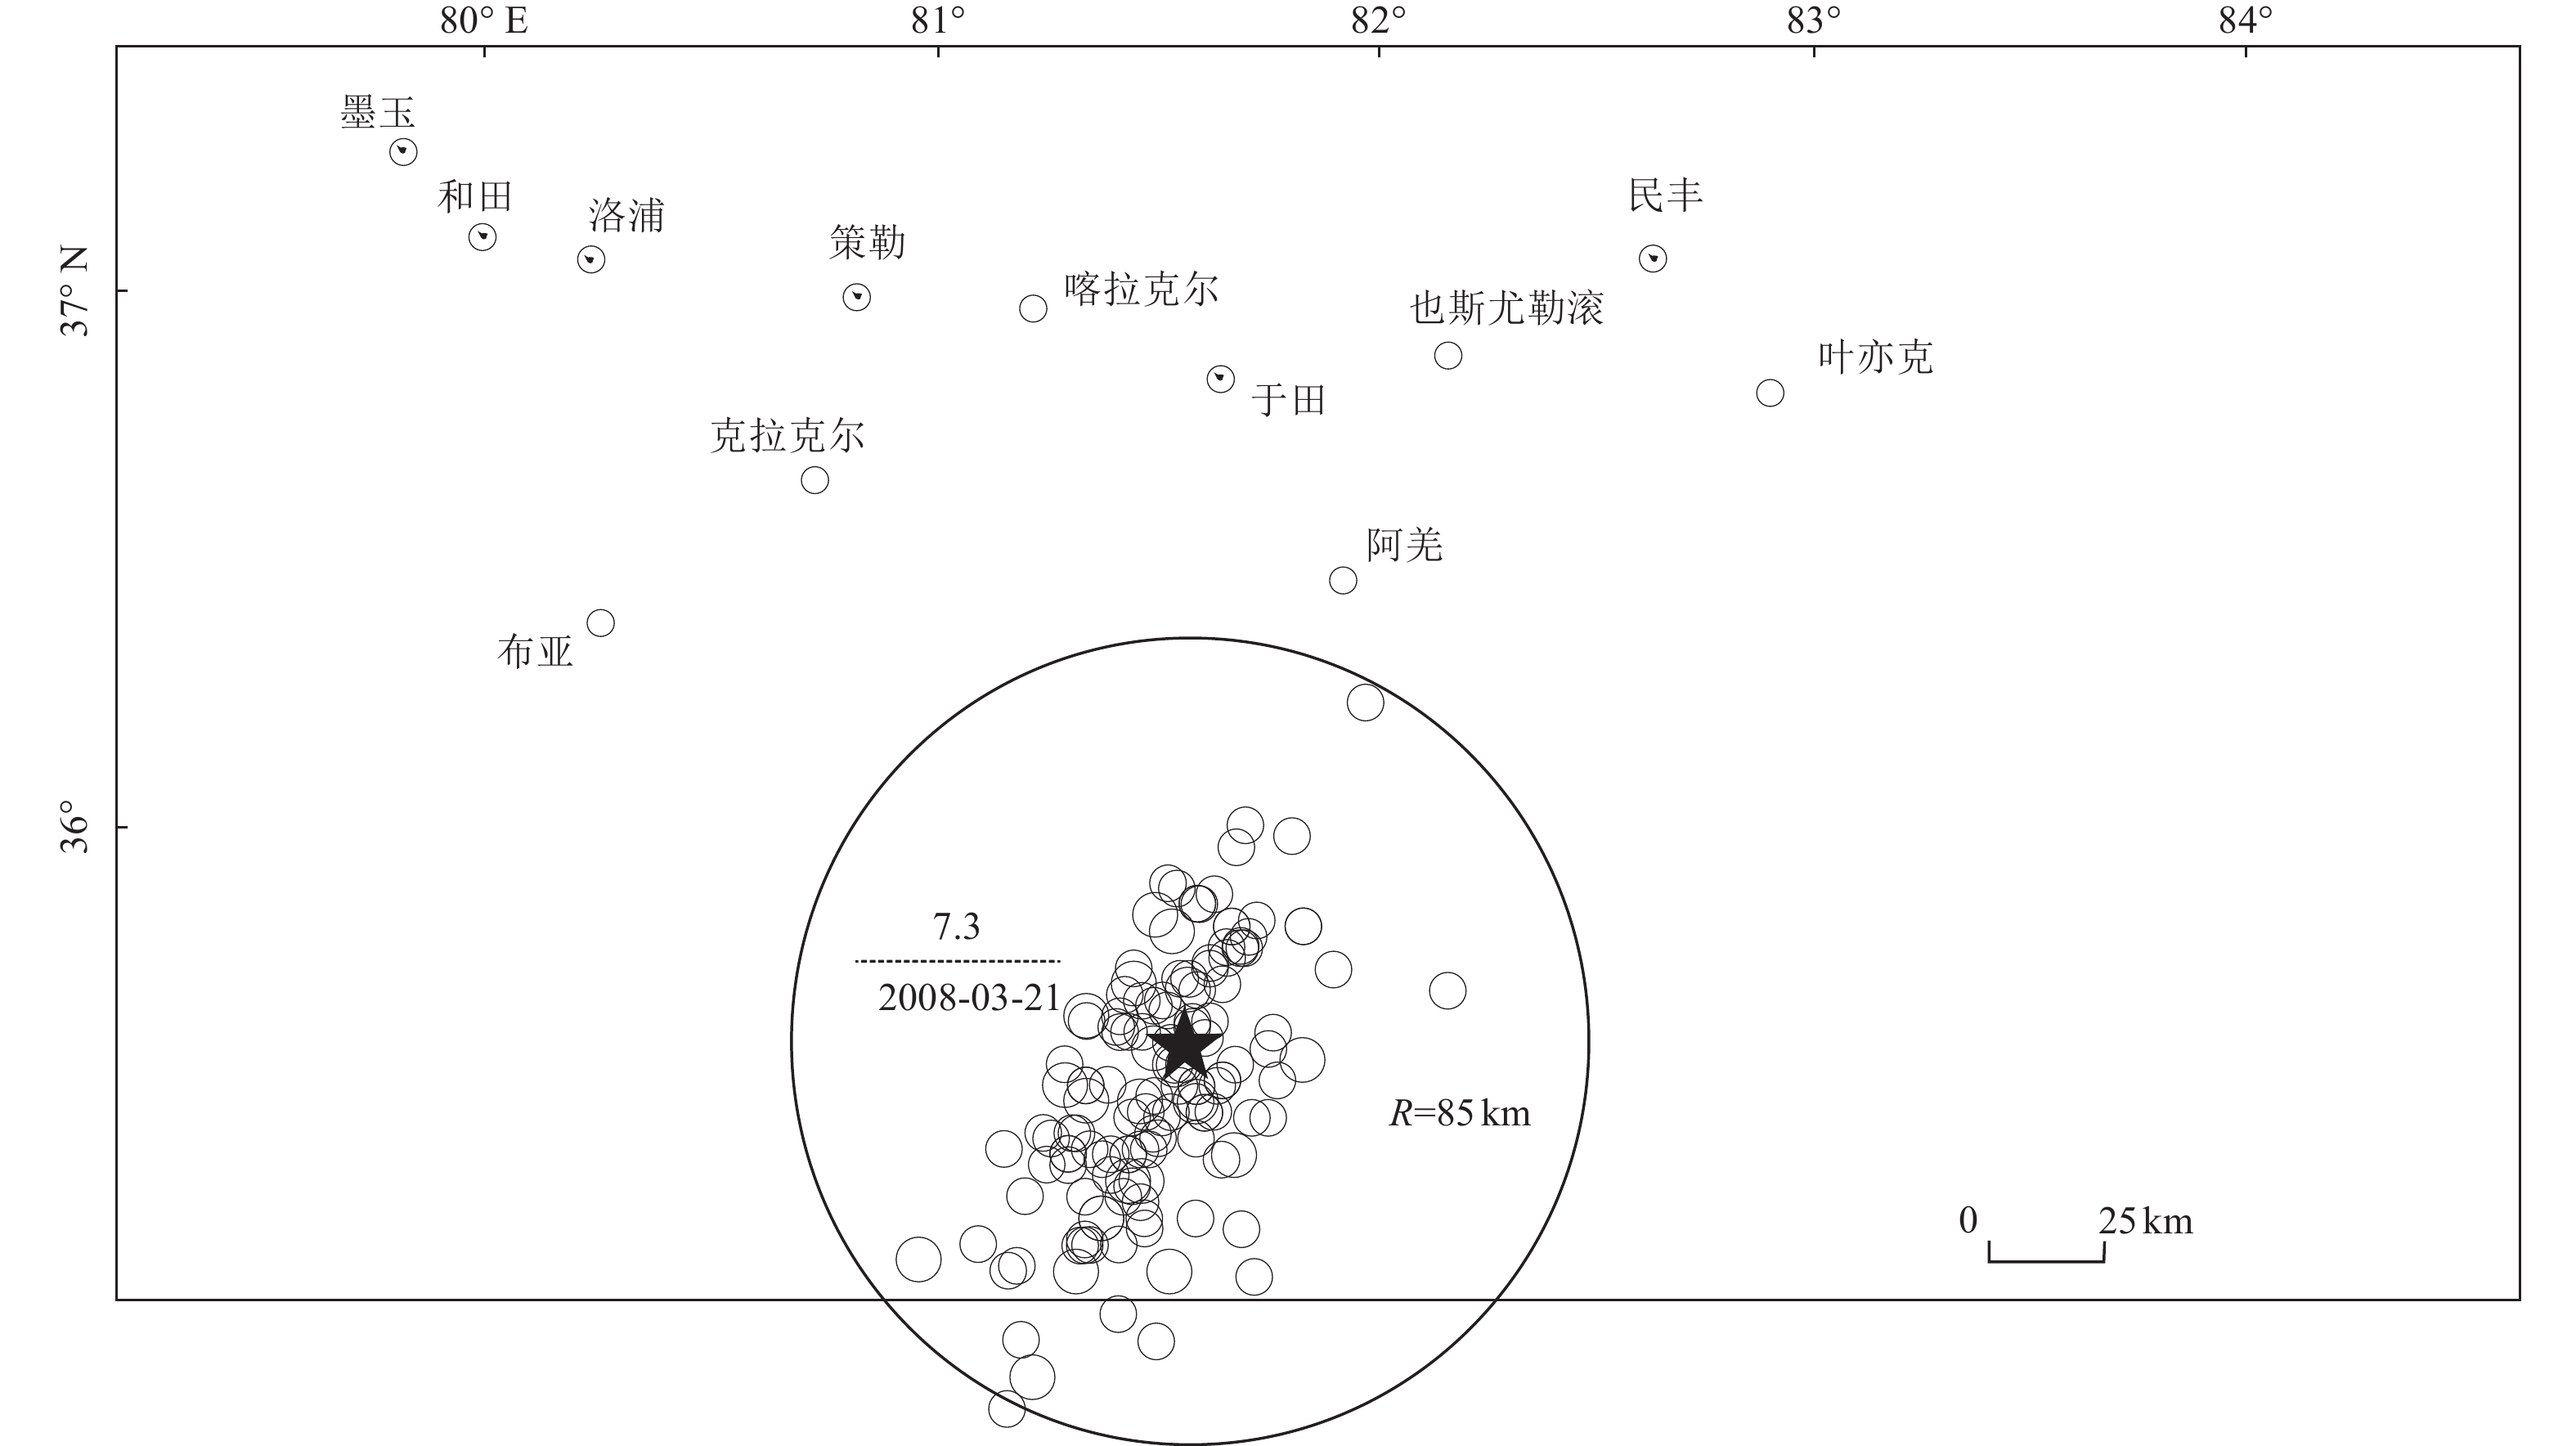
发震时间/(年-月-日) 震中位置 震级/M 震源深度/km 参考地名 纬度/° 经度/° 1922-10-17 39.50 91.0 6½ — 若羌罗布泊东南 1924-07-03 36.96 84.4 7¼ — 民丰东 1924-07-12 37.10 83.6 7¼ — 民丰东部 1927-03-16 38.20 98.2 6 — 青海哈拉湖东 1930-07-14 38.10 98.2 6½ — 青海哈拉湖东 1933-09-26 38.27 86.9 6¾ — 且末东 1938-08-23 37.40 98.5 6 — 青海天梭西 1941-04-19 39.10 97.0 6 — 青海玉门附近 1951-12-27 39.60 95.7 6 — 甘肃肃北东 1952-10-06 37.10 93.2 6 — 青海乌图美仁附近 1962-05-21 37.10 96.0 6¾ 25 青海北霍布逊湖附近 1977-01-02 38.21 91.21 6.4 33 青海 1977-01-19 37.10 95.81 6.3 18 青海 1987-02-26 38.46 91.36 6.1 24 青海茫崖西北 1990-01-14 38.39 91.57 6.7 12 青海 1990-04-26 36.08 100.08 7.0 9 青河共和西南 1993-10-02 38.31 88.69 6.6 27 若羌 1994-01-03 36.10 100.10 6.0 8 青海南 2000-09-12 35.30 99.30 6.6 10 青海兴海—玛多 2003-04-17 37.50 96.80 6.6 15 青海德令哈 2008-03-21 35.67 81.52 6.1 33 于田 2008-03-21 35.60 81.61 7.3 33 于田 2008-11-10 37.60 95.90 6.3 10 青海海西 2009-08-28 37.60 95.90 6.6 10 青海海西 2009-08-31 37.74 95.98 6.1 7 青海海西 2012-08-12 35.90 82.50 6.2 30 于田 2014-02-12 35.99 82.46 6.0 7 于田 2014-02-12 36.10 82.50 7.3 12 于田 表 2 余震时间窗
Table 2. Aftershock time window
震级范围 T/d 4.0≤M<4.5 42 4.5≤M<5.0 83 5.0≤M<5.5 155 5.5≤M<6.0 290 6.0≤M<6.5 510 6.5≤M<7.0 790 表 3 2008年于田7.3级地震余震删除前、后地震数
Table 3. Earthquakes before and after the deletion of Yutian M7.3 earthquake in 2008
2008年于田7.3级
地震资料不同震级范围的地震数 4.0≤M<4.5 4.5≤M<5.0 5.0≤M<5.5 5.5≤M<6.0 6.0≤M<6.5 6.5≤M<7.0 7.0≤M<7.5 原始 85 40 28 5 2 0 1 删除余震后 34 10 7 0 0 0 1 表 4 地震带地震目录余震删除前、后地震数
Table 4. Earthquakes before and after the deletion of aftershock
柴达木—阿尔金地震带
1920—2019年地震资料不同震级范围的地震数 4.0≤M<4.5 4.5≤M<5.0 5.0≤M<5.5 5.5≤M<6.0 6.0≤M<6.5 6.5≤M<7.0 7.0≤M<7.5 原始 481 209 125 42 14 9 5 删除余震后 330 145 92 32 11 9 5 表 5 不同构造区地震目录
Table 5. Earthquake catalog of different structural areas
柴达木—阿尔金地震带
1920—2019年地震资料不同震级范围的地震数 4.0≤M<4.5 4.5≤M<5.0 5.0≤M<5.5 5.5≤M<6.0 6.0≤M<6.5 6.5≤M<7.0 7.0≤M<7.5 原始 481 209 125 42 14 9 5 删余震后 330 145 92 32 11 9 5 表 6 不同构造区不同起算震级计算b值
Table 6. Calculation of b-values with different starting magnitudes in different structural areas
地区青海湖地震构造区 柴达木地震构造区 阿尔金地震构造区 a b a b a b 起始震级4.0级 3.493 2 0.536 5 4.908 0 0.668 1 5.560 3 0.801 9 起始震级5.0级 3.403 8 0.506 0 — — 4.900 5 0.676 8 -
[1] 常金龙, 2017. 鹤岗及周边地区b值计算和地震危险性分析. 防灾减灾学报, 33(1): 32—35Chang J. L. , 2017. Calculating b value of Hegang and its neighbourhood region and analysis of seismic hazard. Journal of Disaster Prevention Reduction, 33(1): 32—35. (in Chinese) [2] 陈鲲, 2014. 针对大地震设防的地震动参数确定方法研究. 国际地震动态, (1): 45—46. doi: 10.3969/j.issn.0235-4975.2014.01.014 [3] 陈凌, 陈颙, 刘杰等, 1998. 地震活动性的统计分析: 由过去推测将来的可能性研究. 地球物理学报, 41(1): 61—70 doi: 10.3321/j.issn:0001-5733.1998.01.007Chen L. , Chen R. , Liu J. , et al. , 1998. Statistical analysis of seismicity: study on the possibility of extrapolating the future from the past. Acta Geophysica Sinica, 41(1): 61—70. (in Chinese) doi: 10.3321/j.issn:0001-5733.1998.01.007 [4] 陈培善, 白彤霞, 李保昆, 2003. b值和地震复发周期. 地球物理学报, 46(4): 510—519 doi: 10.3321/j.issn:0001-5733.2003.04.013Chen P. S. , Bai T. X. , Li B. K. , 2003. b—value and earthquake occurrence period. Chinese Journal of Geophysics, 46(4): 510—519. (in Chinese) doi: 10.3321/j.issn:0001-5733.2003.04.013 [5] 郭增建, 秦保燕, 1979. 震源物理. 北京: 地震出版社. [6] 刘杰, 陈颙, 杨一冲等, 1997. 利用近代微震资料研究地震危险性. 中国地震, 13(1): 10—17Liu J. , Chen Y, Yang Y. C. , et al. , 1997. Studies of earthquake risk using microseismicity data in modern times. Earthquake Research in China, 13(1): 10—17. (in Chinese) [7] 潘华, 李金臣, 2006. 地震统计区地震活动性参数b值及v4不确定性研究. 震灾防御技术, 1(3): 218—224 doi: 10.3969/j.issn.1673-5722.2006.03.006Pan H. , Li J. C. , 2006. Study on uncertainties of seismicity parameters b and v4 in seismic statistical zones. Technology for Earthquake Disaster Prevention, 1(3): 218—224. (in Chinese) doi: 10.3969/j.issn.1673-5722.2006.03.006 [8] 潘华, 高孟潭, 谢富仁, 2013. 新版地震区划图地震活动性模型与参数确定. 震灾防御技术, 8(1): 11—23 doi: 10.3969/j.issn.1673-5722.2013.01.002Pan H. , Gao M. T. , Xie F. R. , 2013. The earthquake activity model and seismicity parameters in the new seismic hazard map of China. Technology for Earthquake Disaster Prevention, 8(1): 11—23. (in Chinese) doi: 10.3969/j.issn.1673-5722.2013.01.002 [9] 任雪梅, 高孟潭, 冯静, 2011. 地震目录的完整性对b值计算的影响. 震灾防御技术, 6(3): 257—268 doi: 10.3969/j.issn.1673-5722.2011.03.005Ren X. M. , Gao M. T. , Feng J. , 2011. Effect of completeness of earthquake catalogue on calculating b value. Technology for Earthquake Disaster Prevention, 6(3): 257—268. (in Chinese) doi: 10.3969/j.issn.1673-5722.2011.03.005 [10] 单新建, 韩京, 许静, 1996. 新疆测震台网历史监测能力及现状. 内陆地震, 10(1): 61—67Shan X. J. , Han J. , Xu J. , 1996. Historical monitoring ability and present status of Xinjiang seismic network. Inland Earthquake, 10(1): 61—67. (in Chinese) [11] 王海涛, 李莹甄, 屠泓为, 2006. 新疆历史地震目录完整性分析. 内陆地震, 20(1): 10—17 doi: 10.3969/j.issn.1001-8956.2006.01.002Wang H. T. , Li Y. Z. , Tu H. W. , 2006. Analysis on integrity of Xinjiang historical earthquake catalogue. Inland Earthquake, 20(1): 10—17. (in Chinese) doi: 10.3969/j.issn.1001-8956.2006.01.002 [12] 汪素云, 俞言祥, 2009. 震级转换关系及其对地震活动性参数的影响研究. 震灾防御技术, 4(2): 141—149 doi: 10.3969/j.issn.1673-5722.2009.02.002Wang S. Y. , Yu Y. X. , 2009. Research on empirical relationship of earthquake magnitude scales and its influence on seismicity parameters. Technology for Earthquake Disaster Prevention, 4(2): 141—149. (in Chinese) doi: 10.3969/j.issn.1673-5722.2009.02.002 [13] 吴果, 周庆, 冉洪流, 2019. 震级-频度关系中b值的极大似然法估计及其影响因素分析. 地震地质, 41(1): 21—43 doi: 10.3969/j.issn.0253-4967.2019.01.002Wu G. , Zhou Q. , Ran H. L. , 2019. The maximum likelihood estimation of b-value in magnitude-frequency relation and analysis of its influencing factors. Seismology and Geology, 41(1): 21—43. (in Chinese) doi: 10.3969/j.issn.0253-4967.2019.01.002 [14] 徐伟进, 高孟潭, 2014. 中国大陆及周缘地震目录完整性统计分析. 地球物理学报, 57(9): 2802—2812 doi: 10.6038/cjg20140907Xu W. J. , Gao M. T. , 2014. Statistical analysis of the completeness of earthquake catalogs in China mainland. Chinese Journal of Geophysics, 57(9): 2802—2812. (in Chinese) doi: 10.6038/cjg20140907 [15] 杨春柳, 陈新民, 崔灿等, 2010. 南京地区b值和地震年平均发生率的研究. 江苏建筑, (2): 61—64 doi: 10.3969/j.issn.1005-6270.2010.02.021Yang C. L. , Chen X. M. , Cui C. , et al. , 2010. Statistical analysis on b value and earthquake annual mean incidence ratio in Nanjing seismic zone. Jiangsu Construction, (2): 61—64. (in Chinese) doi: 10.3969/j.issn.1005-6270.2010.02.021 [16] 姚远, 伊力亚尔•阿不力孜, 吴传勇等, 2014.2014年2月12日新疆于田MS7.3地震发震构造初步研究. 内陆地震, 28(2): 121—126 doi: 10.3969/j.issn.1001-8956.2014.02.004Yao Y. , Yiliyar·Abulizi, Wu C. Y. , et al. , 2014. Preliminary study on seismogenic structure of Yutian MS7.3 earthquake on Feb. 12, 2014. Inland Earthquake, 28(2): 121—126. (in Chinese) doi: 10.3969/j.issn.1001-8956.2014.02.004 [17] 郑确, 刘财, 田有等, 2018. 地震活动性中震级-频度关系研究进展与再认识. 地球物理学进展, 33(5): 1879—1889 doi: 10.6038/pg2018BB0381Zheng Q. , Liu C. , Tian Y. , et al. , 2018. Review and further understanding of frequency-magnitude distribution in seismicity. Progress in Geophysics, 33(5): 1879—1889. (in Chinese) doi: 10.6038/pg2018BB0381 [18] 中华人民共和国国家质量监督检验检疫总局, 中国国家标准化管理委员会, 2006. GB 17741—2005 工程场地地震安全性评价. 北京: 中国标准出版社.General Administration of Quality Supervision, Inspection and Quarantine of the People's Republic of China, Standardization Administration, 2006. GB 17741—2005 Evaluation of seismic safety for engineering sites. Beijing: Standards Press of China. (in Chinese) [19] 中华人民共和国国家质量监督检验检疫总局, 中国国家标准化管理委员会, 2016. GB 18306—2015 中国地震动参数区划图. 北京: 中国标准出版社.General Administration of Quality Supervision, Inspection and Quarantine of the People's Republic of China, Standardization Administration, 2016. GB 18306—2015 Seismic ground motion parameters zonation map of China. Beijing: Standards Press of China. (in Chinese) [20] Keilis-Borok V. I. , Knopoff L. , Rotvain, I. M. , 1980. Bursts of aftershocks, long-term precursors of strong earthquakes. Nature, 283(5744): 259—263. doi: 10.1038/283259a0 -


 下载:
下载:
