
Analysis of Vertical Accuracy Based on Network/Base Station RTK-SfM Data
-
摘要: 移动摄影测量技术SfM(Structure from Motion)的发展使活动构造研究中快速获得野外中小区域内高精度DEM数据更便捷,DEM数据精度是目前活动构造与测量领域较关注的问题。本文通过对比非RTK模式无人机摄影测量并结合地面控制点(GCPs)生成的SfM DEM数据与基于RTK移动摄影测量技术获取的RTK-SfM DEM数据差异,重点分析搭载RTK模块的移动摄影测量技术获取的DEM数据在垂向上的精度。数据采集、处理与对比结果表明:在添加地面控制点后的非RTK模式无人机摄影测量生成的DEM数据中,除测量区域边缘照片较少而产生畸变外,大部分地区畸变率较小;基于移动RTK技术摄影测量获取的高程数据畸变率更小,且与非RTK模式无人机摄影结合地面控制点生成的高程数据存在约0.85 m的系统高程误差,减去该误差后,点云对比结果表明二者95%以上的点垂向误差均<0.05 m;搭载RTK模块的移动摄影测量技术获取的DEM数据在垂向上具有更高的精度,且节省了时间与人工成本。
-
关键词:
- 活动构造 /
- 移动摄影测量技术 /
- RTK-SfM DEM /
- 垂向误差 /
- 测量精度
Abstract: The development of Structure from Motion (SfM) technology makes it more convenient to obtain high precision DEM data in small and medium-sized areas quickly in the field of active tectonics research. The accuracy of DEM data is a major concern in the field of active tectonics and surveying. By comparing the SfM DEM data generated by non-RTK model UVA technology combined with ground control point (GCPs) and RTK-SfM DEM data obtained based on RTK SfM technology, this paper focuses on analyzing the vertical accuracy of DEM data obtained by SfM technology equipped with RTK module. The results of data acquisition, processing and comparison show that in the DEM data generated by non-RTK model SfM technology with the GCPs, the distortion rate is small in most areas except the distortion caused by fewer photos at the edge of the measurement area. The DEM data obtained by RTK-SfM has a smaller distortion rate, and the data generated by non-RTK SfM combined with GCPs has a system elevation error of about 0.85 m. After subtracting the system error, the point cloud comparison results show that more than 95% of the vertical errors of both are less than 0.05 m. The DEM data obtained by SfM technology equipped with RTK module has better vertical accuracy and saves time and labor cost.-
Key words:
- Active tectonics /
- SfM technology /
- RTK-SfM DEM /
- Vertical error /
- Accuracy of surveying
1) 2 CloudCompare user manual(Version 2.6.1),2015. -
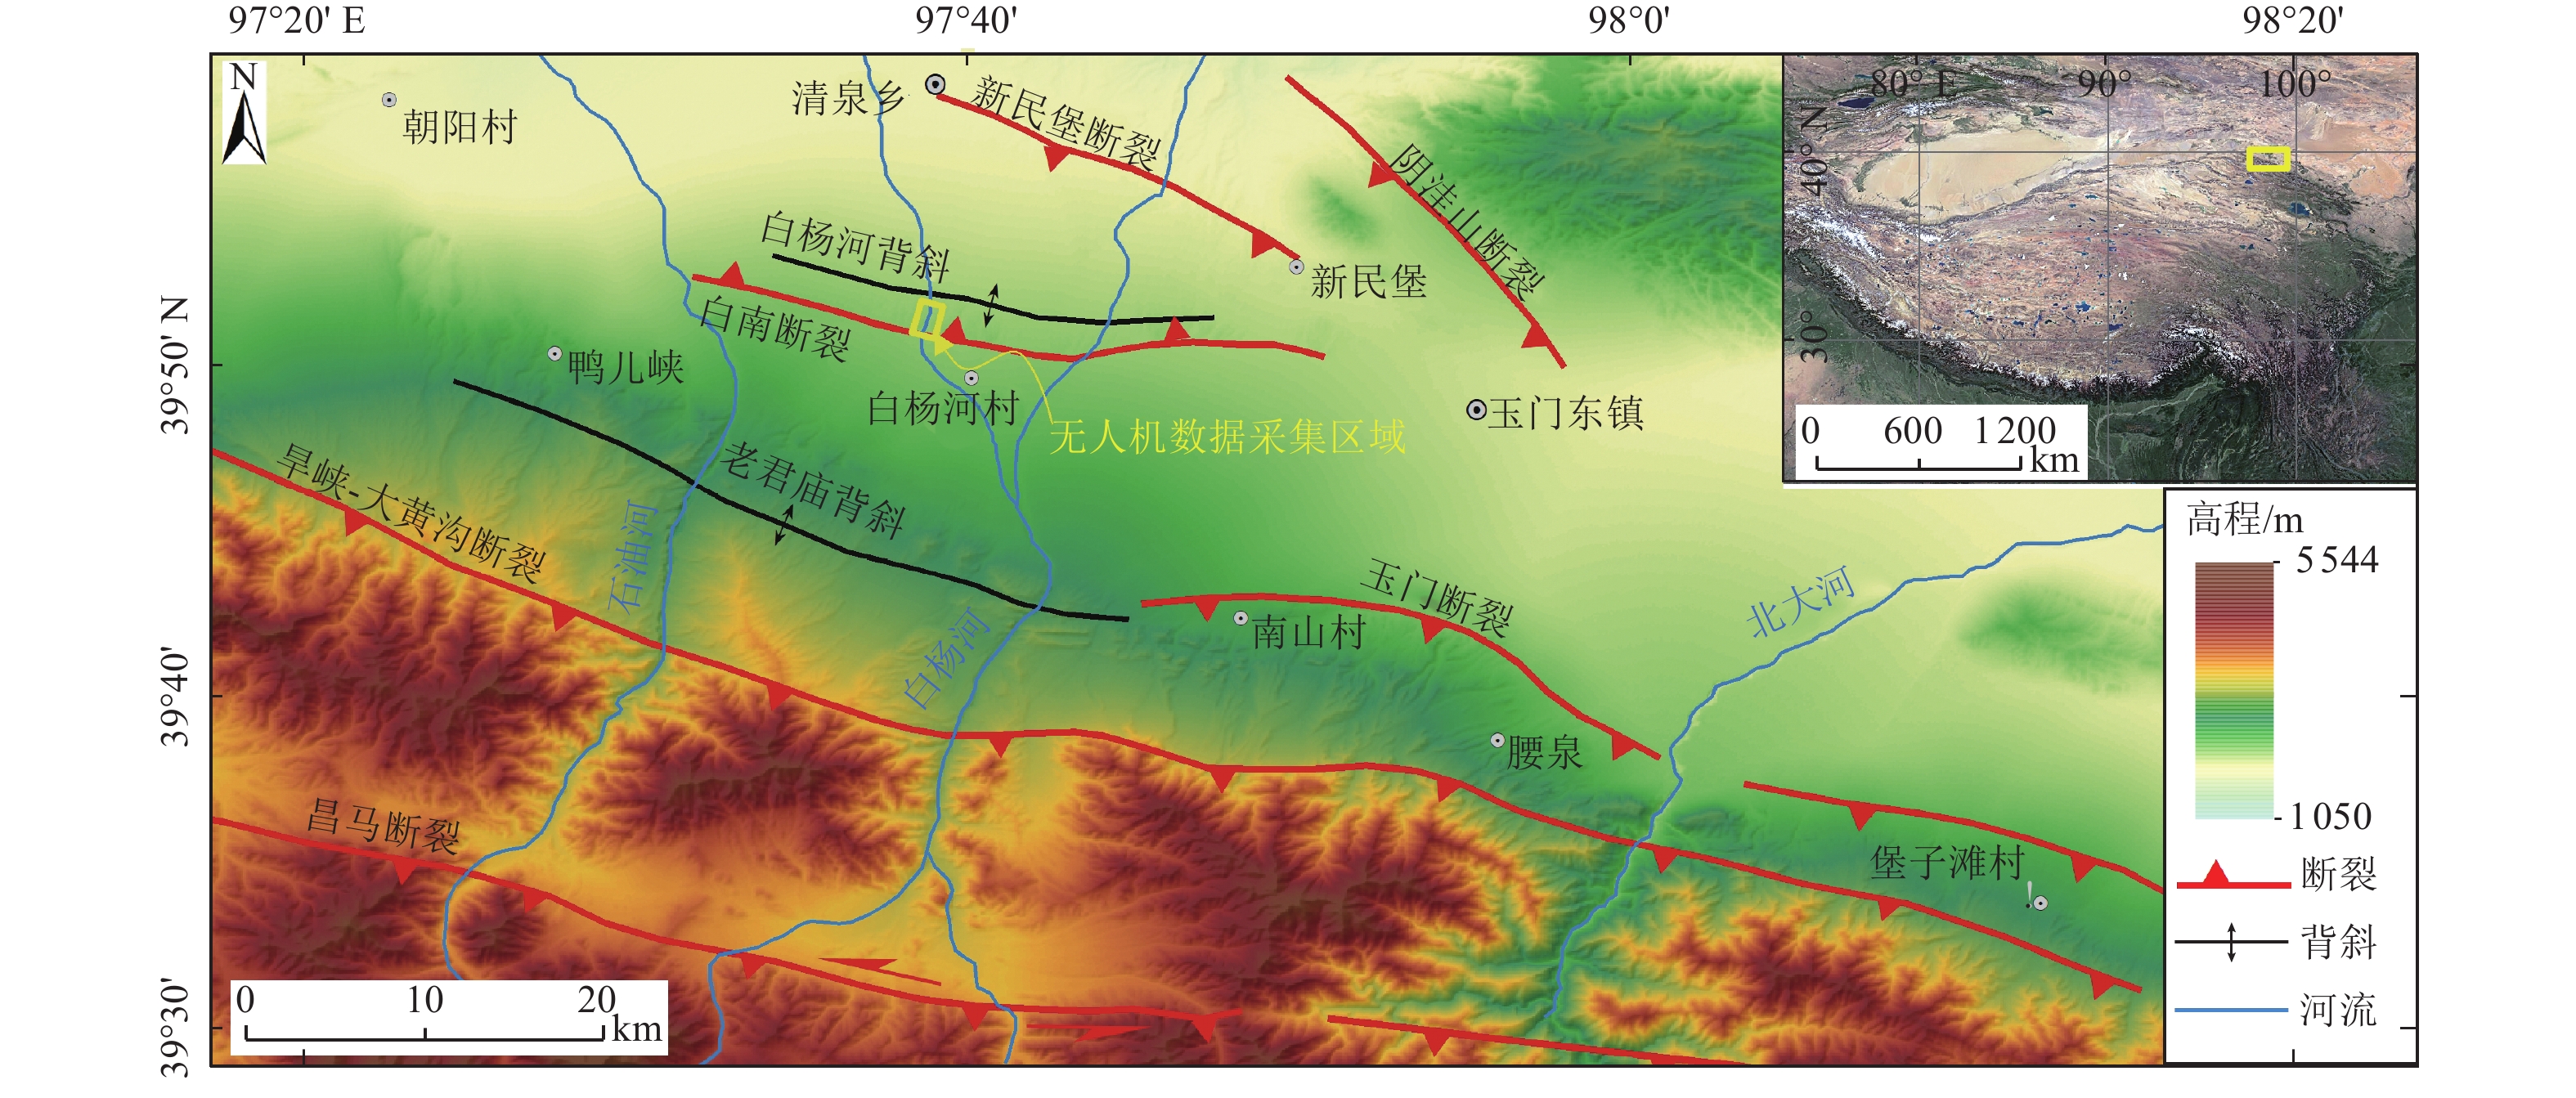
图 2 测量区域及其周围构造
Figure 2. Schematic diagram of the survey area and its surrounding tectonics
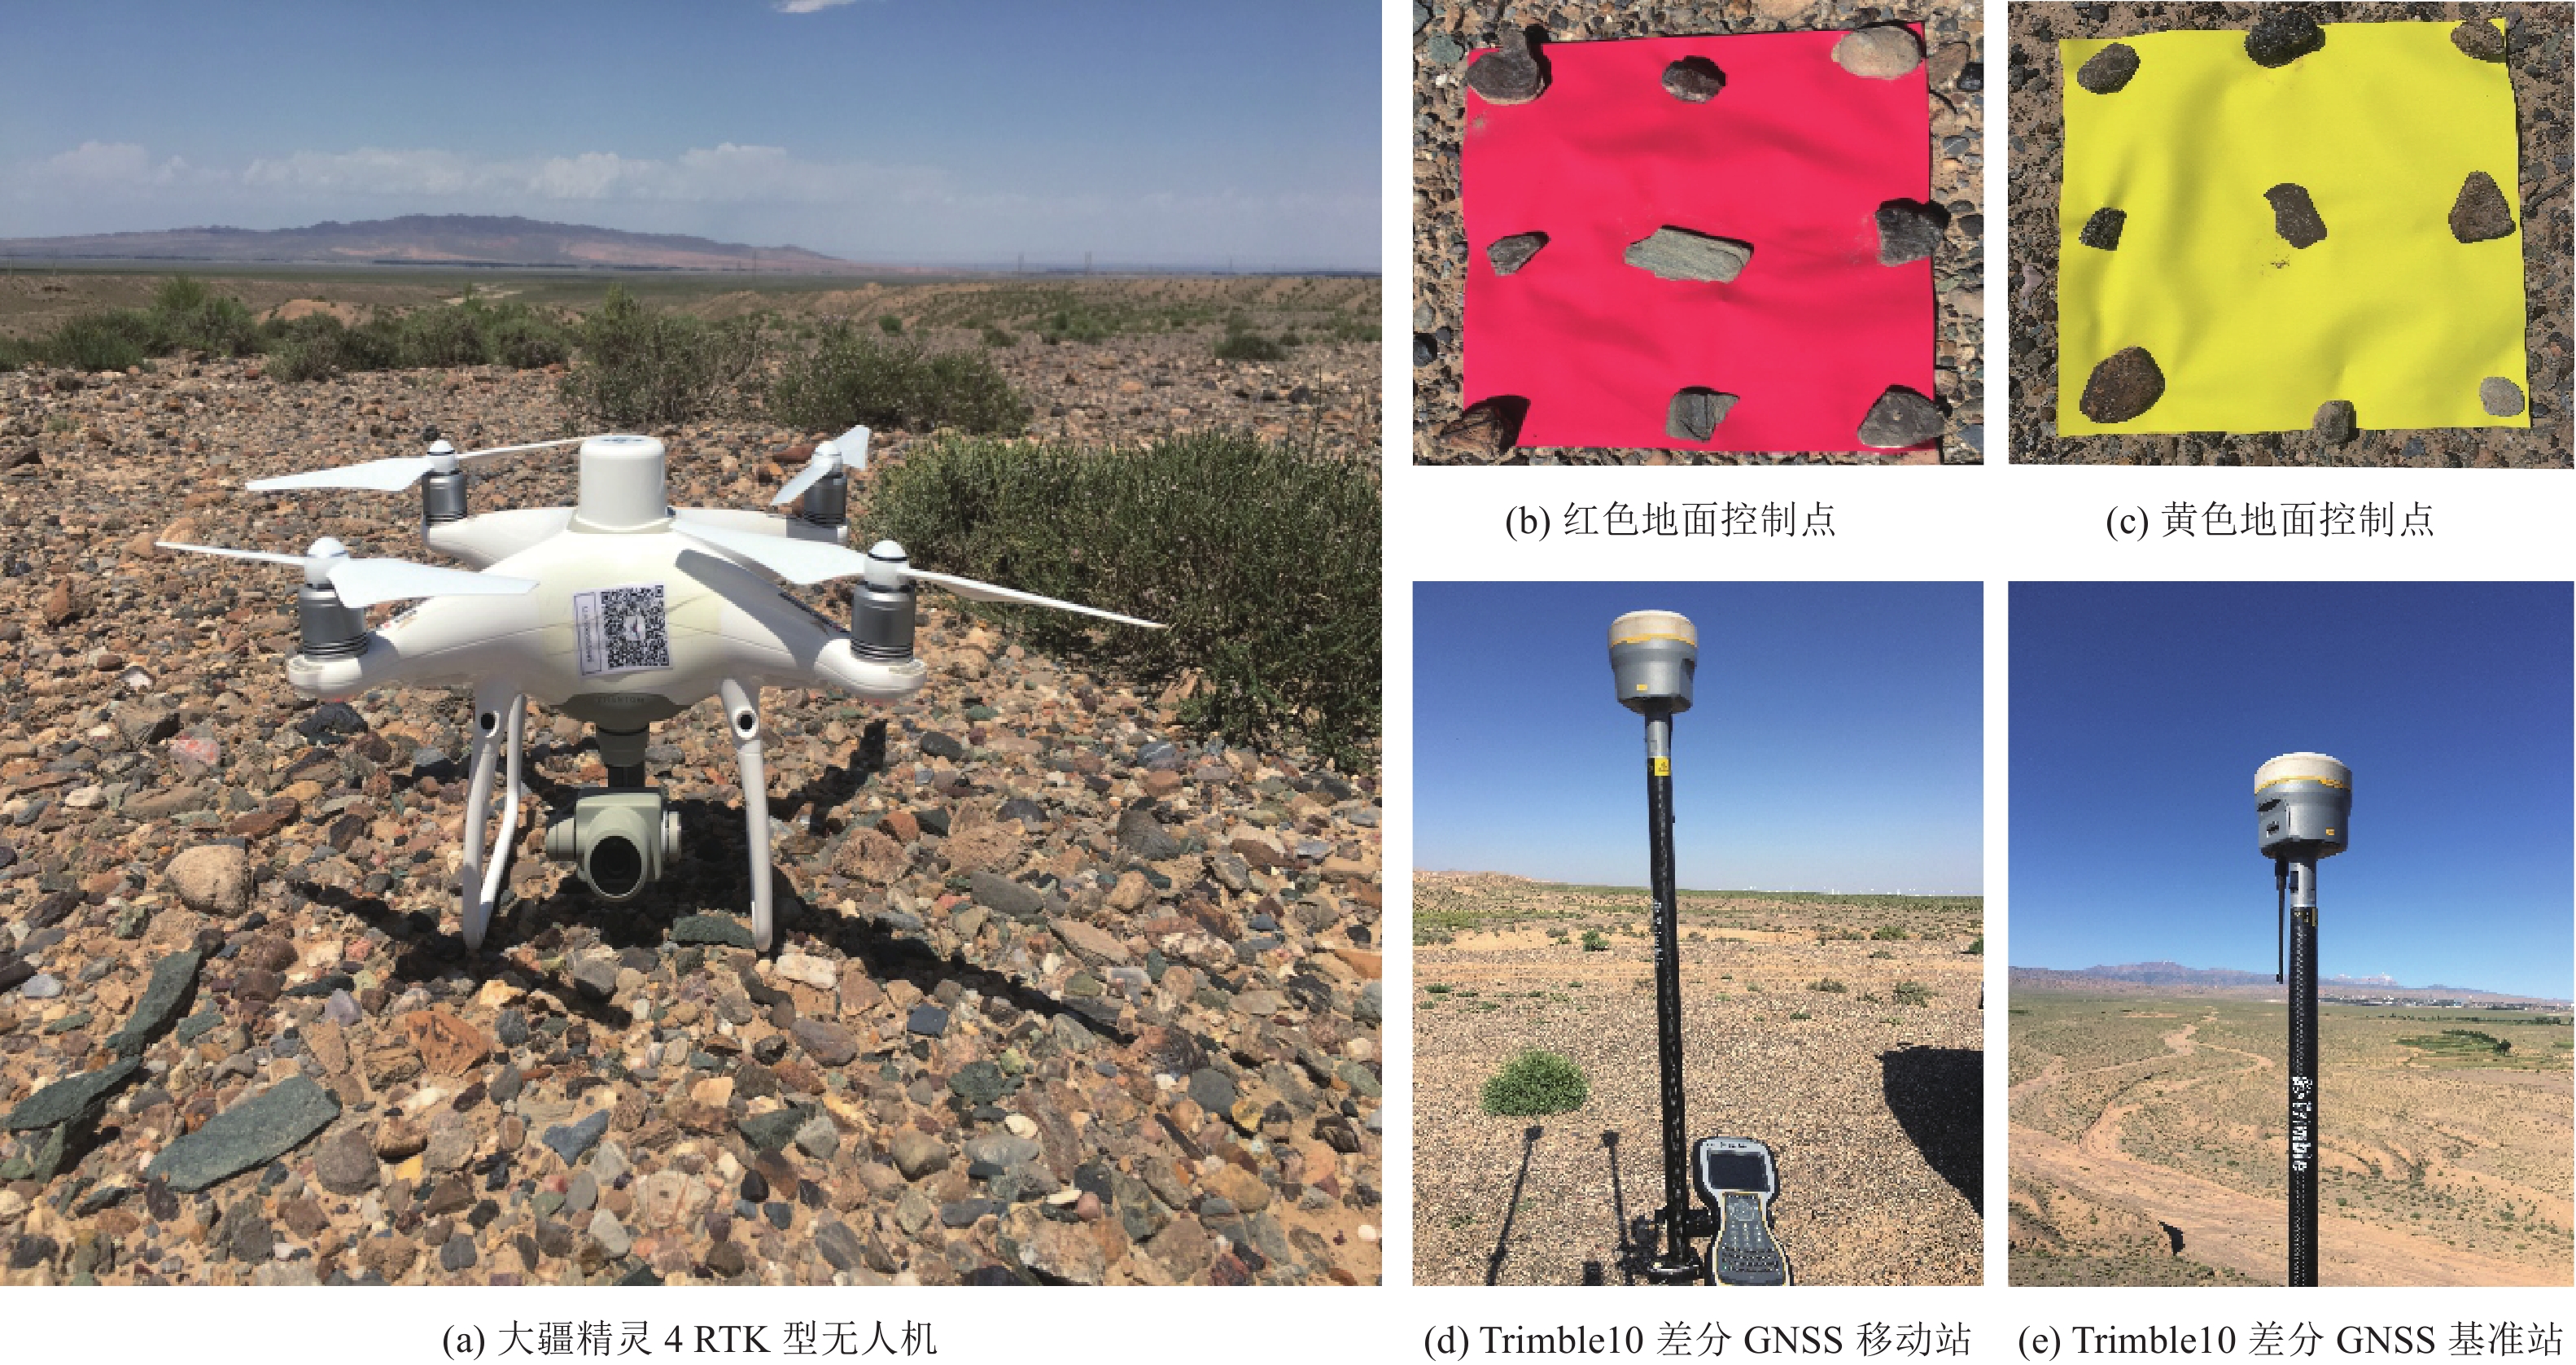
图 3 测量用无人机及地面控制点采集系统
Figure 3. UAV for surveying and ground control point acquisition system
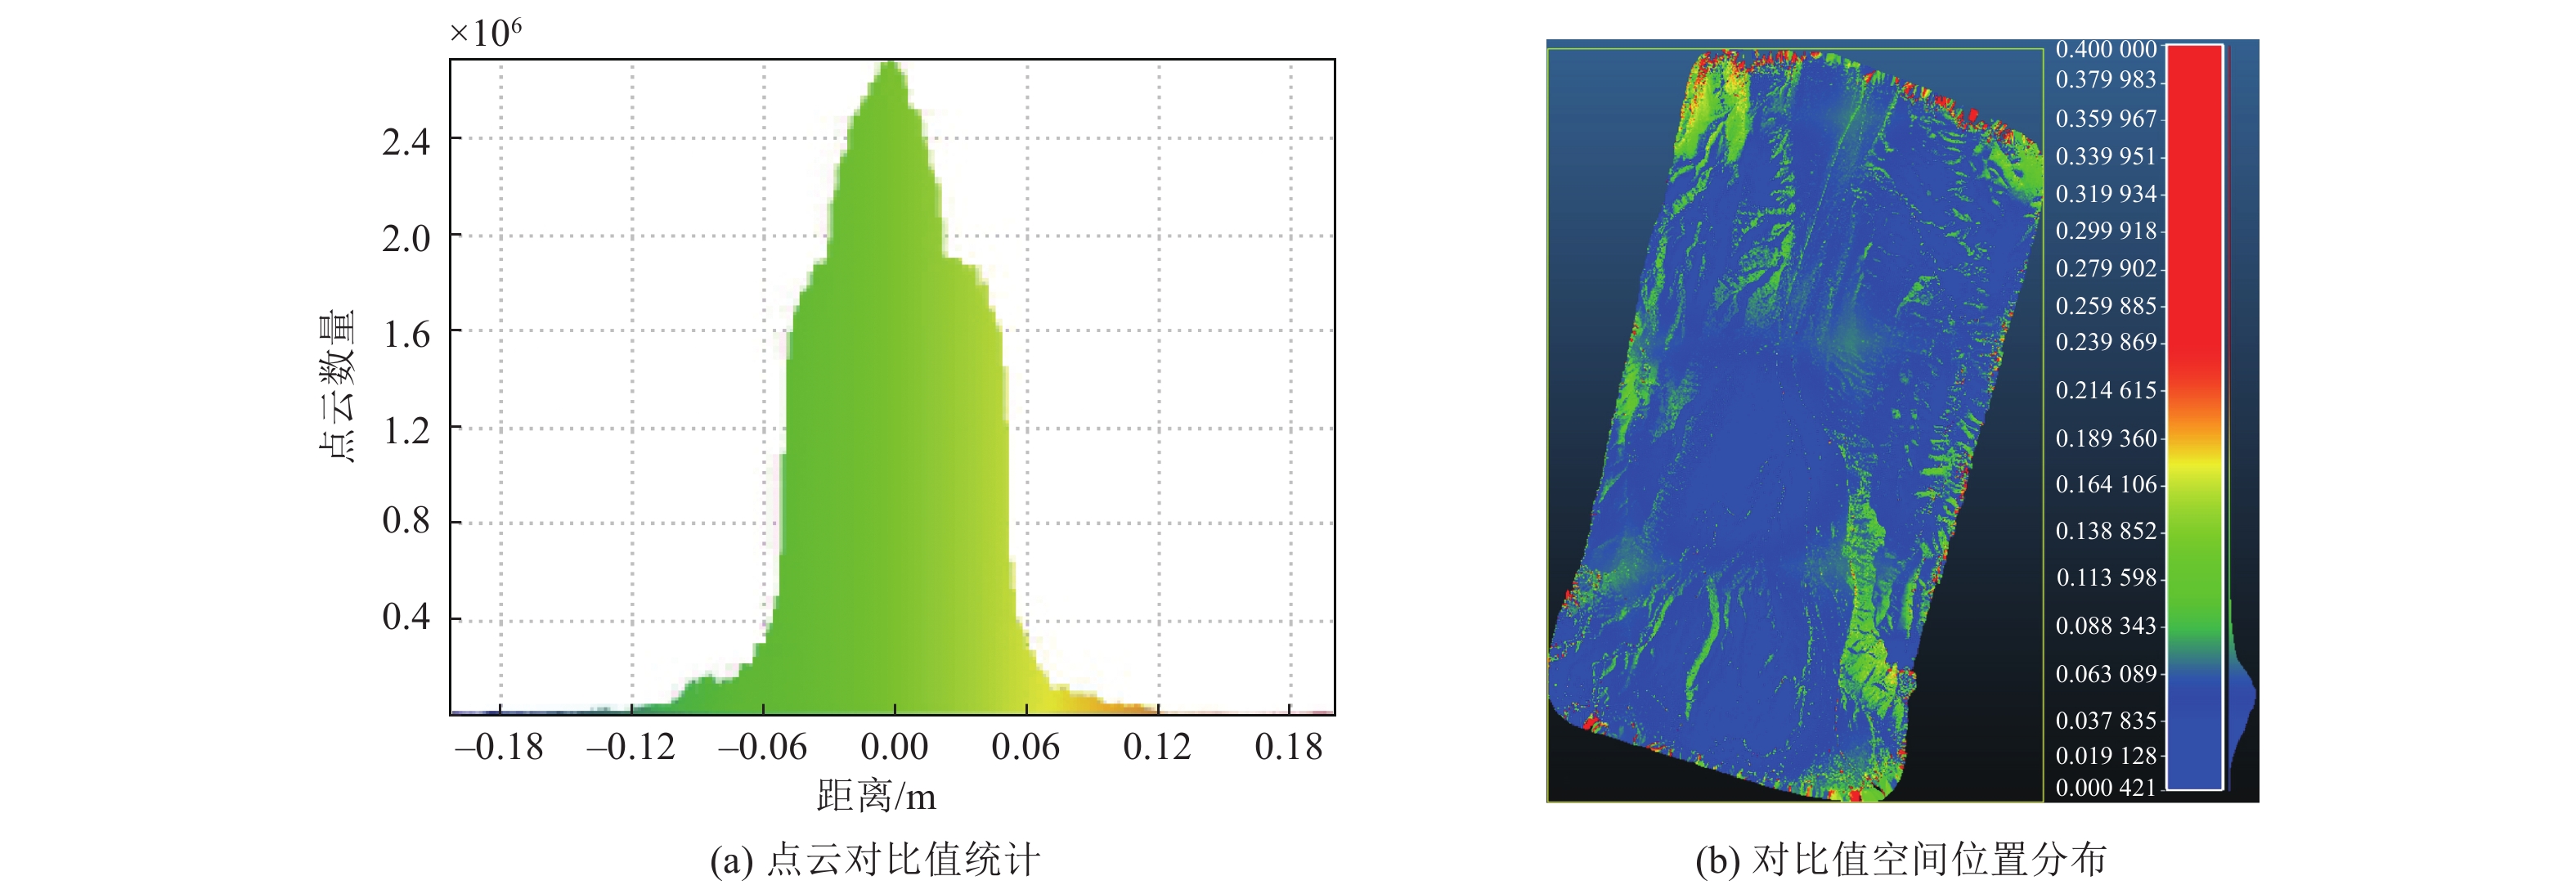
图 5 SfM-DEM与RTK-SfM DEM点云对比统计及误差空间分布
Figure 5. Point cloud comparison statistics and error spatial distribution between SFM-DEM and RTK-SFM DEM
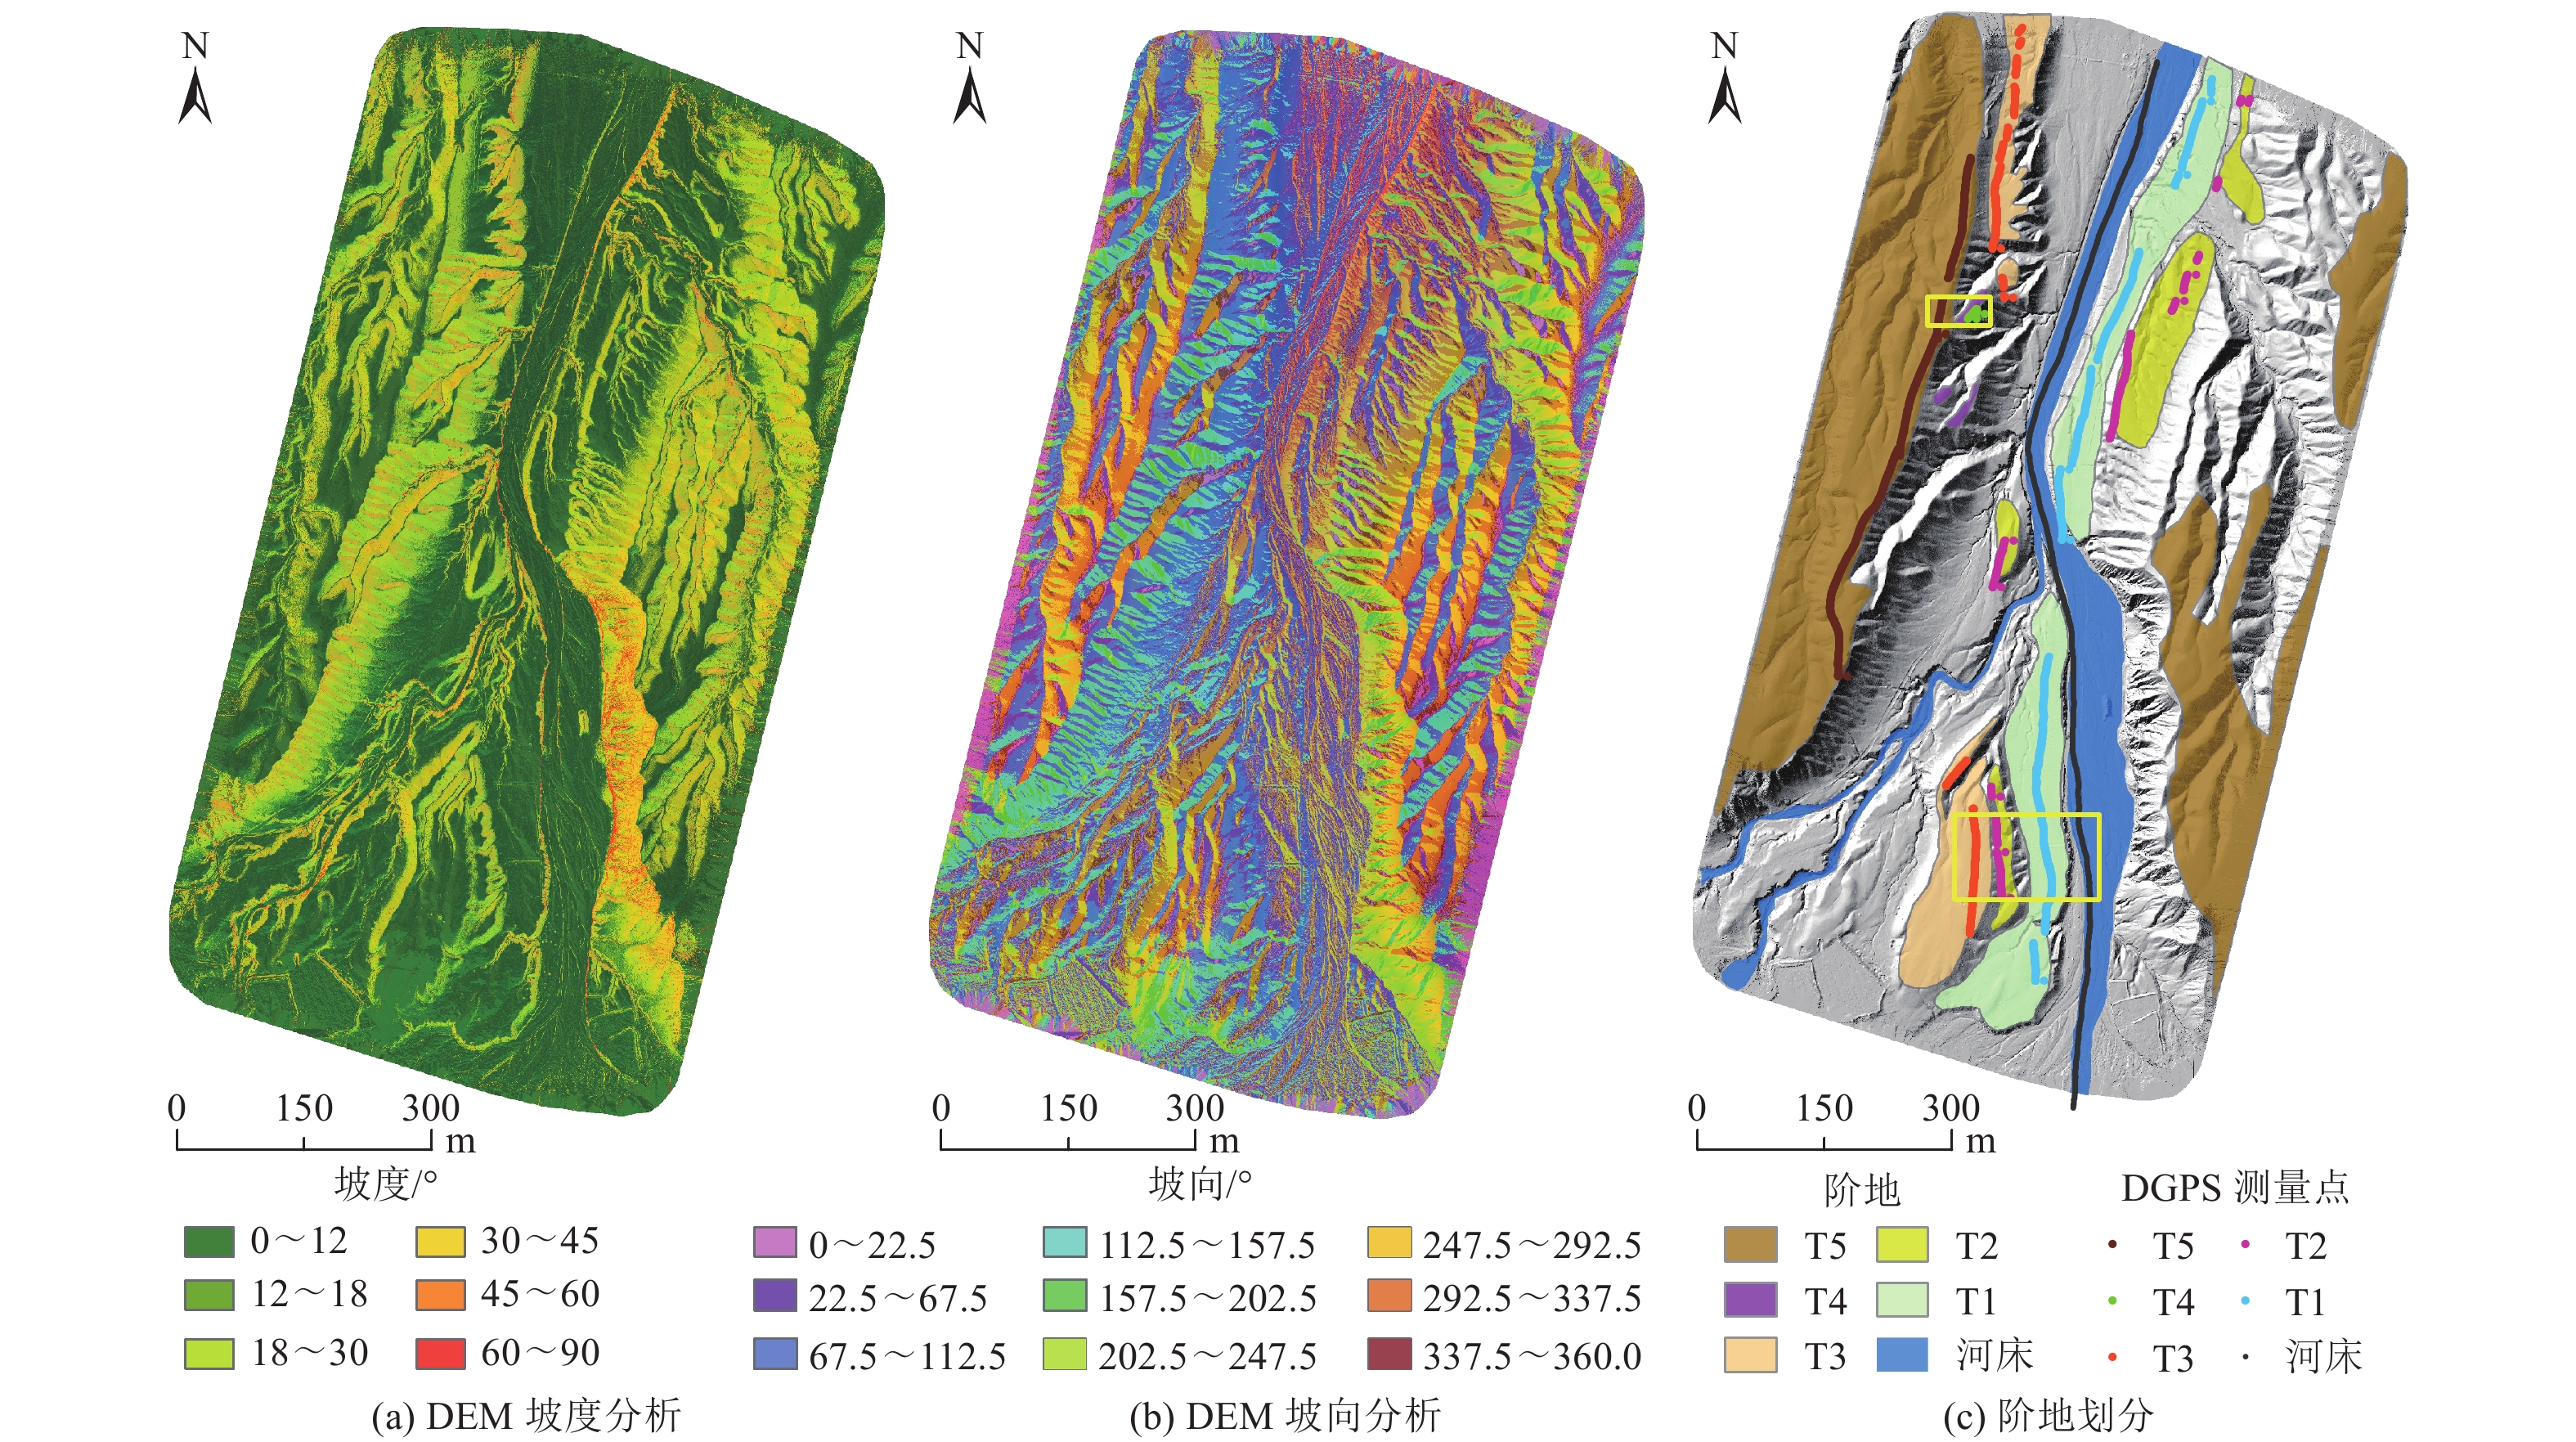
图 6 基于DEM分析结果与野外调查结果的阶地划分及DGPS测线分布
Figure 6. River terraces division and DGPS lines distribution based on DEM analysis and field investigation

图 7 DGPS、SfM DEM、RTK-SfM DEM高程数据对比
Figure 7. Comparison of three elevation data of DGPS, SfM DEM and RTK-SFM DEM
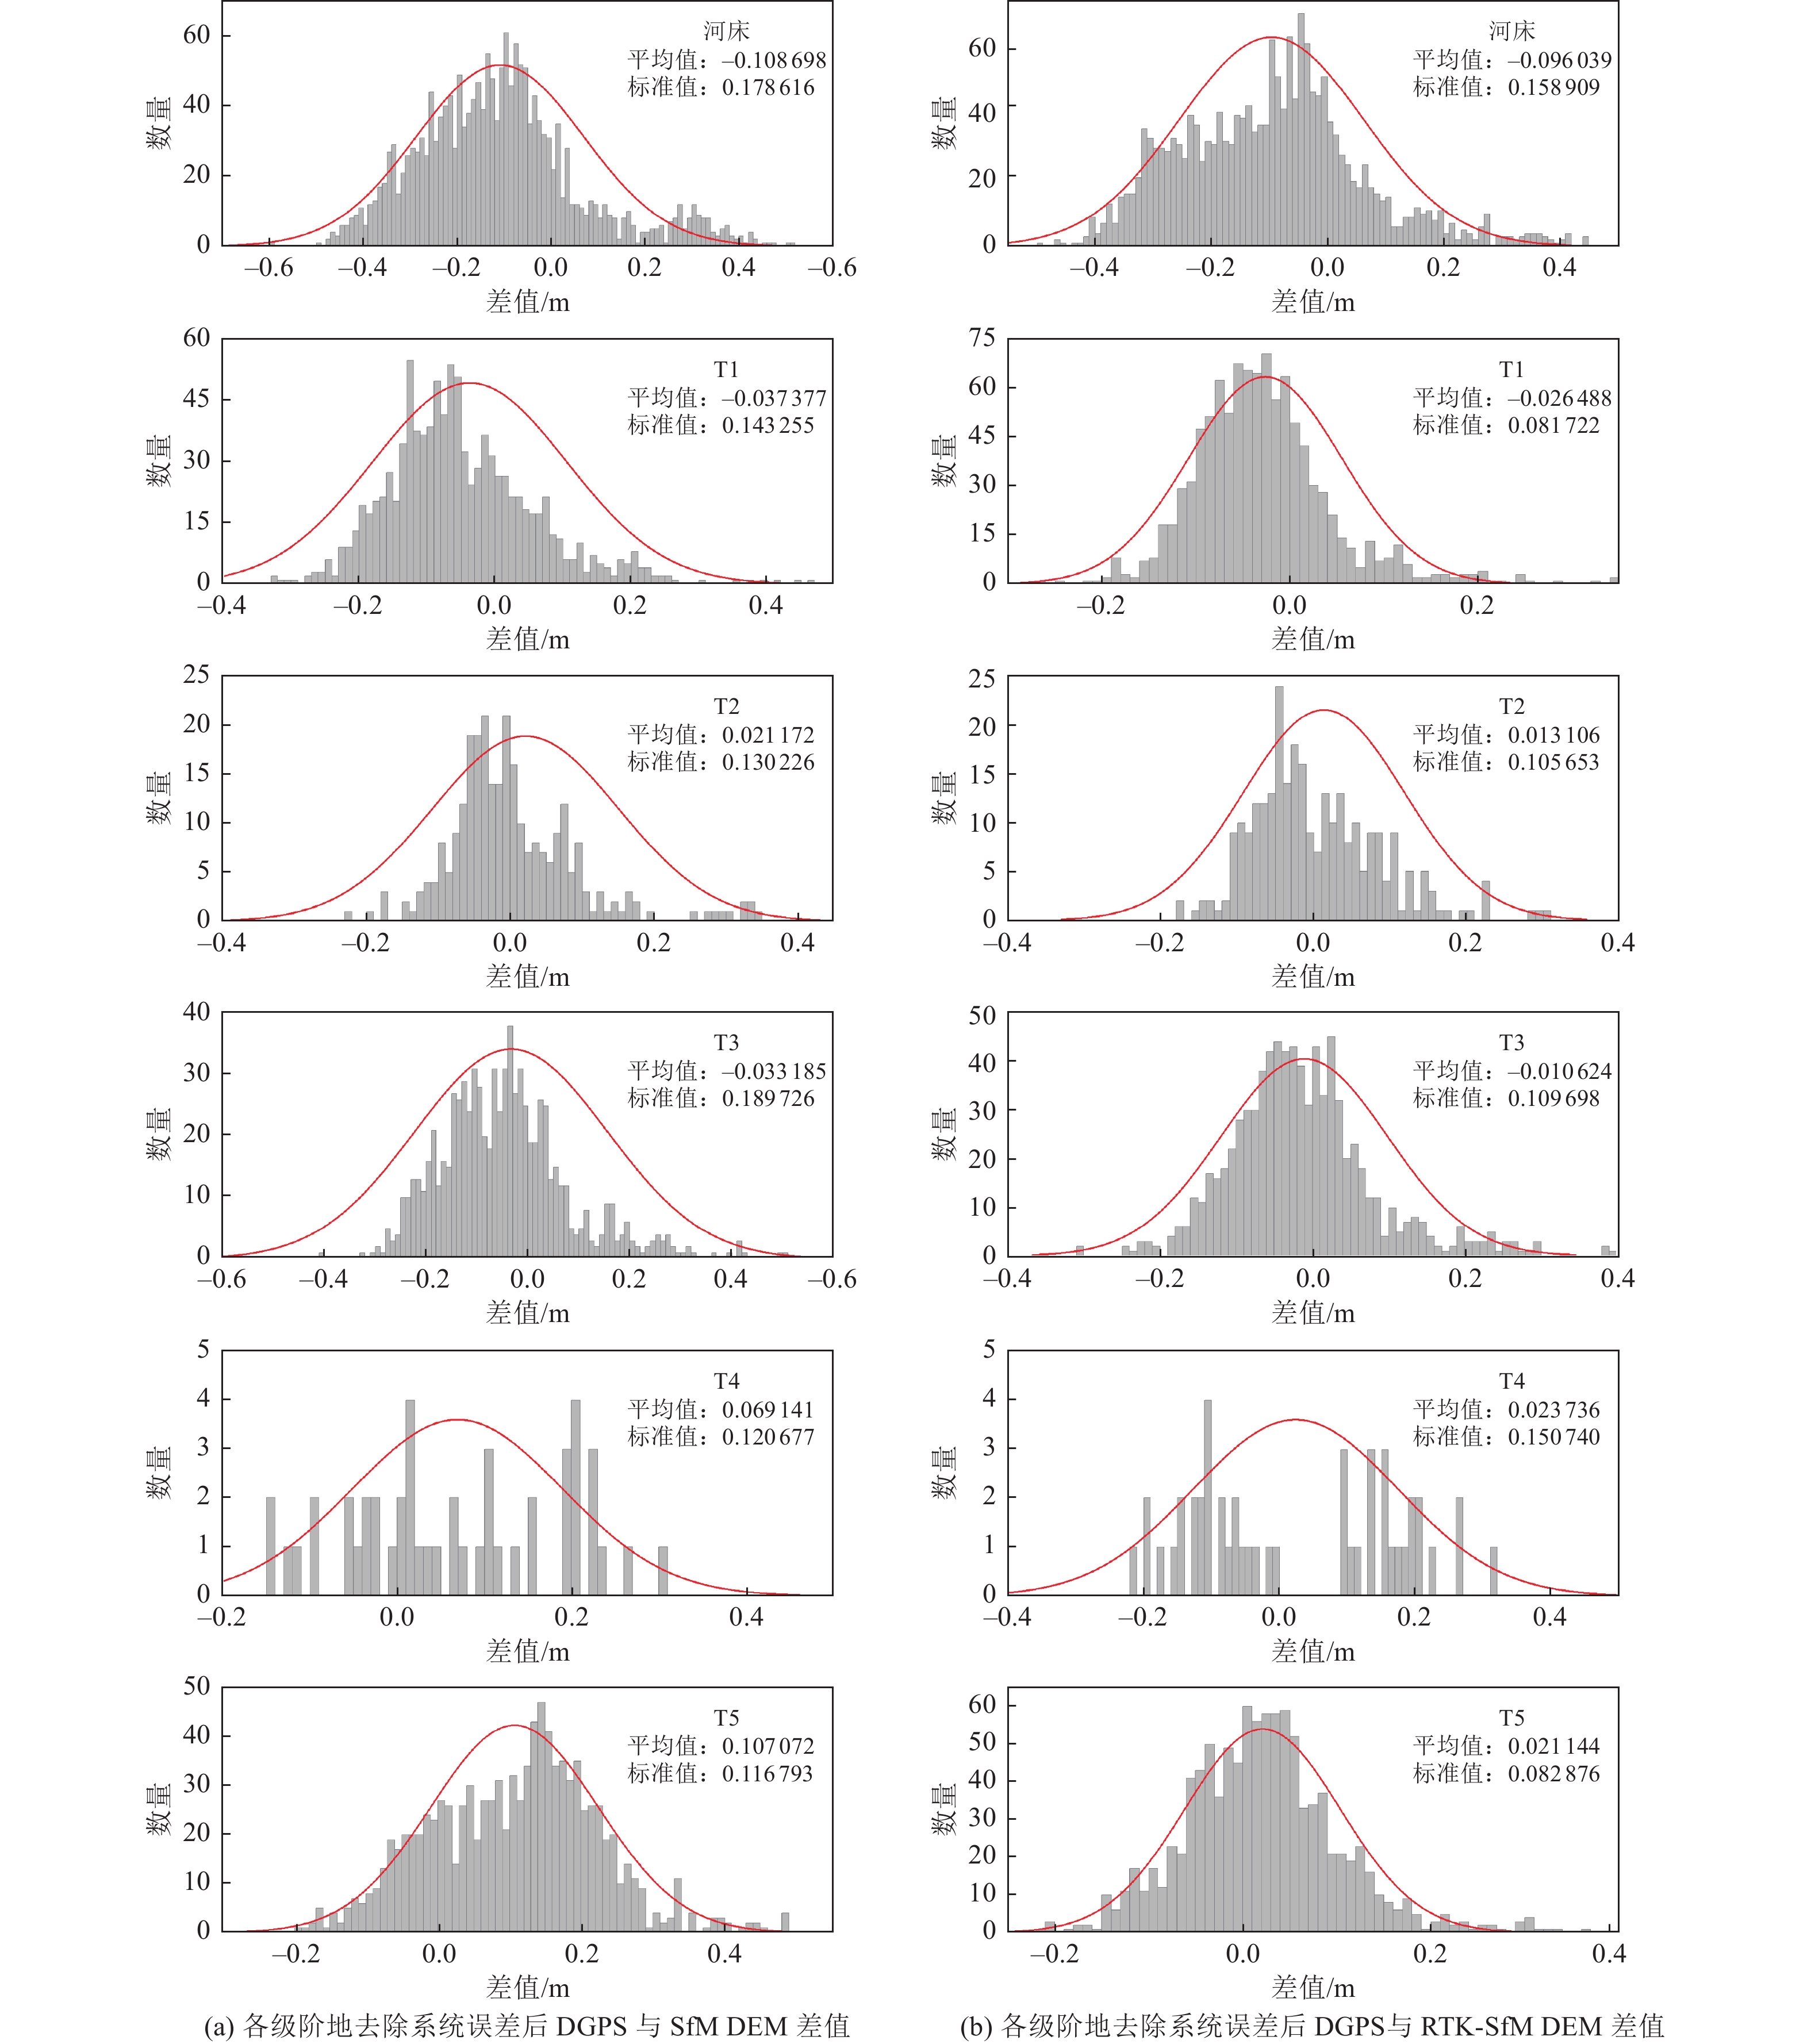
图 8 去除系统误差后DGPS数据与2种方式生成的DEM数据之间差值的正态分布
Figure 8. Normal distribution of the difference between DGPS data and DEM generated by the two methods after removing systematic error
表 1 初步对比点云转换矩阵数据
Table 1. Preliminary comparison point cloud transformation matrix table
x y z RMS 1.000 0.000 0.000 0.565 −0.000 1.000 0.000 0.509 −0.000 −0.000 1.000 0.851 0.000 0.000 0.000 1.000  下载: 导出CSV
表 2 3种高程数据差值的平均值
Table 2. Average value of difference of three elevation data
测线 DGPS与SfM DEM差值/m DGPS与RTK-SfM DEM差值/m 河床 0.44648900 1.25817214 T1 0.51727922 1.33264908 T2 0.56253832 1.39865517 T3 0.54695363 1.33524765 T4 0.61002861 1.38761910 T5 0.56203093 1.47095521 平均值 0.540886618 1.36388305
下载: 导出CSV
表 3 去除系统误差后3种高程数据差值平均值与标准差
Table 3. Average difference and standard deviation of three elevation data after removing systematic error
测线 DGPS与SfM DEM差值/m DGPS与RTK-SfM DEM差值/m 平均值 标准差 平均值 标准差 河床 −0.108 698 0.178 616 −0.096 039 0.158 909 T1 −0.037 377 0.143 255 −0.026 488 0.081 722 T2 0.021 172 0.130 226 0.013 106 0.105 653 T3 −0.033 185 0.189 726 −0.010 624 0.109 698 T4 0.069 141 0.120 677 0.023 736 0.150 740 T5 0.107 072 0.116 793 0.021 144 0.082 876
下载: 导出CSV
-
[1] 艾明, 毕海芸, 郑文俊等, 2018. 利用无人机摄影测量技术提取活动构造定量参数. 地震地质, 40(6): 1276—1293Ai M. , Bi H. Y. , Zheng W. J. , et al. , 2018. Using unmanned aerial vehicle photogrammetry technology to obtain quantitative parameters of active tectonics. Seismology and Geology, 40(6): 1276—1293. (in Chinese) [2] 陈涛, 张培震, 刘静等, 2014. 机载激光雷达技术与海原断裂带的精细地貌定量化研究. 科学通报, 59(14): 1293—1304.Chen T. , Zhang P. Z. , Liu J. , et al. , 2014. Quantitative study of tectonic geomorphology along Haiyuan fault based on airborne LiDAR. Chinese Science Bulletin, 59(20): 2396—2409. (in Chinese) [3] 陈志雄, 2008. 基于图像配准的SIFT算法研究与实现. 武汉: 武汉理工大学.Chen Z. X. , 2008. The SIFT research and implementation based on the image registration. Wuhan: Wuhan University of Technology. (in Chinese) [4] 邓起东, 陈立春, 冉勇康, 2004. 活动构造定量研究与应用. 地学前缘, 11(4): 383—392 doi: 10.3321/j.issn:1005-2321.2004.04.005Deng Q. D. , Chen L. C. , Ran Y. K. , 2004. Quantitative studies and applications of active tectonics. Earth Science Frontiers, 11(4): 383—392. (in Chinese) doi: 10.3321/j.issn:1005-2321.2004.04.005 [5] 高帅坡, 冉勇康, 吴富峣等, 2017. 利用无人机摄影测量技术提取复杂冲积扇面构造活动信息——以新疆巴里坤盆地南缘冲积扇面为例. 地震地质, 39(4): 793—804 doi: 10.3969/j.issn.0253-4967.2017.04.013Gao S. P. , Ran Y. K. , Wu F. Y. , et al. , 2017. Using UAV photogrammetry technology to extract information of tectonic activity of complex alluvial fan——A case study of an alluvial fan in the southern margin of Barkol Basin. Seismology and Geology, 39(4): 793—804 (in Chinese). doi: 10.3969/j.issn.0253-4967.2017.04.013 [6] 赖旭东, 李咏旭, 陈佩奇等, 2017. 机载激光雷达技术现状及展望. 地理空间信息, 15(8): 1—4 doi: 10.3969/j.issn.1672-4623.2017.08.001Lai X. D. , Li Y. X. , Chen P. Q. , et al. , 2017. Current status and outlook of LiDAR technology. Geospatial Information, 15(8): 1—4. (in Chinese) doi: 10.3969/j.issn.1672-4623.2017.08.001 [7] 李美燕, 2014. 基于改进SFM方法的航空摄影测量应用研究. 南宁: 广西大学.Li M. Y., 2014. Research on the application of improved SFM in aerial photogrammetry. Nanning: Guangxi University. (in Chinese) [8] 刘静, 陈涛, 张培震等, 2013. 机载激光雷达扫描揭示海原断裂带微地貌的精细结构. 科学通报, 58(1): 41—45 doi: 10.1360/972012-1526Liu J. , Chen T. , Zhang P. Z. , et al. , 2013. Illuminating the active Haiyuan Fault, China by airborne light detection and ranging. Chinese Science Bulletin, 58(1): 41—45. (in Chinese) doi: 10.1360/972012-1526 [9] 刘睿, 李安, 张世民等, 2017. 白杨河阶地揭示的北祁连山西段晚第四纪构造变形. 地震地质, 39(6): 1237—1255 doi: 10.3969/j.issn.0253-4967.2017.06.010Liu R. , Li A. , Zhang S. M. , et al. , 2017. The late quaternary tectonic deformation revealed by the terraces on the Baiyang river in the northern Qilian Mountains. Seismology and Geology, 39(6): 1237—1255. (in Chinese) doi: 10.3969/j.issn.0253-4967.2017.06.010 [10] 罗达, 林杭生, 金钊等, 2019. 无人机数字摄影测量与激光雷达在地形地貌与地表覆盖研究中的应用及比较. 地球环境学报, 10(3): 213—226Luo D. , Lin H. S. , Jin Z. , et al. , 2019. Applications of UAV digital aerial photogrammetry and LiDAR in geomorphology and land cover research. Journal of Earth Environment, 10(3): 213—226. (in Chinese) [11] 闵伟, 张培震, 何文贵等, 2002. 酒西盆地断层活动特征及古地震研究. 地震地质, 24(1): 35—44 doi: 10.3969/j.issn.0253-4967.2002.01.004Min W. , Zhang P. Z. , He W. G. , et al. , 2002. Research on the active faults and paleoearthquakes in the western Jiuquan basin. Seismology and Geology, 24(1): 35—44. (in Chinese) doi: 10.3969/j.issn.0253-4967.2002.01.004 [12] 佘金星, 程多祥, 刘飞等, 2018. 机载激光雷达技术在地质灾害调查中的应用——以四川九寨沟7.0级地震为例. 中国地震, 34(3): 435—444 doi: 10.3969/j.issn.1001-4683.2018.03.005She J. X. , Cheng D. X. , Liu F. , et al. , 2018. Application of airborne LiDAR technology in geological disaster investigation—taking the Jiuzhaigou MS7.0 earthquake in Sichuan province as an example. Earthquake Research in China, 34(3): 435—444. (in Chinese) doi: 10.3969/j.issn.1001-4683.2018.03.005 [13] 王朋涛, 邵延秀, 张会平等, 2016. sUAV摄影技术在活动构造研究中的应用——以海原断裂骟马沟为例. 第四纪研究, 36(2): 433—442 doi: 10.11928/j.issn.1001-7410.2016.02.18Wang P. T. , Shao Y. X. , Zhang H. P. , et al. , 2016. The application of sUAV photogrammetry in active tectonics: Shanmagou site of Haiyuan Fault, for example. Quaternary Sciences, 36(2): 433—442. (in Chinese) doi: 10.11928/j.issn.1001-7410.2016.02.18 [14] 魏占玉, Ramon A. , 何宏林等, 2015. 基于SfM方法的高密度点云数据生成及精度分析. 地震地质, 37(2): 636—648 doi: 10.3969/j.issn.0253-4967.2015.02.024Wei Z. Y. , Ramon A. , He H. L. , et al. , 2015. Accuracy analysis of terrain point cloud acquired by “Structure from Motion” using aerial photos. Seismology and Geology, 37(2): 636—648. (in Chinese) doi: 10.3969/j.issn.0253-4967.2015.02.024 [15] 杨海波, 杨晓平, 黄雄南等, 2016. 移动摄影测量数据与差分GPS数据的对比分析——以祁连山北麓洪水坝河东岸断层陡坎为例. 地震地质, 38(4): 1030—1046 doi: 10.3969/j.issn.0253-4967.2016.04.018Yang H. B. , Yang X. P. , Huang X. N. , et al. , 2016. Data comparative analysis between SFM data and DGPS data: a case study from fault scarp in the east bank of Hongshuiba river, northern margin of the Qilian Shan. Seismology and Geology, 38(4): 1030—1046. (in Chinese) doi: 10.3969/j.issn.0253-4967.2016.04.018 [16] 杨艳伟, 2009. 基于SIFT特征点的图像拼接技术研究. 西安: 西安电子科技大学.Yang Y. W., 2009. Research on image mosaic based on SIFT feature points. Xi’an: Xidian University. (in Chinese) [17] 张志文, 任俊杰, 章小龙, 2021. 高精度无人机航测在2021年玛多7.4级地震地表破裂精细研究中的应用. 震灾防御技术, 16(3): 437—447Zhang Z. W. , Ren J. J. , Zhang X. L. , 2021. Application of high-precision UAV aerial survey in the detailed study of surface rupture of Maduo MS7.4 earthquake in 2021. Technology for Earthquake Disaster Prevention, 16(3): 437—447. (in Chinese) [18] 郑辉, 2010. 基于SIFT特征的全景图像拼接算法研究. 武汉: 武汉科技大学.Zheng H., 2010. Research of panorama image mosaic algorithm based on SIFT feature. Wuhan: Wuhan University of Science and Technology. (in Chinese) [19] Arrowsmith J. R. , Zielke O. , 2009. Tectonic geomorphology of the San Andreas Fault zone from high resolution topography: an example from the Cholame segment. Geomorphology, 113(1—2): 70—81. doi: 10.1016/j.geomorph.2009.01.002 [20] Bemis S. P. , Micklethwaite S. , Turner D. , et al. , 2014. Ground-based and UAV-Based photogrammetry: a multi-scale, high-resolution mapping tool for structural geology and paleoseismology. Journal of Structural Geology, 69: 163—178. doi: 10.1016/j.jsg.2014.10.007 [21] Bi H. Y. , Zheng W. J. , Ren Z. K. , et al. , 2017. Using an unmanned aerial vehicle for topography mapping of the fault zone based on structure from motion photogrammetry. International Journal of Remote Sensing, 38(8—10): 2495—2510. doi: 10.1080/01431161.2016.1249308 [22] Fonstad M. A. , Dietrich J. T. , Courville B. C. , et al. , 2013. Topographic structure from motion: a new development in photogrammetric measurement. Earth Surface Processes and Landforms, 38(4): 421—430. doi: 10.1002/esp.3366 [23] Harwin S. , Lucieer A. , 2012. Assessing the accuracy of georeferenced point clouds produced via multi-view stereopsis from unmanned aerial vehicle (UAV) imagery. Remote Sensing, 4(6): 1573—1599. doi: 10.3390/rs4061573 [24] Hudnut K. W. , Borsa A. , Glennie C. , et al. , 2002. High-resolution topography along surface rupture of the 16 October 1999 hector mine, California, earthquake (MW 7.1) from airborne laser swath mapping. Bulletin of the Seismological Society of America, 92(4): 1570—1576. doi: 10.1785/0120000934 [25] James M. R. , Robson S. , 2012. Straightforward reconstruction of 3D surfaces and topography with a camera: accuracy and geoscience application. Journal of Geophysical Research, 117(F3): F03017. [26] Javernick L. , Brasington J. , Caruso B. , 2014. Modeling the topography of shallow braided rivers using Structure-from-Motion photogrammetry. Geomorphology, 213: 166—182. doi: 10.1016/j.geomorph.2014.01.006 [27] Johnson K. , Nissen E. , Saripalli S. , et al. , 2014. Rapid mapping of ultrafine fault zone topography with structure from motion. Geosphere, 10(5): 969—986. doi: 10.1130/GES01017.1 [28] Lowe D. G. , 2004. Distinctive image features from scale-invariant keypoints. International Journal of Computer Vision, 60(2): 91—110. doi: 10.1023/B:VISI.0000029664.99615.94 [29] Lucieer A. , de Jong S. M. , Turner D. , 2014. Mapping landslide displacements using Structure from Motion (SfM) and image correlation of multi-temporal UAV photography. Progress in Physical Geography: Earth and Environment, 38(1): 97—116. doi: 10.1177/0309133313515293 [30] Mancini F. , Dubbini M. , Gattelli M. , et al. , 2013. Using unmanned aerial vehicles (UAV) for high-resolution reconstruction of topography: the structure from motion approach on coastal environments. Remote Sensing, 5(12): 6880—6898. doi: 10.3390/rs5126880 [31] Okyay U. , Telling J. , Glennie C. L. , et al. , 2019. Airborne lidar change detection: an overview of Earth sciences applications. Earth-Science Reviews, 198: 102929. doi: 10.1016/j.earscirev.2019.102929 [32] Tomasi C. , Kanade T. , 1992. Shape and motion from image streams under orthography: a factorization method. International Journal of Computer Vision, 9(2): 137—154. doi: 10.1007/BF00129684 [33] Ullman S. , 1979. The interpretation of structure from motion. Proceedings of the Royal Society B: Biological Sciences, 203(1153): 405—426. [34] Wei Y. M. , Kang L. , Yang B. , et al. , 2013. Applications of structure from motion: a survey. Journal of Zhejiang University SCIENCE C, 14(7): 486—494. doi: 10.1631/jzus.CIDE1302 [35] Westoby M. J. , Brasington J. , Glasser N. F. , et al. , 2012. ‘Structure-from-Motion’ photogrammetry: a low-cost, effective tool for geoscience applications. Geomorphology, 179: 300—314. doi: 10.1016/j.geomorph.2012.08.021 [36] Zielke O. , Arrowsmith J. R. , Grant Ludwig L. , et al. , 2012. High-resolution topography-derived offsets along the 1857 Fort Tejon earthquake rupture trace, San Andreas fault. Bulletin of the Seismological Society of America, 102(3): 1135—1154. doi: 10.1785/0120110230 -

 点击查看大图

计量
- 文章访问数: 402
- HTML全文浏览量: 109
- PDF下载量: 96
- 被引次数: 0
