Experimental Study on the Bonding Behavior of PET FRP and Concrete Interface
-
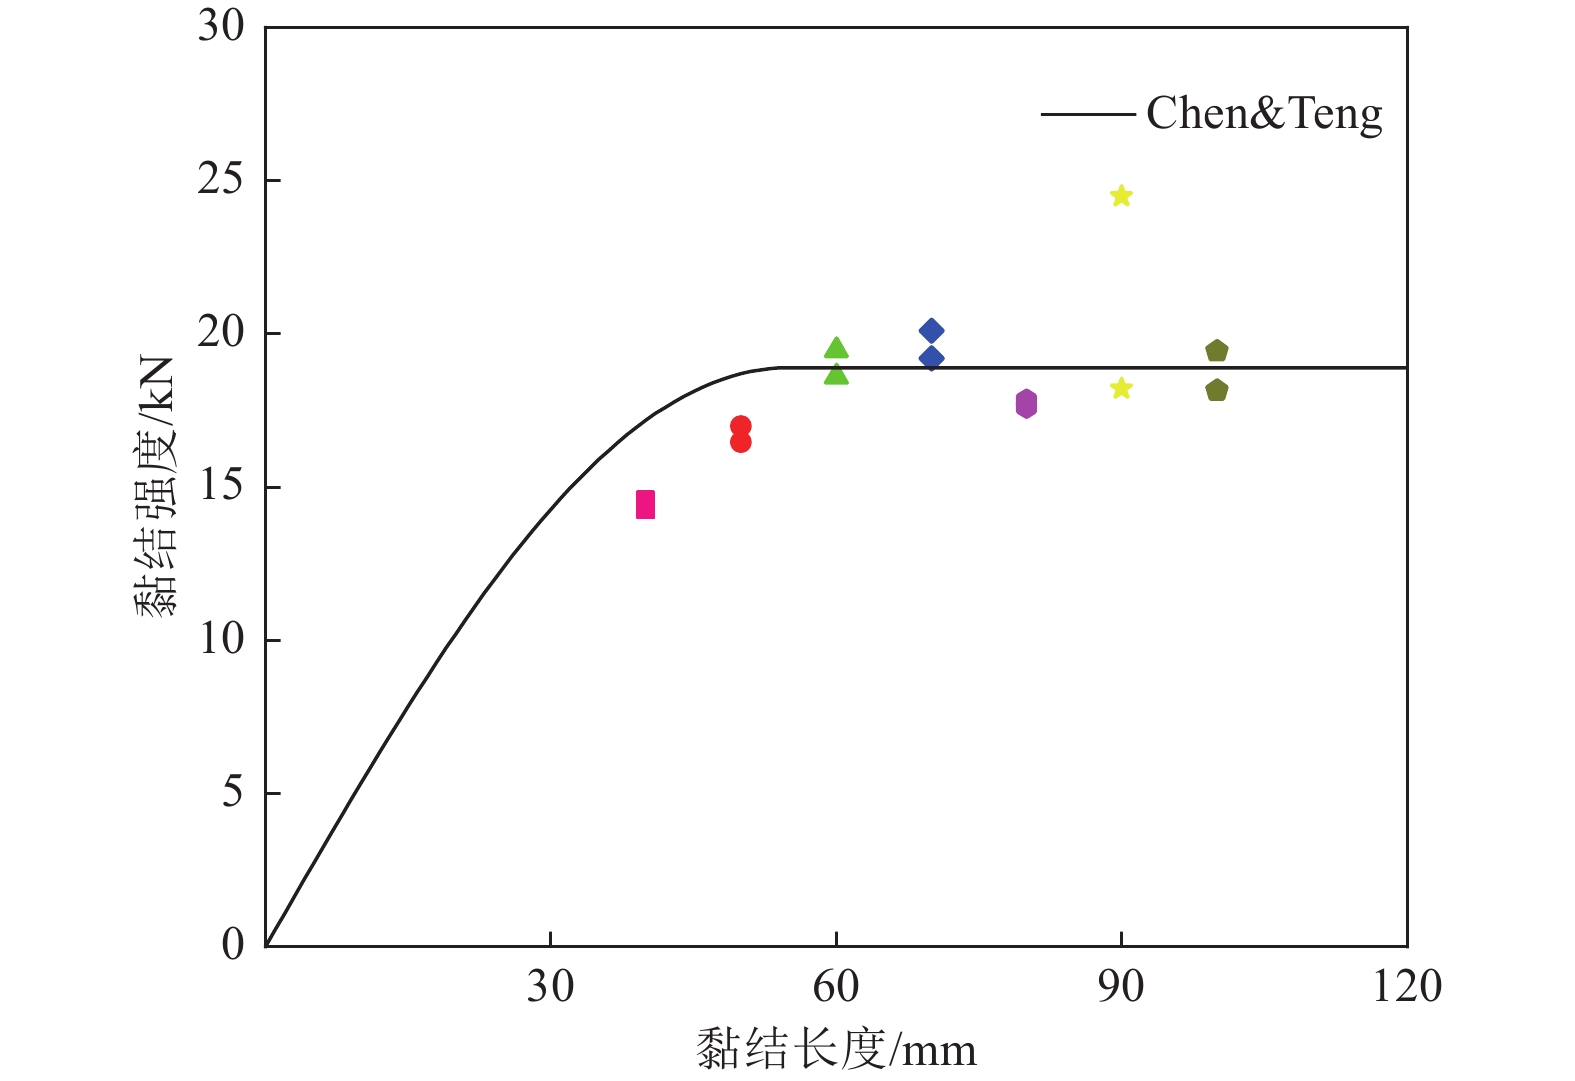
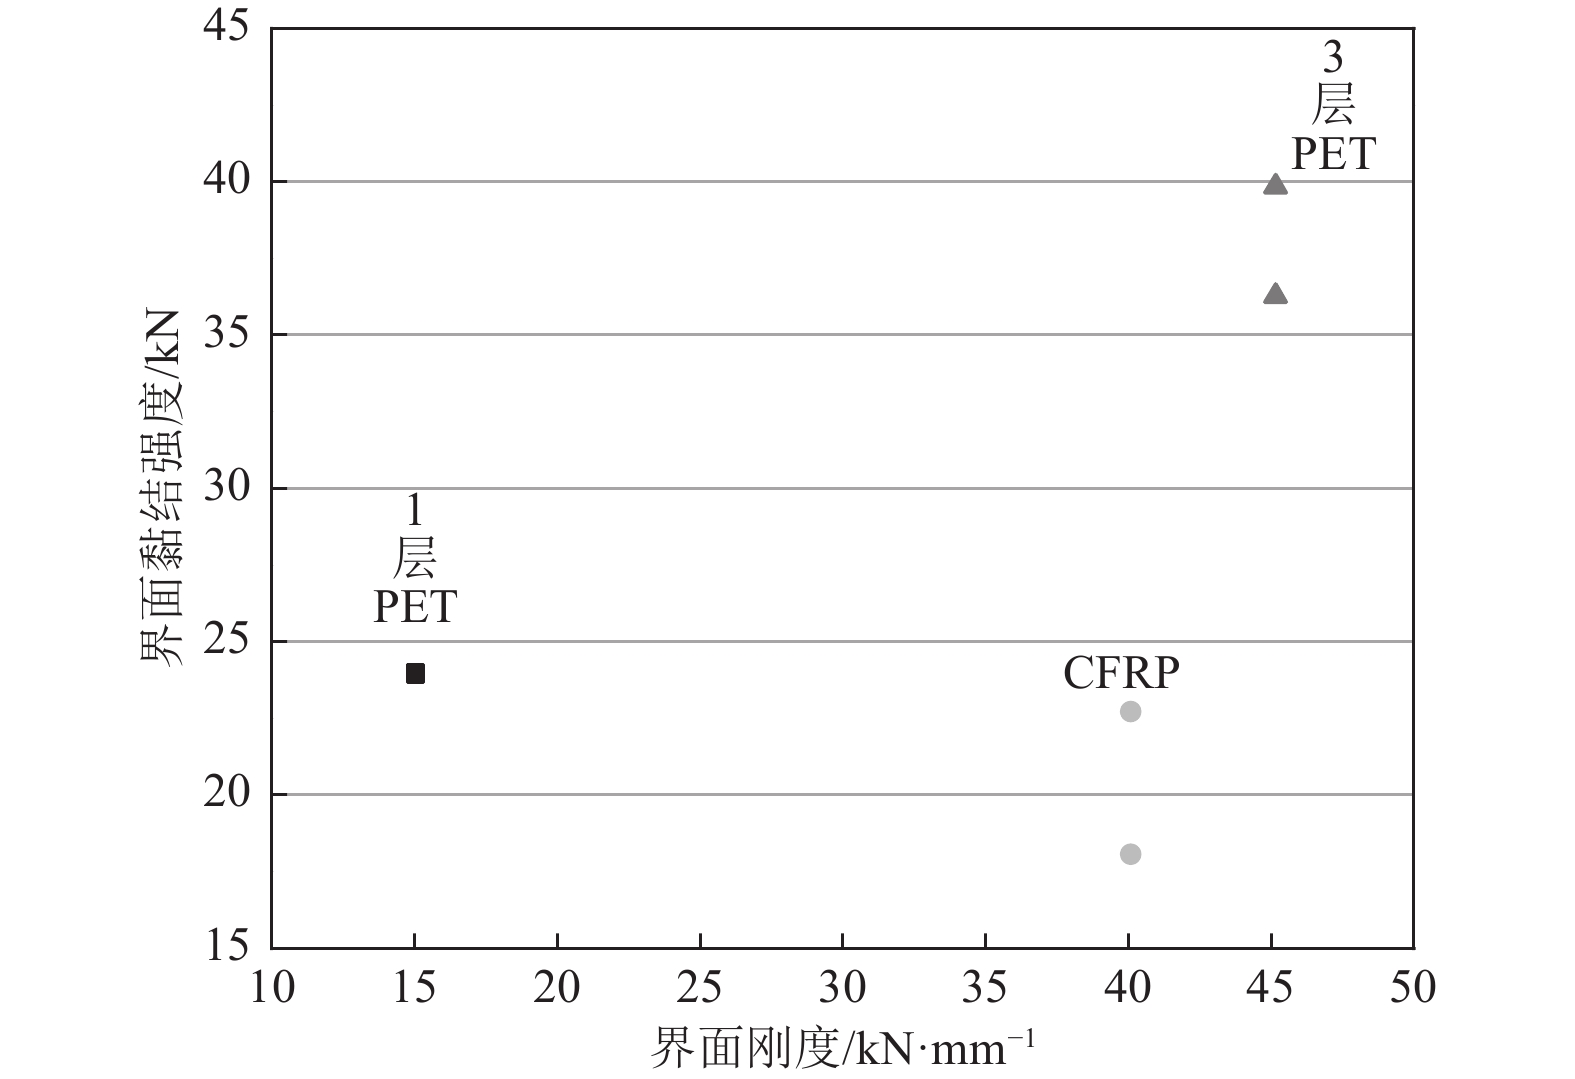
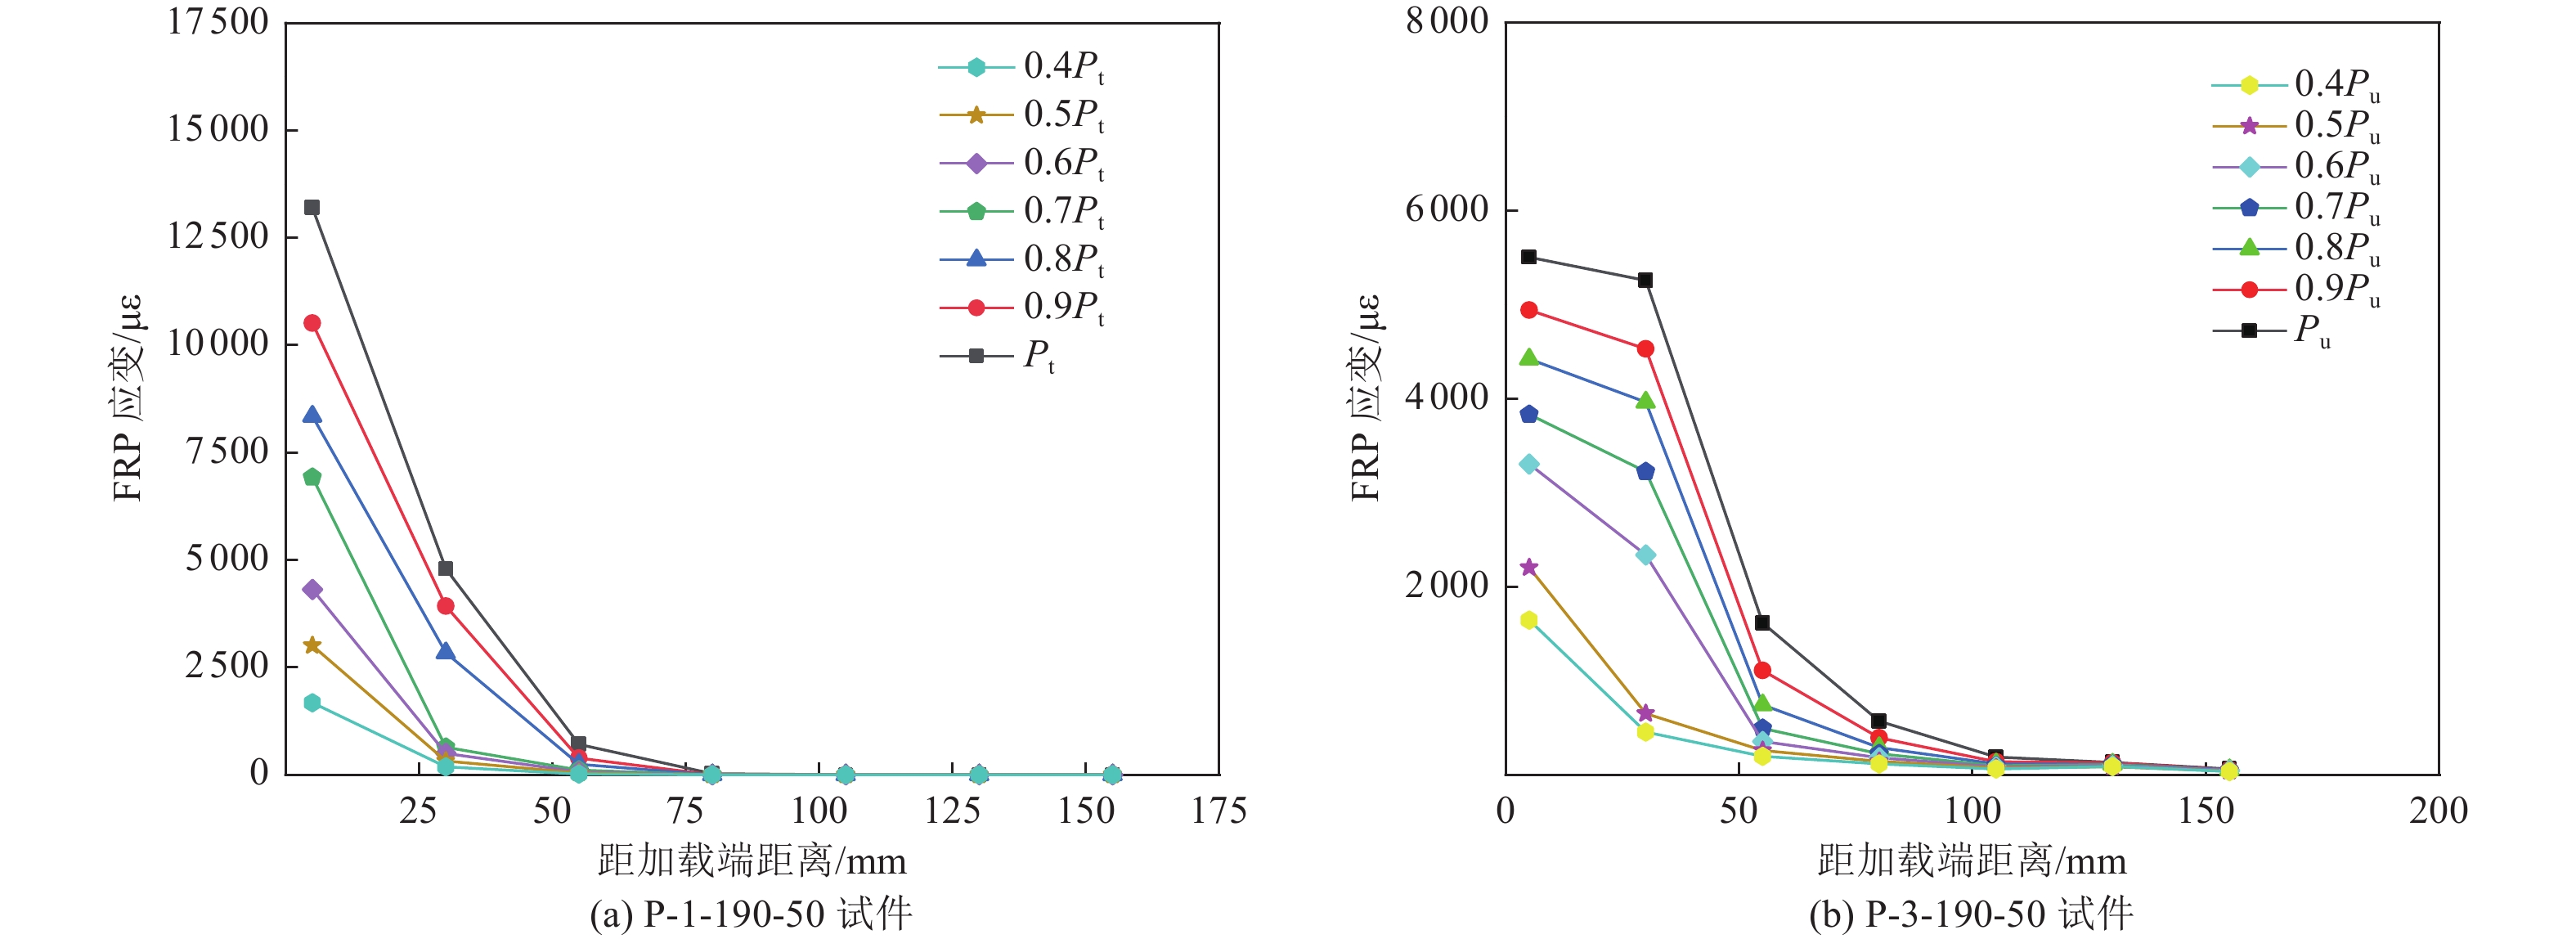
摘要: 通过双面剪切试验对24个试件进行高延性纤维增强复合材料(PET FRP)与混凝土界面黏结性能研究,研究参数包括FRP种类、FRP黏结厚度、黏结长度和黏结宽度;分析各参数对PET FRP与混凝土黏结性能的影响,基于试验结果评估现有黏结滑移关系模型,并进行模型修正。研究结果表明,在有效黏结长度内,随着黏结长度的增加,PET FRP与混凝土界面黏结强度增大;当超过有效黏结长度后,增加PET FRP黏结长度不能明显增加界面黏结强度,但可提高试件破坏的延性;增加PET FRP黏结宽度可提高界面黏结强度,但会受PET FRP黏结宽度和混凝土宽度比值的影响;当界面刚度接近时,碳纤维增强复合材料(CFRP)与混凝土界面黏结强度远小于PET FRP与混凝土界面黏结强度。Abstract: The interfacial properties of PET FRP and concrete were studied on 24 specimens through double shear test. The test parameters included FRP type, PET FRP bonding thickness, length and width. The influence of each parameter on the result was analyzed in detail. Results showed that within the effective bonding length, as the length increases, the bond strength also increases. When the effective bond length was exceeded, increasing the bond length could not significantly increase its bond strength, but it could increase the ductility of failure. Increasing the bonding width of PET FRP could also increase the interface bonding strength, but it would be affected by the ratio of the bonding width of PET FRP to the width of the concrete. When the interface stiffness is close, the bond strength between CFRP and concrete is much smaller than that of PET FRP. Based on the experimental results, the existing bond-slip relationship model was evaluated and model corrections were made.
-
Key words:
- Interface bonding performance /
- Double shear test /
- Bond-slip relationship /
- PET FRP /
- Concrete
-
表 1 试验参数与结果
Table 1. Test plan and results
编号 FRP种类 FRP层数 黏结长度/
mm黏结宽度/
mm试验测得的界面
极限荷载Pt/kNChen等(2001)对黏结强度的
预测值Pu/kNPt/Pu P-1-40-50-I PET 1 40 50 14.59 10.53 1.39 P-1-40-50-II PET 1 40 50 14.24 10.53 1.35 P-1-50-50-I PET 1 50 50 16.46 11.45 1.44 P-1-50-50-II PET 1 50 50 16.99 11.45 1.48 P-1-60-50-I PET 1 60 50 19.46 11.58 1.68 P-1-60-50-II PET 1 60 50 18.61 11.58 1.61 P-1-70-50-I PET 1 70 50 20.1 11.58 1.74 P-1-70-50-II PET 1 70 50 19.21 11.58 1.66 P-1-80-50-I PET 1 80 50 17.61 11.58 1.52 P-1-80-50-II PET 1 80 50 17.84 11.58 1.54 P-1-90-50-I PET 1 90 50 24.49 11.58 2.11 P-1-90-50-II PET 1 90 50 18.21 11.58 1.57 P-1-100-50-I PET 1 100 50 18.16 11.58 1.57 P-1-100-50-II PET 1 100 50 19.43 11.58 1.68 P-1-190-50-I PET 1 190 50 23.98 11.58 2.07 P-1-190-50-II PET 1 190 50 23.91 11.58 2.06 P-1-190-30-I PET 1 190 30 14.04 7.94 1.77 P-1-190-30-II PET 1 190 30 12.74 7.94 1.60 P-1-190-70-I PET 1 190 70 24.94 14.18 1.76 P-1-190-70-II PET 1 190 70 34.70 14.18 2.45 P-3-190-50-I PET 3 190 50 39.84 20.06 1.99 P-3-190-50-II PET 3 190 50 36.27 20.06 1.81 C-1-190-50-I CFRP 1 190 50 22.72 20.68 1.10 C-1-190-50-II CFRP 1 190 50 18.06 20.68 0.87 注:I和II代表2个完全相同的构件 表 2 FRP力学参数
Table 2. Mechanical parameters of FRP
FRP种类 名义黏结厚度/mm 抗拉强度/MPa 第1段弹性模量/GPa 第2段弹性模量/GPa 伸长率/% CFRP 0.167 3 972 245.5 — 1.77 PET FRP(PET-600) 0.841 740 17.9 8.3 8.30 表 3 界面黏结强度实测值与修正值对比
Table 3. Comparison of measured value and modified formula of interface bond strength
编号 FRP种类 试验测得的界面极限荷载Pt/kN 界面黏结强度修正值Pm/kN Pt/Pm P-1-40-50-I PET 14.59 18.11 0.81 P-1-40-50-II PET 14.24 18.11 0.79 P-1-50-50-I PET 16.46 19.69 0.84 P-1-50-50-II PET 16.99 19.69 0.86 P-1-60-50-I PET 19.46 19.92 0.98 P-1-60-50-II PET 18.61 19.92 0.93 P-1-70-50-I PET 20.1 19.92 1.01 P-1-70-50-II PET 19.21 19.92 0.96 P-1-80-50-I PET 17.61 19.92 0.88 P-1-80-50-II PET 17.84 19.92 0.90 P-1-90-50-I PET 24.49 19.92 1.23 P-1-90-50-II PET 18.21 19.92 0.91 P-1-100-50-I PET 18.16 19.92 0.91 P-1-100-50-II PET 19.43 19.92 0.98 P-1-190-50-I PET 23.98 19.92 1.20 P-1-190-50-II PET 23.91 19.92 1.20 P-1-190-30-I PET 14.04 13.66 1.03 P-1-190-30-II PET 12.74 13.66 0.93 P-1-190-70-I PET 24.94 24.39 1.02 P-1-190-70-II PET 34.7 24.39 1.42 P-3-190-50-I PET 39.84 34.5 1.15 P-3-190-50-II PET 36.27 34.5 1.05 表 4 各模型对峰值剪应力与对应滑移量试验值和预测值比值的对比
Table 4. Comparison of various models and experimental results
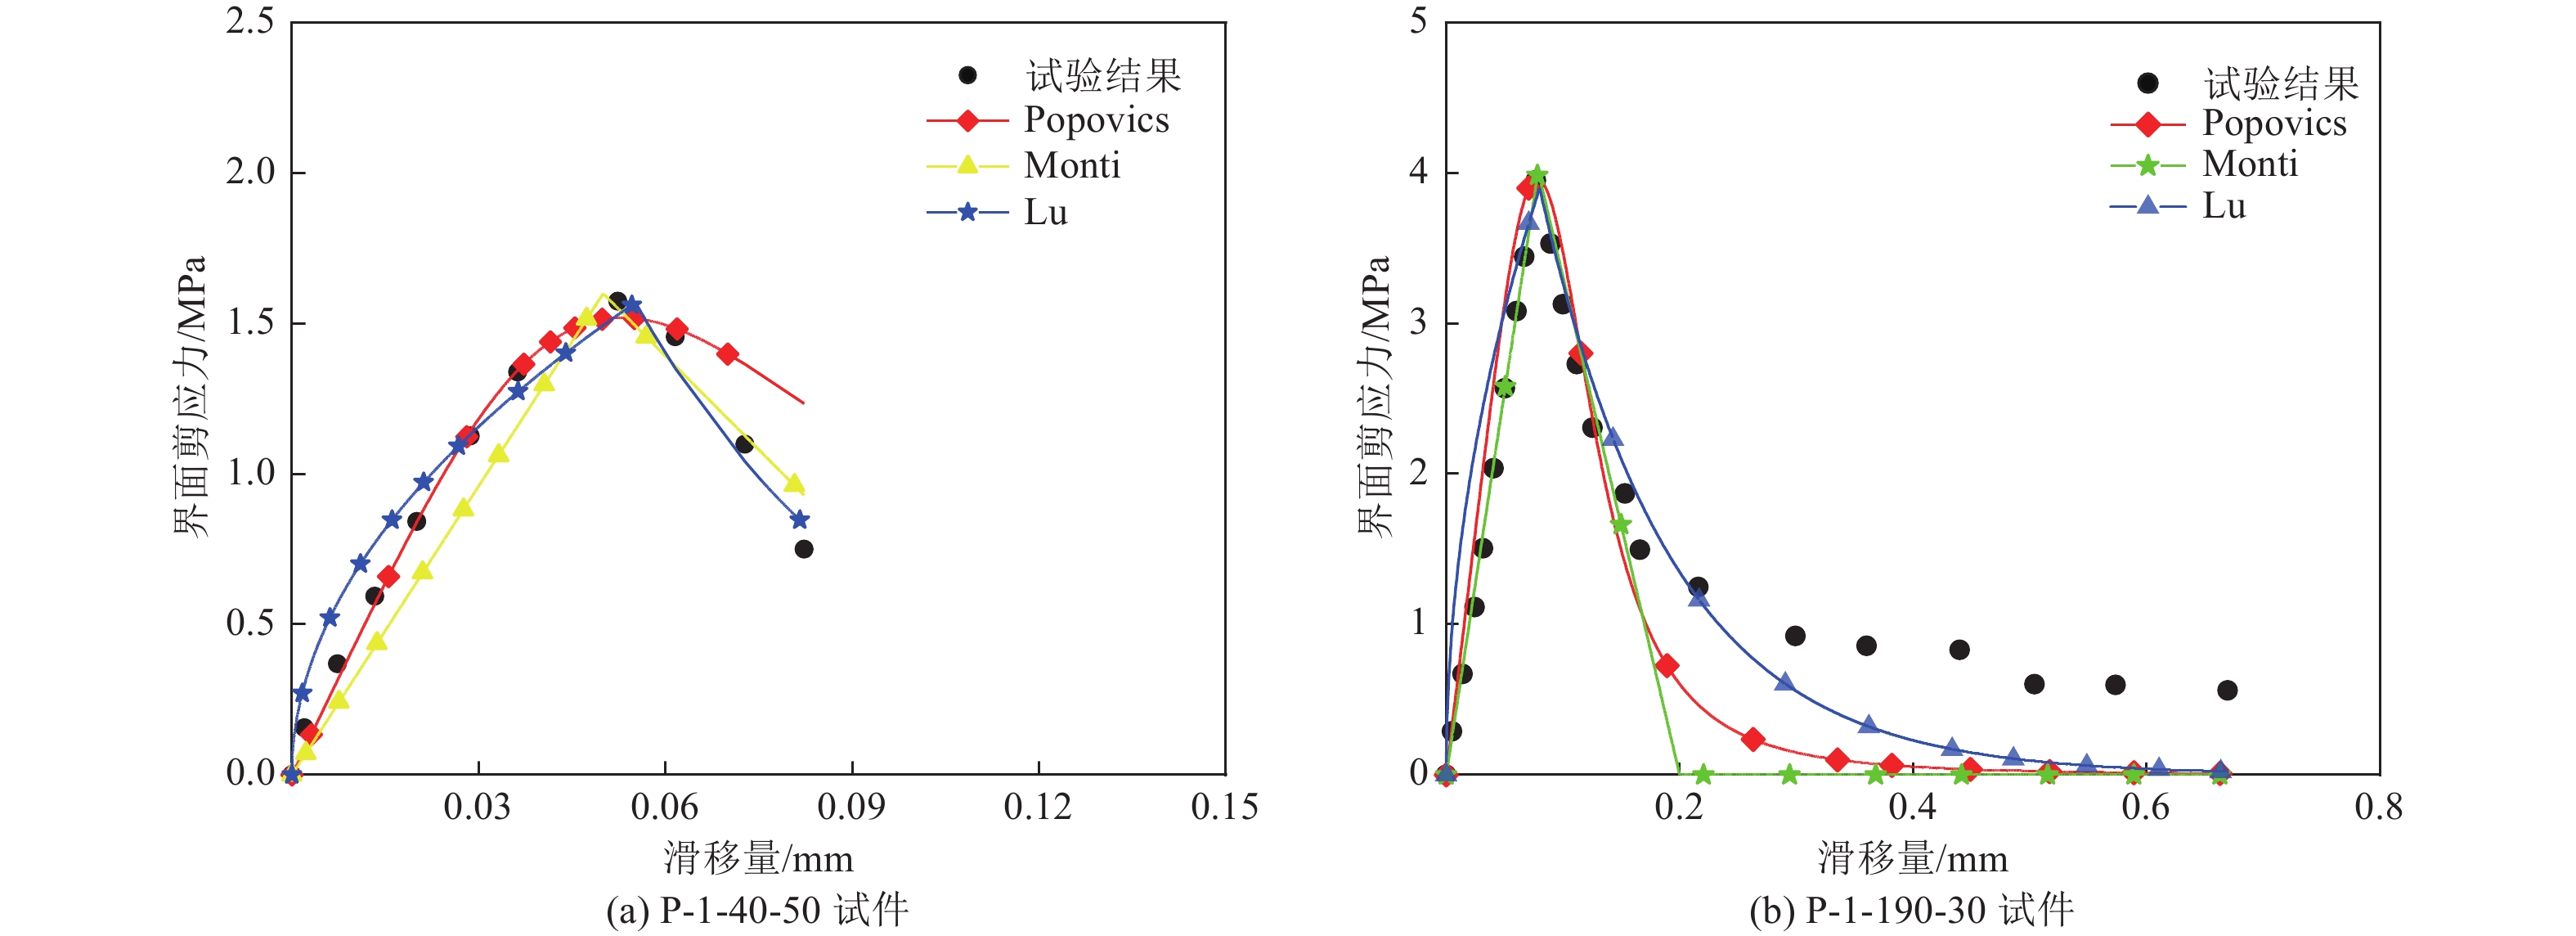
编号 Popovics模型τt/τp Monti双线性模型τt/τp 陆新征简化模型τt/τp Popovics模型S0,t/S0,p Monti双线性模型S0,t/S0,p 陆新征简化模型S0,t/S0,p P-1-40-50 0.25 0.38 0.47 0.80 1.73 1.11 P-1-50-50 0.35 0.54 0.66 1.69 3.67 2.34 P-1-60-50 0.53 0.82 1.01 1.25 2.72 1.73 P-1-70-50 0.63 0.96 1.18 1.48 3.20 2.04 P-1-80-50 0.80 1.22 1.51 1.38 3.00 1.91 P-1-90-50 0.53 0.82 1.01 1.69 3.67 2.34 P-1-100-50 0.46 0.71 0.88 2.15 4.67 2.98 P-1-190-50 0.59 0.91 1.12 1.78 3.87 2.47 P-3-190-50 0.82 1.26 1.55 3.08 6.67 4.26 P-1-190-30 0.62 0.95 1.04 1.23 2.67 1.54 P-1-190-70 0.59 0.90 1.25 1.38 3.00 2.14 平均值 0.56 0.86 1.06 1.63 3.53 2.26 表 5 3种模型黏结滑移关系曲线与试验结果拟合决定系数
Table 5. Fitting results of each bond-slip model and test data
编号 Popovics模型 Monti双线性模型 陆新征简化模型 P-1-200-30 0.85 0.93 0.76 P-1-200-70 0.97 0.90 0.94 P-1-200-50 0.87 0.97 0.91 P-1-40-50 0.99 0.93 0.96 P-1-60-50 0.96 0.99 0.91 P-1-70-50 0.98 0.95 0.93 P-1-80-50 0.98 0.95 0.94 P-1-90-50 0.96 0.99 0.93 P-1-100-50 0.95 0.97 0.80 平均值 0.94 0.95 0.90 表 6 试验结果与3种模型拟合的峰值剪应力和对应的滑移量
Table 6. Various situations of τmax and S0
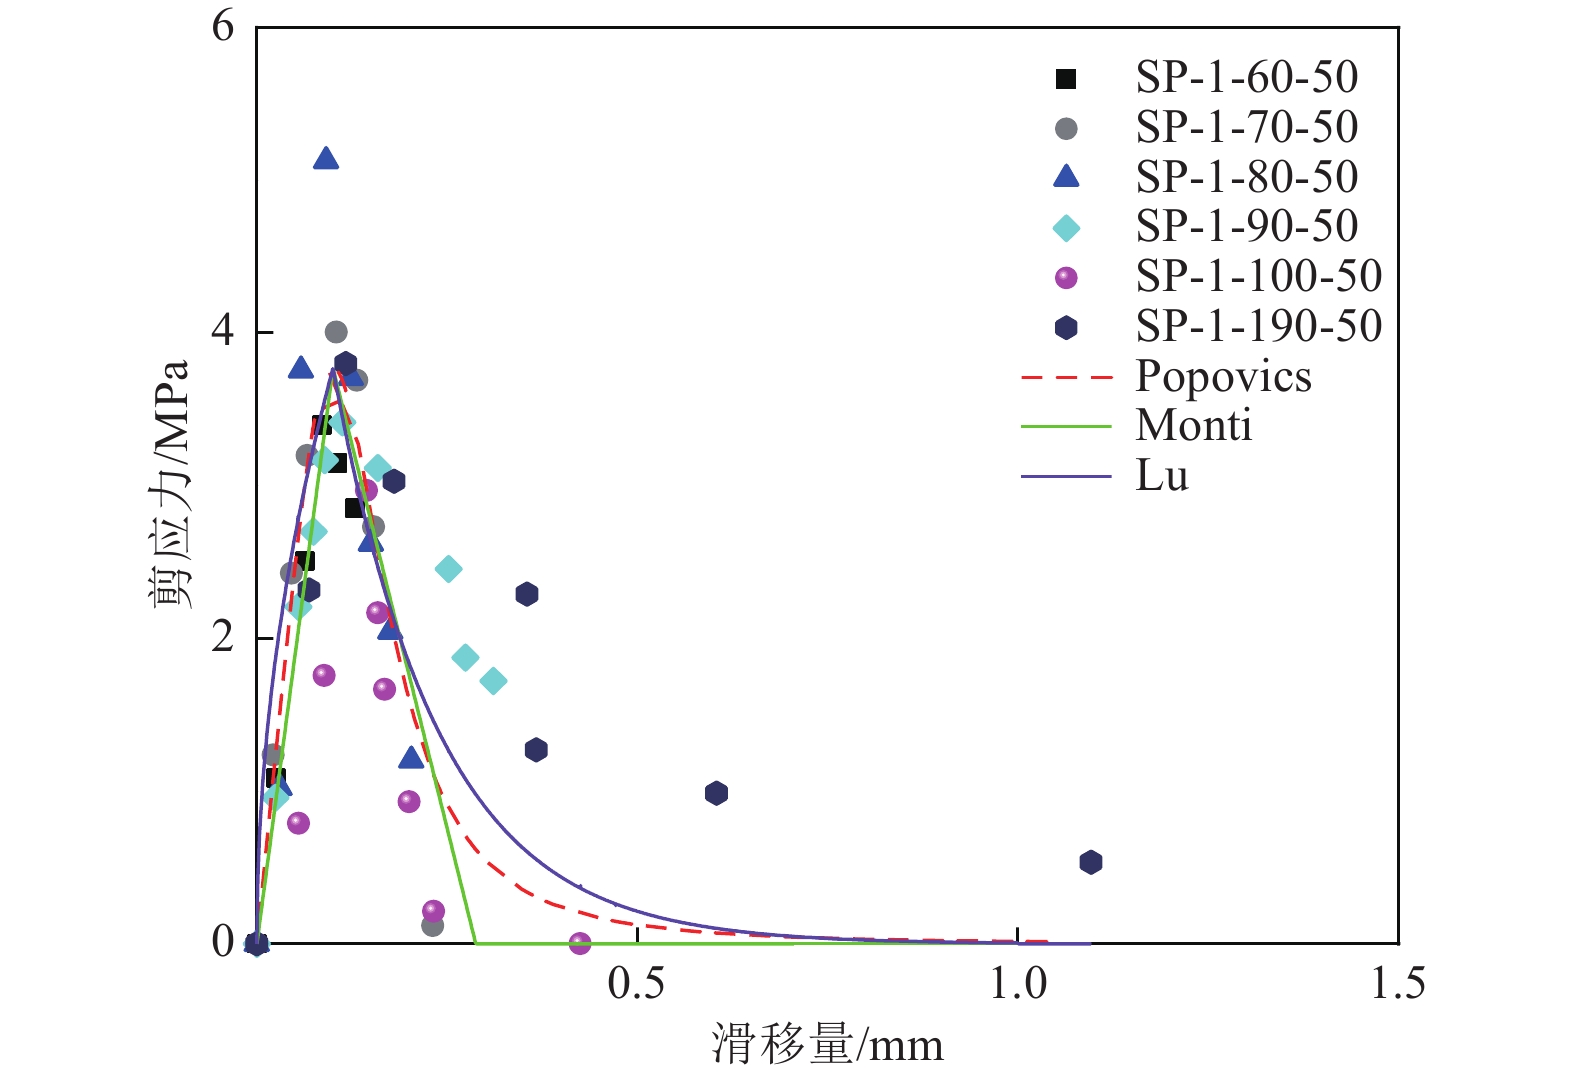
编号 试验结果 Popovics模型 Monti双线性模型 陆新征简化模型 峰值剪应力 滑移量 峰值剪应力 滑移量 峰值剪应力 滑移量 峰值剪应力 滑移量 P-1-40-50 1.58 0.05 1.51 0.05 1.59 0.05 1.57 0.06 P-1-50-50 2.24 0.11 2.08 0.07 2.10 0.06 2.20 0.09 P-1-60-50 3.42 0.08 3.40 0.09 3.39 0.07 3.33 0.10 P-1-70-50 4.01 0.10 4.00 0.10 4.34 0.09 3.99 0.11 P-1-80-50 5.12 0.09 5.11 0.09 5.11 0.09 5.10 0.10 P-1-90-50 3.42 0.11 3.39 0.11 3.39 0.09 3.30 0.12 P-1-100-50 2.97 0.14 2.96 0.15 2.95 0.14 2.27 0.16 P-1-190-50 3.81 0.12 3.79 0.12 3.78 0.11 3.51 0.17 P-1-190-30 3.96 0.08 3.96 0.08 3.95 0.08 3.90 0.08 P-1-190-70 3.78 0.09 3.78 0.09 3.77 0.08 3.80 0.09 P-3-190-50 5.25 0.24 5.24 0.24 5.25 0.23 5.25 0.37 表 7 修正公式计算结果与试验值的对比
Table 7. Comparison of modified model and experimental value
编号 修正公式计算结果τt/τp 修正公式计算结果S0,t/S0,p 试验值τt 公式计算结果τp 试验值S0,t 公式计算结果S0,p P-1-40-50 0.45 0.52 1.58 3.54 0.05 0.10 P-1-50-50 0.63 1.10 2.24 3.54 0.11 0.10 P-1-60-50 0.97 0.82 3.42 3.54 0.08 0.10 P-1-70-50 1.13 0.96 4.01 3.54 0.10 0.10 P-1-80-50 1.45 0.90 5.12 3.54 0.09 0.10 P-1-90-50 0.97 1.10 3.42 3.54 0.11 0.10 P-1-100-50 0.84 1.40 2.97 3.54 0.14 0.10 P-1-190-50 1.07 1.16 3.81 3.54 0.12 0.10 P-1-190-30 1.00 0.71 3.96 3.97 0.08 0.11 P-1-190-70 1.20 1.01 3.78 3.16 0.09 0.09 平均值 0.97 0.97 — — — — -
[1] 谷倩, 张祥顺, 彭少民, 2003. 新材料FRP的研究与应用综述. 华中科技大学学报(城市科学版), 20(1): 88—92Gu Q. , Zhang X. S. , Peng S. M. , 2003. General introduction of the study and application of new FRP materials. Journal of Huazhong University of Science and Technology (Urban Science Edition), 20(1): 88—92. (in Chinese) [2] 陆新征, 2005. FRP-混凝土界面行为研究. 北京: 清华大学.Lu X. Z., 2005. Studies on FRP-concrete interface. Beijing: Tsinghua University. (in Chinese) [3] ASTM International, 2014. ASTM D3039/D3039M-2014 Standard test method for tensile properties of polymer matrix composite materials. West Conshohocken: ASTM. [4] Bai Y. L. , Dai J. G. , Mohammadi M. , et al. , 2019. Stiffness-based design-oriented compressive stress-strain model for large-rupture-strain (LRS) FRP-confined concrete. Composite Structures, 223: 110953. doi: 10.1016/j.compstruct.2019.110953 [5] Chen J. F. , Teng J. G. , 2001. Anchorage strength models for FRP and steel plates bonded to concrete. Journal of Structural Engineering, 127(7): 784—791. doi: 10.1061/(ASCE)0733-9445(2001)127:7(784) [6] Dai J. G. , Bai Y. L. , Teng J. G. , 2011. Behavior and modeling of concrete confined with FRP composites of large deformability. Journal of Composites for Construction, 15(6): 963—973. doi: 10.1061/(ASCE)CC.1943-5614.0000230 [7] Huo J. S. , Liu J. Y. , Lu Y. , et al. , 2016. Experimental study on dynamic behavior of GFRP-to-concrete interface. Engineering Structures, 118: 371—382. doi: 10.1016/j.engstruct.2016.03.062 [8] Idris Y. , Ozbakkaloglu T. , 2016. Behavior of square fiber reinforced polymer–high-strength concrete–steel double-skin tubular columns under combined axial compression and reversed-cyclic lateral loading. Engineering Structures, 118: 307—319. doi: 10.1016/j.engstruct.2016.03.059 [9] Lin J. P. , Wu Y. F. , 2016. Numerical analysis of interfacial bond behavior of externally bonded FRP-to-concrete joints. Journal of Composites for Construction, 20(5): 04016028. doi: 10.1061/(ASCE)CC.1943-5614.0000678 [10] Liu X. F. , Li Y. , 2019. Static bearing capacity of partially corrosion-damaged reinforced concrete structures strengthened with PET FRP composites. Construction and Building Materials, 211: 33—43. doi: 10.1016/j.conbuildmat.2019.03.218 [11] Lu X. Z. , Teng J. G. , Ye L. P. , et al. , 2005. Bond–slip models for FRP sheets/plates bonded to concrete. Engineering Structures, 27(6): 920—937. doi: 10.1016/j.engstruct.2005.01.014 [12] Monti G. , Renzelli M. , Luciani P. , 2003. FRP adhesion in uncracked and cracked concrete zones. In: Proceedings of the 6th International Symposium on FRP Reinforcement for Concrete Structures. Singapure: World Scientific Publishing, 183—192. [13] Nakaba K. , Kanakubo T. , Furuta T. , et al. , 2001. Bond Behavior between Fiber-Reinforced Polymer Laminates and Concrete. ACI Structural Journal, 98(3): 359—367. [14] Ozbakkaloglu T. , Saatcioglu M. , 2017. Displacement-based model to predict lateral drift capacities of concrete-filled FRP tube columns. Engineering Structures, 147: 345—355. doi: 10.1016/j.engstruct.2017.05.045 [15] Tao Y. , Chen J. F. , 2015. Concrete damage plasticity model for modeling FRP-to-concrete bond behavior. Journal of Composites for Construction, 19(1): 04014026. doi: 10.1061/(ASCE)CC.1943-5614.0000482 -


 下载:
下载:
