Application of Building Spatial Distribution Method Based on Remote Sensing Image in Earthquake Disaster Loss Pre-assessment
-
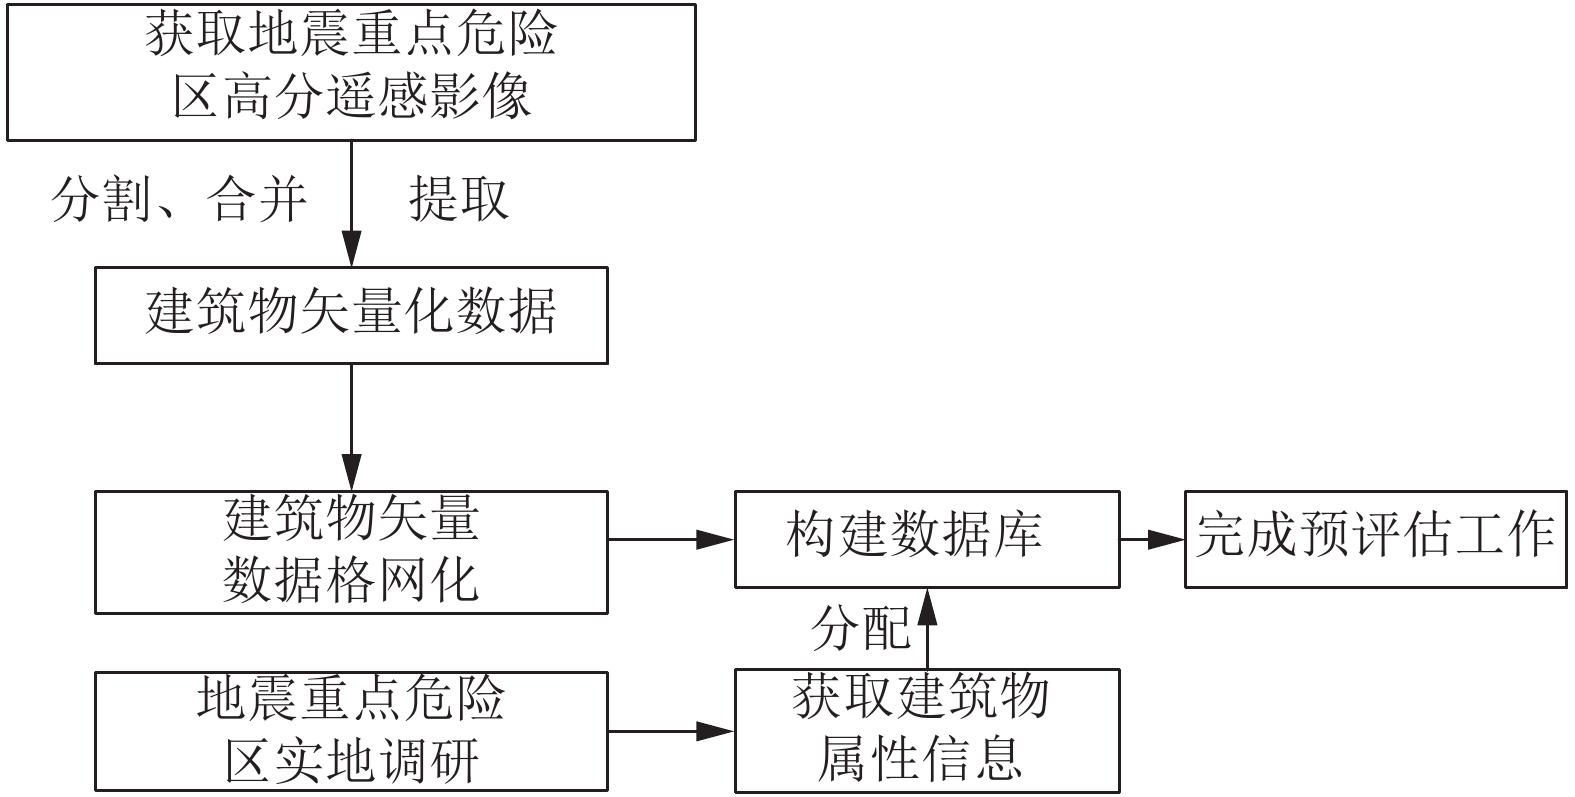
摘要: 房屋建筑数据是地震重点危险区预评估工作的基础,需基于获取到的房屋建筑信息开展人员伤亡、经济损失、救援物资需求等预评估工作。历年地震重点危险区预评估工作能够通过现场调查得到的房屋建筑信息占比极小,仅能进行抽样调查。因此,为批量完成危险区内全部房屋建筑损失估算,需基于遥感影像获取房屋建筑矢量数据,并建立数据库。为实现全国地震重点危险区预评估工作中大批量建筑物矢量化数据的快速获取,本文采用基于遥感影像的建筑物空间分布数据批量获取方法,得到地震重点危险区内建筑物空间矢量数据,结合现场抽样调查得到的建筑物属性信息,建立地震重点危险区建筑物空间分布数据库,进而为地震重点危险区灾害损失预评估工作提供数据基础。本文采用的方法可广泛应用于地震重点危险区房屋建筑信息获取工作中,可提高工作效率,降低工作成本,提升预评估工作的科学性和准确性。Abstract: Building data is the basis of pre-assessment of key earthquake risk areas. Based on the obtained building information, pre-assessment of casualties, economic losses and relief material needs can be carried out. In the pre-assessment of key earthquake risk areas over the years, the proportion of building information obtained through field investigation is very small, so it can only be sampled. Therefore, in order to estimate the loss of all buildings in the dangerous area in batches, the best way is to obtain the vector data of buildings based on remote sensing images and establish a database. In order to achieve the rapid acquisition of large quantities of building vector data in the pre-assessment of key seismic risk areas in China, this paper proposes a method of building spatial distribution data batch acquisition based on remote sensing images, and then obtains the building spatial vector data in the key seismic risk areas, combined with the building attribute information obtained from the field sampling survey, The spatial distribution database of buildings in key seismic risk areas is established to provide data basis for disaster loss pre assessment in key seismic risk areas. The method proposed in this paper can be widely used in the acquisition of building information in key seismic risk areas in the future, which can not only improve the work efficiency, but also reduce the cost, and improve the scientificity and accuracy of pre-assessment.
-
Key words:
- Key seismic risk area /
- Pre assessment /
- Remote sensing image /
- Building /
- Spatial distribution
-
表 1 格网数据表结构
Table 1. Grid data table structure
字段名 中文名 字段类型 字段长度 是否可空 OBJECTID 要素ID Integer 14 否 GRIDID 网格ID VarChar 14 否 BUILDNUM 建筑物数量 Number 20 是 EARTHAREA 建筑物占地面积 Number 10 是 BUILDAREA 建筑物面积 Number 10 是 表 2 建筑物数据表结构
Table 2. Buildings data table structure
字段名 中文名 字段类型 字段长度 是否可空 OBJECTID 要素ID Integer 14 否 COUNTYID 区县ID VarChar 14 否 COUNTYNAME 区县名称 VarChar 40 是 CITYNAME 市名称 VarChar 40 是 PROVINCENAME 省名称 VarChar 40 是 BUILDID 建筑ID VarChar 14 是 GRIDID 网格ID VarChar 14 是 表 3 区县建筑数据表结构
Table 3. District and county building data table structure
字段名称 字段描述 字段类型 字段长度 OBJECTID 唯一标识符 Number 14 PROVINCE 省编码 nvarchar 14 XZQMC 区县行政区名称 nvarchar 40 XZQEMC 行政区名称拼音 nvarchar 40 FULLNAME 全名 nvarchar 40 CITY 市代码 nvarchar 10 CITYNAME 市名称 nvarchar 10 XZQDM 区县行政区代码 nvarchar 14 EARTHAREA 占地面积 Number 10 BUILDAREA 建筑面积 Number 10 BUILDNUM 建筑物数量 nvarchar 10 表 4 山西省临汾市尧都区和晋中市榆次区建筑物结构类型比例(单位:%)
Table 4. Proportion table of building structure types in Yaodu district of Linfen city and Yuci district of Jinzhong city, Shanxi province(Unit:%)
地区结构类型 砌体结构 钢混结构 钢结构 单层民宅 单层厂房 临汾市尧都区 70.67 5.48 0.22 21.08 2.54 晋中市榆次区 57.47 5.53 1.75 31.28 3.97 表 5 山西省临汾市尧都区和晋中市榆次区建筑物层数比例(单位:%)
Table 5. Proportion table of building floors in Yaodu district of Linfen city and Yuci district of Jinzhong city, Shanxi province(Unit:%)
地区层数 10层及以上 7~9层 3~6层 1~2层 临汾市尧都区 0.88 0.39 14.93 83.73 晋中市榆次区 1.42 0.35 16.37 81.86 表 6 山西省浑源县建筑物结构类型比例(单位:%)
Table 6. Proportion table of building structure types in Hunyuan county of Shanxi province(Unit:%)
城镇地区 农村地区 结构类型 占比 结构类型 占比 砖混结构 77.16 砖混结构 7.60 砖木结构 3.20 砖木结构 72.30 土木结构 0.49 土木结构 11.20 土石结构 0 土石结构 8.90 钢混结构 18.66 钢混结构 0 钢结构 0.49 钢结构 0 木结构 0 木结构 0 其他结构 0 其他结构 0 表 7 设定地震预评估结果
Table 7. Table of pre-evaluation results
震级 灾区面积/km2 灾区人口/万人 灾区GDP/亿元 预评估结果 死亡人数/人 受伤人数/人 需紧急安置人数/人 需紧急救援力量/人 需帐篷数/顶 5.5 1 096 36 17 0~20 10~80 14 600~16 600 2 000~2 200 2 500~2 700 6.0 4 723 88 36 5~60 50~200 39 800~41 800 5 200~5 400 6 700~6 900 6.5 14 956 261 160 15~100 600~2 000 97 400~99 400 14 600~16 600 15 400~17 400 -
[1] 邓宏宇, 孙柏涛, Dong W. M., 2013. 遥感技术在地震应急基础数据库建设中的应用. 地震工程与工程振动, 33(3): 81—87.Deng H. Y., Sun B. T., Dong W. M., 2013. The application of remote sensing technology in the construction of earthquake emergency foundational database. Journal of Earthquake Engineering and Engineering Vibration, 33(3): 81—87. (in Chinese) [2] 罗磊, 汪斌, 2018. 基于GIS的震后修复建筑物空间分布格网化方法研究. 地震工程学报, 40(6): 1362—1365. doi: 10.3969/j.issn.1000-0844.2018.06.1362Luo L., Wang B., 2018. GIS-based gridding method for spatial distribution of post-earthquake repaired buildings. China Earthquake Engineering Journal, 40(6): 1362—1365. (in Chinese) doi: 10.3969/j.issn.1000-0844.2018.06.1362 [3] 石玉成, 高晓明, 谭明等, 2013. 2013年岷县漳县6.6级地震灾害损失评估. 地震工程学报, 35(4): 717—723. doi: 10.3969/j.issn.1000-0844.2013.04.0717Shi Y. C., Gao X. M., Tan M., et al., 2013. Disaster loss assessment of the Minxian-Zhangxian MS6.6 Earthquake, 2013. China Earthquake Engineering Journal, 35(4): 717—723. (in Chinese) doi: 10.3969/j.issn.1000-0844.2013.04.0717 [4] 魏本勇, 聂高众, 苏桂武等, 2017. 基于公里格网的地震人员埋压风险评估——以云南昭通市为例. 见: 2017中国地球科学联合学术年会论文集. 北京: 中国地球物理学会, 1938—1940. [5] 熊俊楠, 韦方强, 苏鹏程等, 2013. 基于多源数据的四川省GDP公里格网化研究. 应用基础与工程科学学报, 21(2): 317—327. doi: 10.3969/j.issn.1005-0930.2013.02.013Xiong J. N., Wei F. Q., Su P. C., et al., 2013. Research on GDP Spatialization approach of Sichuan province supported by multi-source data. Journal of Basic Science and Engineering, 21(2): 317—327. (in Chinese) doi: 10.3969/j.issn.1005-0930.2013.02.013 [6] 徐国栋, 袁艺, 方伟华等, 2011. 玉树7.1级地震震后损失快速评估. 地震工程与工程振动, 31(1): 114—123.Xu G. D., Yuan Y., Fang W. H., et al., 2011. Fast loss assessment of M7.1 Yushu earthquake. Journal of Earthquake Engineering and Engineering Vibration, 31(1): 114—123. (in Chinese) [7] 杨海霞, 2015. 建筑物空间分布格网化方法研究. 北京: 中国地震局地震预测研究所.Yang H. X., 2015. Research on gridding method of buildings’ spatial distribution. Beijing: Institute of Earthquake Science, China Earthquake Administration. (in Chinese) [8] 杨海霞, 王晓青, 窦爱霞等, 2015. 基于RS和GIS的建筑物空间分布格网化方法研究. 地震, 35(3): 136—146. doi: 10.3969/j.issn.1000-3274.2015.03.014Yang H. X., Wang X. Q., Dou A. X., et al., 2015. Multi-source and Multi-factor gridding method of building distribution based on RS and GIS. Earthquake, 35(3): 136—146. (in Chinese) doi: 10.3969/j.issn.1000-3274.2015.03.014 [9] 周中红, 陈文凯, 何少林等, 2019. 基于人口公里格网的地震压埋人员分布评估方法的应用与评价——以甘肃岷县漳县6.6级地震为例. 地震研究, 42(2): 288—294. doi: 10.3969/j.issn.1000-0666.2019.02.018Zhou Z. H., Chen W. K., He S. L., et al., 2019. Application and evaluation on a evaluating method for distribution of earthquake buried personnel based on population kilometer grid: taking Minxian-Zhangxian M6.6 earthquake as an example. Journal of Seismological Research, 42(2): 288—294. (in Chinese) doi: 10.3969/j.issn.1000-0666.2019.02.018 [10] Sridharan H., Qiu F., 2013. A spatially disaggregated areal interpolation model using light detection and ranging-derived building volumes. Geographical Analysis, 45(3): 238—258. doi: 10.1111/gean.12010 -


 下载:
下载:

