
Study on In-building Probability of Different Periods and Different Regions in Gansu Province
-
摘要: 本文依据甘肃省区域特点,针对城市和不同农村区域,根据人员活动,采用在室率对人员在室内的情况进行评估研究。采用泊松公式表示家庭人数概率分布,建立城市和不同农村区域不同时段人员在室内的分区概率公式。研究结果表明,对于城市区域,工作日与节假日人员在室率具有明显差别;对于农村区域或牧区,因区域、季节不同,不同时段人员在室率有所不同;总体上甘南牧区每年10月至次年3月人员在室率较高,省内其他农村区域每年11月至次年2月人员在室率较高。Abstract: Based on the regional characteristics of the cities and different rural areas in Gansu and people's activities during the daytime, the index of in-building probability is used to evaluate and research people’s indoor situations. The Poisson formula is used to represent the probability distribution of household population, so as to establish the probability formula of people indoors at different time periods in urban and rural areas. The results show that the probability of people indoors during the day varies significantly depending on whether it’s workday or holiday in urban areas. In rural or pastoral areas, the in-building probability at different times of the day varies as well, due to regional and seasonal differences.In general, in the pastoral areas of southern Gansu, the in-building probability from October to March of the next year is relatively higher than that of other months, while in other rural areas of Gansu the probability from November to February of the next year is higher than that of other months.
-
Key words:
- Gansu region /
- In-building probability /
- Earthquake casualty /
- Rapid assessment
-
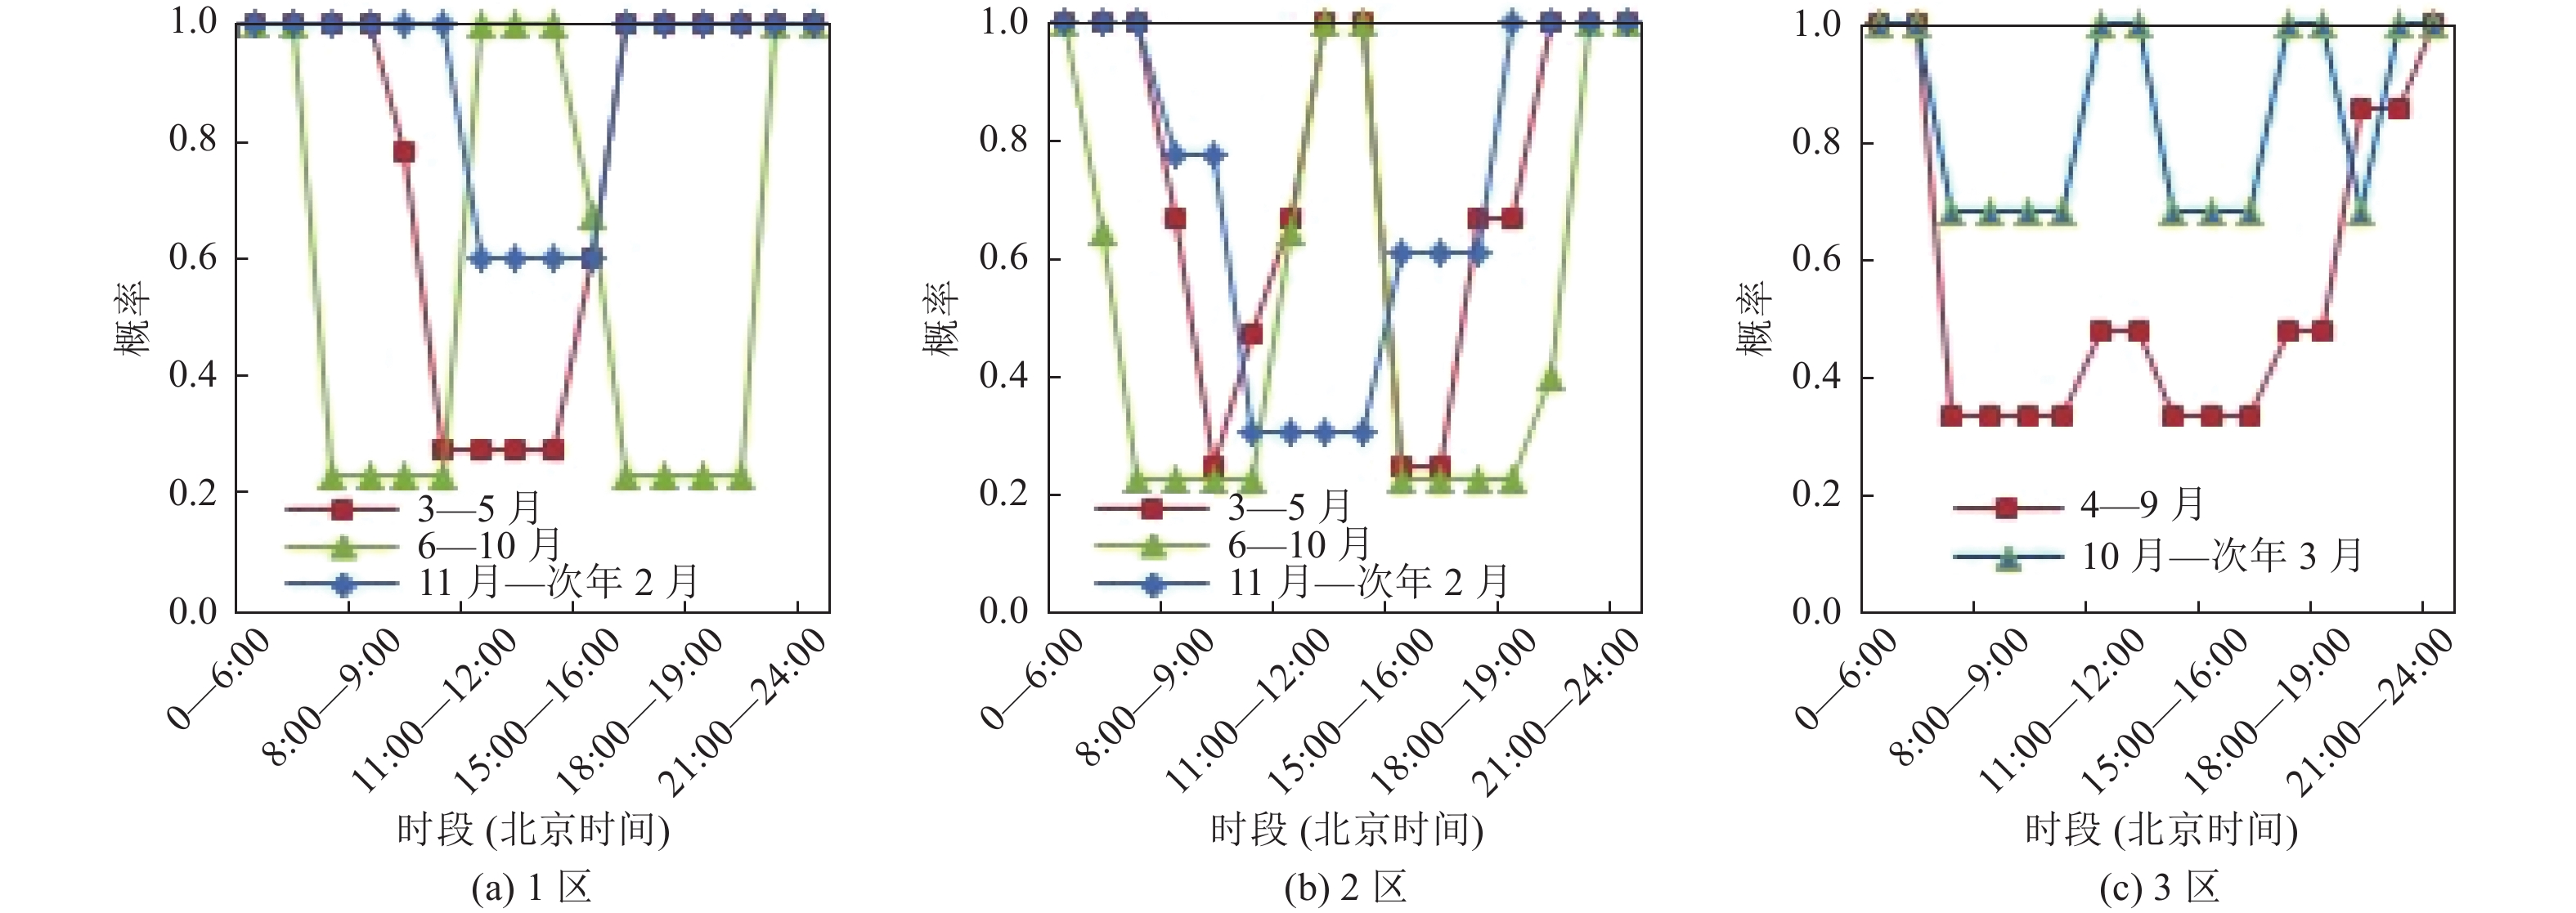
图 2 甘肃省不同农村区域(含牧区)任意时刻人员在室率对比
Figure 2. Comparison of the in-building probability in different rural areas (including pastoral areas) of Gansu province

图 3 甘肃省不同农村区域(含牧区)相同时段人员在室率对比
Figure 3. Comparison of the in-building probability in different rural areas(including pastoral areas) of Gansu province during the same period
表 1 城市有职者/无职者人员在室内情况划分
Table 1. Activity of workers and unemployed during the different periods of a day in urban research area of Gansu province
类别 作息日 时段 0:00—7:00 7:00—8:30 8:30—12:00 12:00—14:30 14:30—18:00 18:00—19:00 19:00
—21:3021:30—24:00 城市有职者 工作日 $ \mathrm{I}\mathrm{N} $ $ \mathrm{I}\mathrm{N}\cup \overline{\mathrm{I}\mathrm{N}} $ $ \mathrm{I}\mathrm{N} $ $ \mathrm{I}\mathrm{N}\cup \overline{\mathrm{I}\mathrm{N}} $ $ \mathrm{I}\mathrm{N} $ $ \mathrm{I}\mathrm{N}\cup \overline{\mathrm{I}\mathrm{N}} $ $ \mathrm{I}\mathrm{N}\cup \overline{\mathrm{I}\mathrm{N}} $ $ \mathrm{I}\mathrm{N} $ 城市无职者 工作日 $ \mathrm{I}\mathrm{N} $ $ \mathrm{I}\mathrm{N}\cup \overline{\mathrm{I}\mathrm{N}} $ $ \mathrm{I}\mathrm{N}\cup \overline{\mathrm{I}\mathrm{N}} $ $ \mathrm{I}\mathrm{N}\cup \overline{\mathrm{I}\mathrm{N}} $ $ \mathrm{I}\mathrm{N}\cup \overline{\mathrm{I}\mathrm{N}} $ $ \mathrm{I}\mathrm{N}\cup \overline{\mathrm{I}\mathrm{N}} $ $ \mathrm{I}\mathrm{N}\cup \overline{\mathrm{I}\mathrm{N}} $ $ \mathrm{I}\mathrm{N} $ 城市有职者 节假日 $ \mathrm{I}\mathrm{N} $ $ \mathrm{I}\mathrm{N}\cup \overline{\mathrm{I}\mathrm{N}} $ $ \mathrm{I}\mathrm{N}\cup \overline{\mathrm{I}\mathrm{N}} $ $ \mathrm{I}\mathrm{N}\cup \overline{\mathrm{I}\mathrm{N}} $ $ \mathrm{I}\mathrm{N}\cup \overline{\mathrm{I}\mathrm{N}} $ $ \mathrm{I}\mathrm{N}\cup \overline{\mathrm{I}\mathrm{N}} $ $ \mathrm{I}\mathrm{N}\cup \overline{\mathrm{I}\mathrm{N}} $ $ \mathrm{I}\mathrm{N} $ 城市无职者 节假日 $ \mathrm{I}\mathrm{N} $ $ \mathrm{I}\mathrm{N}\cup \overline{\mathrm{I}\mathrm{N}} $ $ \mathrm{I}\mathrm{N}\cup \overline{\mathrm{I}\mathrm{N}} $ $ \mathrm{I}\mathrm{N}\cup \overline{\mathrm{I}\mathrm{N}} $ $ \mathrm{I}\mathrm{N}\cup \overline{\mathrm{I}\mathrm{N}} $ $ \mathrm{I}\mathrm{N}\cup \overline{\mathrm{I}\mathrm{N}} $ $ \mathrm{I}\mathrm{N}\cup \overline{\mathrm{I}\mathrm{N}} $ $ \mathrm{I}\mathrm{N} $  下载: 导出CSV
表 2 1区农村劳动者/非劳动者人员在室内情况划分
Table 2. Activity of workers and unemployed during the different periods of a day in the first rural research area of Gansu province
类别 月份 时段 0:00—
6:006:00—
7:007:00—
8:008:00—
9:009:00—
10:0010:00—
11:0011:00—
12:0012:00—
15:0015:00—
16:0016:00—
17:0017:00—
20:0020:00—
24:00农村劳动者 3—5月 $ \mathrm{I}\mathrm{N} $ $ \mathrm{I}\mathrm{N} $ $ \mathrm{I}\mathrm{N} $ $ \mathrm{I}\mathrm{N} $ $ \mathrm{I}\mathrm{N}\cup \overline{\mathrm{I}\mathrm{N}} $ $ \overline{\mathrm{I}\mathrm{N}} $ $ \overline{\mathrm{I}\mathrm{N}} $ $ \overline{\mathrm{I}\mathrm{N}} $ $ \mathrm{I}\mathrm{N}\cup \overline{\mathrm{I}\mathrm{N}} $ $ \mathrm{I}\mathrm{N} $ $ \mathrm{I}\mathrm{N} $ $ \mathrm{I}\mathrm{N} $ 农村非劳动者 3—5月 $ \mathrm{I}\mathrm{N} $ $ \mathrm{I}\mathrm{N} $ $ \mathrm{I}\mathrm{N} $ $ \mathrm{I}\mathrm{N} $ $ \mathrm{I}\mathrm{N} $ $ \mathrm{I}\mathrm{N}\cup \overline{\mathrm{I}\mathrm{N}} $ $ \mathrm{I}\mathrm{N}\cup \overline{\mathrm{I}\mathrm{N}} $ $ \mathrm{I}\mathrm{N}\cup \overline{\mathrm{I}\mathrm{N}} $ $ \mathrm{I}\mathrm{N}\cup \overline{\mathrm{I}\mathrm{N}} $ $ \mathrm{I}\mathrm{N} $ $ \mathrm{I}\mathrm{N} $ $ \mathrm{I}\mathrm{N} $ 农村劳动者 6—10月 $ \mathrm{I}\mathrm{N} $ $ \mathrm{I}\mathrm{N} $ $ \overline{\mathrm{I}\mathrm{N}} $ $ \overline{\mathrm{I}\mathrm{N}} $ $ \overline{\mathrm{I}\mathrm{N}} $ $ \overline{\mathrm{I}\mathrm{N}} $ $ \mathrm{I}\mathrm{N} $ $ \mathrm{I}\mathrm{N} $ $ \mathrm{I}\mathrm{N}\cup \overline{\mathrm{I}\mathrm{N}} $ $ \overline{\mathrm{I}\mathrm{N}} $ $ \overline{\mathrm{I}\mathrm{N}} $ $ \mathrm{I}\mathrm{N} $ 农村非劳动者 6—10月 $ \mathrm{I}\mathrm{N} $ $ \mathrm{I}\mathrm{N} $ $ \mathrm{I}\mathrm{N}\cup \overline{\mathrm{I}\mathrm{N}} $ $ \mathrm{I}\mathrm{N}\cup \overline{\mathrm{I}\mathrm{N}} $ $ \mathrm{I}\mathrm{N}\cup \overline{\mathrm{I}\mathrm{N}} $ $ \mathrm{I}\mathrm{N}\cup \overline{\mathrm{I}\mathrm{N}} $ $ \mathrm{I}\mathrm{N} $ $ \mathrm{I}\mathrm{N} $ $ \mathrm{I}\mathrm{N} $ $ \mathrm{I}\mathrm{N}\cup \overline{\mathrm{I}\mathrm{N}} $ $ \mathrm{I}\mathrm{N}\cup \overline{\mathrm{I}\mathrm{N}} $ $ \mathrm{I}\mathrm{N} $ 农村劳动者 11月—次年2月 $ \mathrm{I}\mathrm{N} $ $ \mathrm{I}\mathrm{N} $ $ \mathrm{I}\mathrm{N} $ $ \mathrm{I}\mathrm{N} $ $ \mathrm{I}\mathrm{N} $ $ \mathrm{I}\mathrm{N} $ $ \mathrm{I}\mathrm{N}\cup \overline{\mathrm{I}\mathrm{N}} $ $ \mathrm{I}\mathrm{N}\cup \overline{\mathrm{I}\mathrm{N}} $ $ \mathrm{I}\mathrm{N}\cup \overline{\mathrm{I}\mathrm{N}} $ $ \mathrm{I}\mathrm{N} $ $ \mathrm{I}\mathrm{N} $ $ \mathrm{I}\mathrm{N} $ 农村非劳动者 11月—次年2月 $ \mathrm{I}\mathrm{N} $ $ \mathrm{I}\mathrm{N} $ $ \mathrm{I}\mathrm{N} $ $ \mathrm{I}\mathrm{N} $ $ \mathrm{I}\mathrm{N} $ $ \mathrm{I}\mathrm{N} $ $ \mathrm{I}\mathrm{N}\cup \overline{\mathrm{I}\mathrm{N}} $ $ \mathrm{I}\mathrm{N}\cup \overline{\mathrm{I}\mathrm{N}} $ $ \mathrm{I}\mathrm{N}\cup \overline{\mathrm{I}\mathrm{N}} $ $ \mathrm{I}\mathrm{N} $ $ \mathrm{I}\mathrm{N} $ $ \mathrm{I}\mathrm{N} $
下载: 导出CSV
表 3 2区农村劳动者/非劳动者人员在室内情况划分
Table 3. Activity of workers and unemployed during the different periods of a day in the second rural research area of Gansu province
类别 月份 时段 0:00—
6:006:00—
7:007:00—
8:008:00—
9:009:00—
10:0010:00—
11:0011:00—
12:0012:00—
15:0015:00—
17:0017:00—
18:0018:00—
19:0019:00—
20:0020:00—
24:00农村劳动者 3—5月 $ \mathrm{I}\mathrm{N} $ $ \mathrm{I}\mathrm{N} $ $ \mathrm{I}\mathrm{N} $ $ \mathrm{I}\mathrm{N}\cup \overline{\mathrm{I}\mathrm{N}} $ $ \overline{\mathrm{I}\mathrm{N}} $ $ \overline{\mathrm{I}\mathrm{N}} $ $ \mathrm{I}\mathrm{N}\cup \overline{\mathrm{I}\mathrm{N}} $ $ \mathrm{I}\mathrm{N} $ $ \overline{\mathrm{I}\mathrm{N}} $ $ \mathrm{I}\mathrm{N}\cup \overline{\mathrm{I}\mathrm{N}} $ $ \mathrm{I}\mathrm{N}\cup \overline{\mathrm{I}\mathrm{N}} $ $ \mathrm{I}\mathrm{N} $ $ \mathrm{I}\mathrm{N} $ 农村非劳动者 3—5月 $ \mathrm{I}\mathrm{N} $ $ \mathrm{I}\mathrm{N} $ $ \mathrm{I}\mathrm{N} $ $ \mathrm{I}\mathrm{N} $ $ \mathrm{I}\mathrm{N}\cup \overline{\mathrm{I}\mathrm{N}} $ $ \mathrm{I}\mathrm{N} $ $ \mathrm{I}\mathrm{N} $ $ \mathrm{I}\mathrm{N} $ $ \mathrm{I}\mathrm{N}\cup \overline{\mathrm{I}\mathrm{N}} $ $ \mathrm{I}\mathrm{N} $ $ \mathrm{I}\mathrm{N} $ $ \mathrm{I}\mathrm{N} $ $ \mathrm{I}\mathrm{N} $ 农村劳动者 6—10月 IN $ \mathrm{I}\mathrm{N}\cup \overline{\mathrm{I}\mathrm{N}} $ $ \overline{\mathrm{I}\mathrm{N}} $ $ \overline{\mathrm{I}\mathrm{N}} $ $ \overline{\mathrm{I}\mathrm{N}} $ $ \overline{\mathrm{I}\mathrm{N}} $ $ \mathrm{I}\mathrm{N}\cup \overline{\mathrm{I}\mathrm{N}} $ $ \mathrm{I}\mathrm{N} $ $ \overline{\mathrm{I}\mathrm{N}} $ $ \overline{\mathrm{I}\mathrm{N}} $ $ \overline{\mathrm{I}\mathrm{N}} $ $ \mathrm{I}\mathrm{N}\cup \overline{\mathrm{I}\mathrm{N}} $ $ \mathrm{I}\mathrm{N} $ 农村非劳动者 6—10月 $ \mathrm{I}\mathrm{N} $ $ \mathrm{I}\mathrm{N} $ $ \mathrm{I}\mathrm{N}\cup \overline{\mathrm{I}\mathrm{N}} $ $ \mathrm{I}\mathrm{N}\cup \overline{\mathrm{I}\mathrm{N}} $ $ \mathrm{I}\mathrm{N}\cup \overline{\mathrm{I}\mathrm{N}} $ $ \mathrm{I}\mathrm{N}\cup \overline{\mathrm{I}\mathrm{N}} $ $ \mathrm{I}\mathrm{N} $ $ \mathrm{I}\mathrm{N} $ $ \mathrm{I}\mathrm{N}\cup \overline{\mathrm{I}\mathrm{N}} $ $ \mathrm{I}\mathrm{N}\cup \overline{\mathrm{I}\mathrm{N}} $ $ \mathrm{I}\mathrm{N}\cup \overline{\mathrm{I}\mathrm{N}} $ $ \mathrm{I}\mathrm{N}\cup \overline{\mathrm{I}\mathrm{N}} $ $ \mathrm{I}\mathrm{N} $ 农村劳动者 11月—次年2月 $ \mathrm{I}\mathrm{N} $ $ \mathrm{I}\mathrm{N} $ $ \mathrm{I}\mathrm{N} $ $ \mathrm{I}\mathrm{N}\cup \overline{\mathrm{I}\mathrm{N}} $ $ \mathrm{I}\mathrm{N}\cup \overline{\mathrm{I}\mathrm{N}} $ $ \overline{\mathrm{I}\mathrm{N}} $ $ \overline{\mathrm{I}\mathrm{N}} $ $ \overline{\mathrm{I}\mathrm{N}} $ $ \mathrm{I}\mathrm{N}\cup \overline{\mathrm{I}\mathrm{N}} $ $ \mathrm{I}\mathrm{N}\cup \overline{\mathrm{I}\mathrm{N}} $ $ \mathrm{I}\mathrm{N} $ $ \mathrm{I}\mathrm{N} $ $ \mathrm{I}\mathrm{N} $ 农村非劳动者 11月—次年2月 $ \mathrm{I}\mathrm{N} $ $ \mathrm{I}\mathrm{N} $ $ \mathrm{I}\mathrm{N} $ $ \mathrm{I}\mathrm{N} $ $ \mathrm{I}\mathrm{N} $ $ \mathrm{I}\mathrm{N}\cup \overline{\mathrm{I}\mathrm{N}} $ $ \mathrm{I}\mathrm{N}\cup \overline{\mathrm{I}\mathrm{N}} $ $ \mathrm{I}\mathrm{N}\cup \overline{\mathrm{I}\mathrm{N}} $ $ \mathrm{I}\mathrm{N}\cup \overline{\mathrm{I}\mathrm{N}} $ $ \mathrm{I}\mathrm{N}\cup \overline{\mathrm{I}\mathrm{N}} $ $ \mathrm{I}\mathrm{N} $ $ \mathrm{I}\mathrm{N} $ $ \mathrm{I}\mathrm{N} $
下载: 导出CSV
表 4 3区农村劳动者、非劳动者人员在室内情况划分
Table 4. Activity of workers and unemployed during the different periods of a day in the third rural research area of Gansu province
类别 月份 时段 0:00—
6:006:00—
7:007:00—
8:008:00—
9:009:00—
10:0010:00—
11:0011:00—
12:0012:00—
14:0014:00—
17:0017:00—
19:0019:00—
20:0020:00—
21:0021:00—
24:00农村劳动者 4—9月 $ \mathrm{I}\mathrm{N} $ $ \mathrm{I}\mathrm{N} $ $ \overline{\mathrm{I}\mathrm{N}} $ $ \overline{\mathrm{I}\mathrm{N}} $ $ \overline{\mathrm{I}\mathrm{N}} $ $ \overline{\mathrm{I}\mathrm{N}} $ $ \overline{\mathrm{I}\mathrm{N}} $ $ \overline{\mathrm{I}\mathrm{N}} $ $ \overline{\mathrm{I}\mathrm{N}} $ $ \overline{\mathrm{I}\mathrm{N}} $ $ \mathrm{I}\mathrm{N} $ $ \mathrm{I}\mathrm{N} $ $ \mathrm{I}\mathrm{N} $ 农村非劳动者 4—9月 $ \mathrm{I}\mathrm{N} $ $ \mathrm{I}\mathrm{N} $ $ \mathrm{I}\mathrm{N}\cup \overline{\mathrm{I}\mathrm{N}} $ $ \mathrm{I}\mathrm{N}\cup \overline{\mathrm{I}\mathrm{N}} $ $ \mathrm{I}\mathrm{N}\cup \overline{\mathrm{I}\mathrm{N}} $ $ \mathrm{I}\mathrm{N}\cup \overline{\mathrm{I}\mathrm{N}} $ $ \mathrm{I}\mathrm{N} $ $ \mathrm{I}\mathrm{N} $ $ \mathrm{I}\mathrm{N}\cup \overline{\mathrm{I}\mathrm{N}} $ $ \mathrm{I}\mathrm{N} $ $ \mathrm{I}\mathrm{N}\cup \overline{\mathrm{I}\mathrm{N}} $ $ \mathrm{I}\mathrm{N}\cup \overline{\mathrm{I}\mathrm{N}} $ $ \mathrm{I}\mathrm{N} $ 农村劳动者 10月—次年3月 $ \mathrm{I}\mathrm{N} $ $ \mathrm{I}\mathrm{N} $ $ \mathrm{I}\mathrm{N}\cup \overline{\mathrm{I}\mathrm{N}} $ $ \mathrm{I}\mathrm{N}\cup \overline{\mathrm{I}\mathrm{N}} $ $ \mathrm{I}\mathrm{N}\cup \overline{\mathrm{I}\mathrm{N}} $ $ \mathrm{I}\mathrm{N}\cup \overline{\mathrm{I}\mathrm{N}} $ $ \mathrm{I}\mathrm{N} $ $ \mathrm{I}\mathrm{N} $ $ \mathrm{I}\mathrm{N}\cup \overline{\mathrm{I}\mathrm{N}} $ $ \mathrm{I}\mathrm{N} $ $ \mathrm{I}\mathrm{N}\cup \overline{\mathrm{I}\mathrm{N}} $ $ \mathrm{I}\mathrm{N} $ $ \mathrm{I}\mathrm{N} $ 农村非劳动者 10月—次年3月 $ \mathrm{I}\mathrm{N} $ $ \mathrm{I}\mathrm{N} $ $ \mathrm{I}\mathrm{N}\cup \overline{\mathrm{I}\mathrm{N}} $ $ \mathrm{I}\mathrm{N}\cup \overline{\mathrm{I}\mathrm{N}} $ $ \mathrm{I}\mathrm{N}\cup \overline{\mathrm{I}\mathrm{N}} $ $ \mathrm{I}\mathrm{N}\cup \overline{\mathrm{I}\mathrm{N}} $ $ \mathrm{I}\mathrm{N} $ $ \mathrm{I}\mathrm{N} $ $ \mathrm{I}\mathrm{N}\cup \overline{\mathrm{I}\mathrm{N}} $ $ \mathrm{I}\mathrm{N} $ $ \mathrm{I}\mathrm{N}\cup \overline{\mathrm{I}\mathrm{N}} $ $ \mathrm{I}\mathrm{N} $ $ \mathrm{I}\mathrm{N} $
下载: 导出CSV
表 5
$ \mathrm{I}\mathrm{N}\cup \overline{\mathrm{I}\mathrm{N}} $ 时段内人员在室率Table 5. In-building probability during the
$ \mathbf{I}\mathbf{N}\cup \overline{\mathbf{I}\mathbf{N}} $ periods作息日/月份 区域 城市有职者 城市无职者 农村劳动者 农村非劳动者 工作日 1区 T1/7.5 T2/14.5 — — 节假日 1区 T2/14.5 T2/14.5 — — 3—5月 1区 — — T135/2 T136/6 6—10月 1区 — — — T166/8 11月—次年2月 1区 — — T1115/5 T1116/5 工作日 2区 T1/7.5 T2/14.5 — — 节假日 2区 T2/14.5 T2/14.5 — — 3—5月 2区 — — T235/4 T236/3 6—10月 2区 — — T265/3 T266/9 11月—次年2月 2区 — — T2115/5 T2116/8 工作日 3区 T1/7.5 T2/14.5 — — 节假日 3区 T2/14.5 T2/14.5 — — 4—9月 3区 — — — T346/9 10月—次年3月 3区 — — — T3106/9
下载: 导出CSV
表 6 甘肃省n个家庭成员的家庭中有职劳动者的概率
Table 6. The probability of workers in a family with multiple members in Gansu province
地区 P(1) P(2) P(3) P(4) P(5) P(6) P(7) 城市 0.900 0.860 0.801 0.753 0.701 0.517 — 农村 0.400 0.592 0.684 0.541 0.528 0.508 0.490
下载: 导出CSV
表 7 甘肃省家庭人数的概率分布
Table 7. The probability of family population in Gansu province
地区 F(1) F (2) F (3) F (4) F (5) F (6) F (7) 城市 0.157 24 0.290 89 0.269 07 0.165 93 0.076 74 0.028 39 0 农村 0.022 60 0.085 64 0.162 28 0.205 02 0.194 25 0.147 24 0.093 01
下载: 导出CSV
表 8 甘肃省城市区域任意时刻人员在室率
Table 8. The in-building probability of urban area in Gansu province
作息日 时段 0:00—7:00 7:00—8:30 8:30—12:00 12:00—14:30 14:30—18:00 18:00—19:00 19:00—21:30 21:30—24:00 工作日 1.000 0.553 0.915 0.657 0.915 0.553 0.657 1.000 节假日 1.000 0.621 0.621 0.621 0.621 0.621 0.621 1.000
下载: 导出CSV
表 9 甘肃省农村区域任意时刻人员在室率
Table 9. The in-building probability of rural area in Gansu province
月份 区域 时段 0:00—
6:006:00—
7:007:00—
8:008:00—
9:009:00—
10:0010:00—
11:0011:00—
12:0012:00—
14:0014:00—
15:0015:00—
16:0016:00—
17:0017:00—
18:0018:00—
19:0019:00—
20:0020:00—
21:0021:00—
24:003—5月 1区 1.000 1.000 1.000 1.000 0.784 0.275 0.275 0.275 0.275 0.600 1.000 1.000 1.000 1.000 1.000 1.000 6—10月 1区 1.000 1.000 0.230 0.230 0.230 0.230 1.000 1.000 1.000 0.680 0.230 0.230 0.230 0.230 1.000 1.000 11月—次年2月 1区 1.000 1.000 1.000 1.000 1.000 1.000 0.600 0.600 0.600 0.600 1.000 1.000 1.000 1.000 1.000 1.000 3—5月 2区 1.000 1.000 1.000 0.662 0.230 0.459 0.662 1.000 1.000 0.230 0.230 0.662 0.662 1.000 1.000 1.000 6—10月 2区 1.000 0.639 0.204 0.204 0.204 0.204 0.639 1.000 1.000 0.204 0.204 0.204 0.204 0.384 1.000 1.000 11月—次年2月 2区 1.000 1.000 1.000 0.775 0.775 0.287 0.287 0.287 0.287 0.602 0.602 0.602 1.000 1.000 1.000 1.000 4—9月 3区 1.000 1.000 0.306 0.306 0.306 0.306 0.459 0.459 0.306 0.306 0.306 0.459 0.459 0.847 0.847 1.000 10月—次年3月 3区 1.000 1.000 0.667 0.667 0.667 0.667 1.000 1.000 0.667 0.667 0.667 1.000 1.000 0.667 1.000 1.000
下载: 导出CSV
-
[1] 白仙富, 戴雨芡, 叶燎原等, 2018. 基于高精度房屋、人口数据的地震压埋人员和紧急搜救区评估模型研究. 防灾减灾学报, 34(4): 1—12.Bai X. F., Dai Y. Q., Ye L. Y., et al., 2018. Assessment models of trapped-victim in earthquake & emergency rescue area based on high-precision building and population data. Journal of Disaster Prevention and Reduction, 34(4): 1—12. (in Chinese) [2] 陈洪富, 戴君武, 孙柏涛等, 2011. 玉树7.1级地震人员伤亡影响因素调查与初步分析. 地震工程与工程振动, 31(4): 18—25.Chen H. F., Dai J. W., Sun B. T., et al., 2011. Investigation report on influence factors of casualties in April 14, 2010 Yushu earthquake. Journal of Earthquake Engineering and Engineering Vibration, 31(4): 18—25. (in Chinese) [3] 程家喻, 1993. 地震发生时间对人员伤亡影响的概率. 灾害学, 8(2): 13—16.Cheng J. Y., 1993. Probability of the original time of earthquake affecting the casualty. Journal of Catastrophology, 8(2): 13—16. (in Chinese) [4] 甘本根, 1999. 中国作息时间参考区的初步研究. 抚州师专学报, 62(3): 81—83, 90.Gan B. G., 1999. An initial classification research of work and rest time zone in China. Journal of Fuzhou Teachers College, 62(3): 81—83, 90. (in Chinese) [5] 高永久, 邓艾, 2007. 藏族游牧民定居与新牧区建设——甘南藏族自治州调查报告. 民族研究, (5): 28—37. doi: 10.3969/j.issn.0256-1891.2007.05.003Gao Y. J., Deng A., 2007. Tibetan nomads’ sedentary living and the construction of new pastoral areas: with two communities of Gannan Tibetan Prefecture as the cases. Ethno-National Studies, (5): 28—37. (in Chinese) doi: 10.3969/j.issn.0256-1891.2007.05.003 [6] 格桑达吉, 1993. 甘南藏族自治州农牧区调查研究报告. 中国藏学, (3): 52—63. [7] 郭红梅, 张莹, 陈维锋等, 2017. 多因素控制的城镇地震灾害应急处置模型研究. 震灾防御技术, 12(4): 882—892. doi: 10.11899/zzfy20170416Guo H. M., Zhang Y., Chen W. F., et al., 2017. Research of urban earthquake disaster emergency handling model by multi-factor control. Technology for Earthquake Disaster Prevention, 12(4): 882—892. (in Chinese) doi: 10.11899/zzfy20170416 [8] 刘旭辉, 2001. 关于庆阳地区生态农业建设的思考. 甘肃农业科技, (4): 3—5. doi: 10.3969/j.issn.1001-1463.2001.04.001Liu X. H., 2001. Thoughts on ecological agriculture construction in Qingyang prefecture. Gansu Agricultural Science and Technology, (4): 3—5. (in Chinese) doi: 10.3969/j.issn.1001-1463.2001.04.001 [9] 王晓冬, 2012. 甘肃庆阳地区气候变化影响分析. 辽宁工程技术大学学报(自然科学版), 31(4): 512—515. doi: 10.3969/j.issn.1008-0562.2012.04.018Wang X. D., 2012. Climate Chang in Gansu-Qingyang area and its impact analysis. Journal of Liaoning Technical University (Natural Science), 31(4): 512—515. (in Chinese) doi: 10.3969/j.issn.1008-0562.2012.04.018 [10] 魏本勇, 聂高众, 苏桂武等, 2017. 地震灾害埋压人员评估的研究进展. 灾害学, 32(1): 155—159. doi: 10.3969/j.issn.1000-811X.2017.01.027Wei B. Y., Nie G. Z., Su G. W., et al., 2017. Advances on the assessment methods of buried personnel distribution in earthquake disaster. Journal of Catastrophology, 32(1): 155—159. (in Chinese) doi: 10.3969/j.issn.1000-811X.2017.01.027 [11] 肖东升, 黄丁发, 王旭等, 2009. 在室率先验区划在地震压埋率的应用研究. 地震研究, 32(4): 395—401. doi: 10.3969/j.issn.1000-0666.2009.04.012Xiao D. S., Huang D. F., Wang X., et al., 2009. Chinese Prior-regionalization of in-building ratio in earthquake. Journal of Seismological Research, 32(4): 395—401. (in Chinese) doi: 10.3969/j.issn.1000-0666.2009.04.012 [12] 肖东升, 常鸣, 苏勇等, 2016. 基于时空菱形的人员在室率评估方法. 世界地震工程, 32(1): 43—49.Xiao D. S., Chang M., Su Y., et al., 2016. Indoor rate evaluation method of personnel based on time-space prism. World Earthquake Engineering, 32(1): 43—49. (in Chinese) [13] 张莹, 郭红梅, 陈维锋等, 2017. 城镇地震应急快速评估系统研究. 震灾防御技术, 12(4): 902—913. doi: 10.11899/zzfy20170418Zhang Y., Guo H. M., Chen W. F., et al., 2017. Research of urban earthquake emergency rapid assessment system. Technology for Earthquake Disaster Prevention, 12(4): 902—913. (in Chinese) doi: 10.11899/zzfy20170418 [14] 赵雪雁, 刘霜, 李巍, 2010. 基于人粮关系的土地资源承载力研究——以甘南藏族自治州为例. 西北师范大学学报(自然科学版), 46(6): 100—103.Zhao X. Y., Liu S., Li W., 2010. The land carrying capacity based on man-grain relationship——A case study of Gannan Tibetan Autonomous Prefecture. Journal of Northwest Normal University (Natural Science), 46(6): 100—103. (in Chinese) [15] 赵雪雁, 毛笑文, 2013. 汉、藏、回族地区农户的环境影响——以甘肃省张掖市、甘南藏族自治州、临夏回族自治州为例. 生态学报, 33(17): 5397—5406. doi: 10.5846/stxb201206050813Zhao X. Y., Mao X. W., 2013. Comparison environmental impact of the peasant household in Han, Zang and Hui nationality region: case of Zhangye, Gannan and Linxia in Gansu Province. Acta Ecologica Sinica, 33(17): 5397—5406. (in Chinese) doi: 10.5846/stxb201206050813 [16] 郑山锁, 张睿明, 陈飞等, 2019. 地震人员伤亡评估理论及应用研究. 世界地震工程, 35(1): 87—96.Zheng S. S., Zhang R. M., Chen F., et al. 2019. Research on theory and application of earthquake casualty estimates. World Earthquake Engineering, 35(1): 87—96. (in Chinese) -


 点击查看大图

计量
- 文章访问数: 176
- HTML全文浏览量: 81
- PDF下载量: 8
- 被引次数: 0
