A Preliminary Study on the Attenuation Characteristics of High Frequency Ground Motionin the Western Margin of Ordos
-
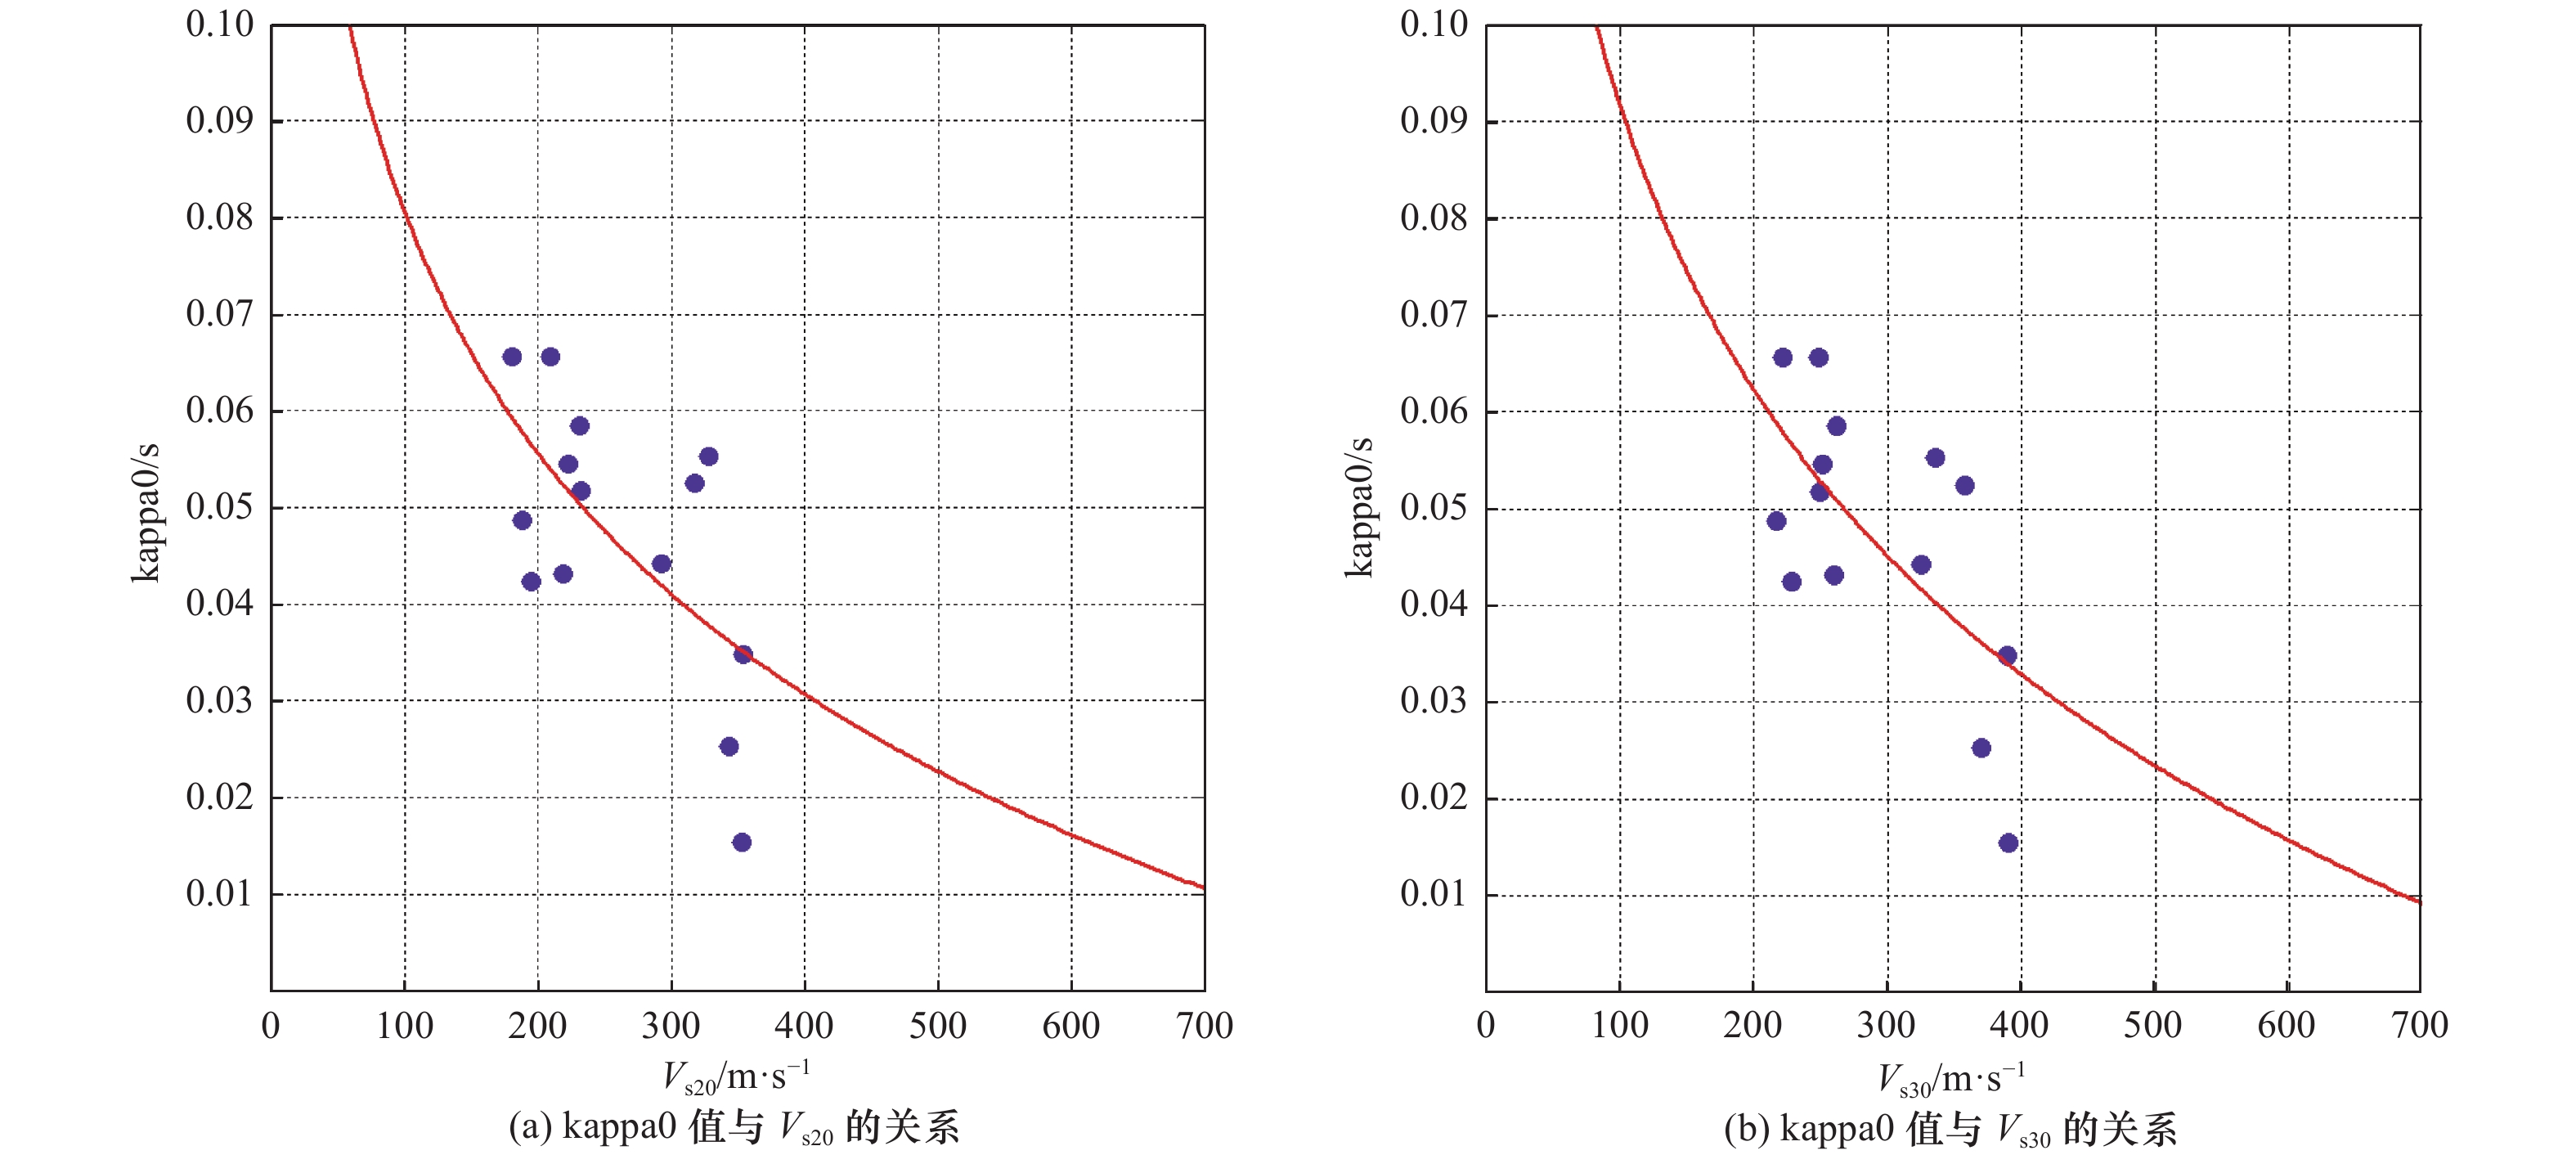
摘要: 以鄂尔多斯西缘地区(34°N—42°N,103°E—109°E)为研究对象,基于2007—2020年研究区域内14个强震动台站记录到的116条强震记录(1≤MS≤8),采用加速度反应谱法,通过MATLAB软件编程拟合鄂尔多斯西缘地区kappa值与震中距的线性回归关系。研究结果表明,鄂尔多斯西缘地区强震台站高频衰减参数kappa0值为0.01545~0.06560 s;等效剪切波速(VS20、VS30)与震中距存在对数关系;随着VS20、VS30的增大,kappa0值逐渐减至0。Abstract: The western margin of Ordos (N: 34°—42°; E: 103 °—109 °) as the research object, using 2007 to 2020, the research area of 14 strong motion stations recorded of the 116 strong earthquake events data(2≤MS≤8), using Anderson and Hough the classic algorithm, using MATLAB software programming to calculate the ordos west region, the linear relationship between the kappa value and the epicenter distance to calculate the ordos kappa0 earthquake stations in the western margin high frequency attenuation parameter value is between 0.01545 s to 0.06560 s. There is a logarithmic relationship between equivalent shear wave velocities (VS20, VS30) and epicenter distance.With the increase of VS20 and VS30, the kappa0 value gradually decreases to 0.
-
Key words:
- Western margin of Erdos region /
- Ground motion /
- High Frequency attenuation /
- Kappa /
- Epicentraldistance
-
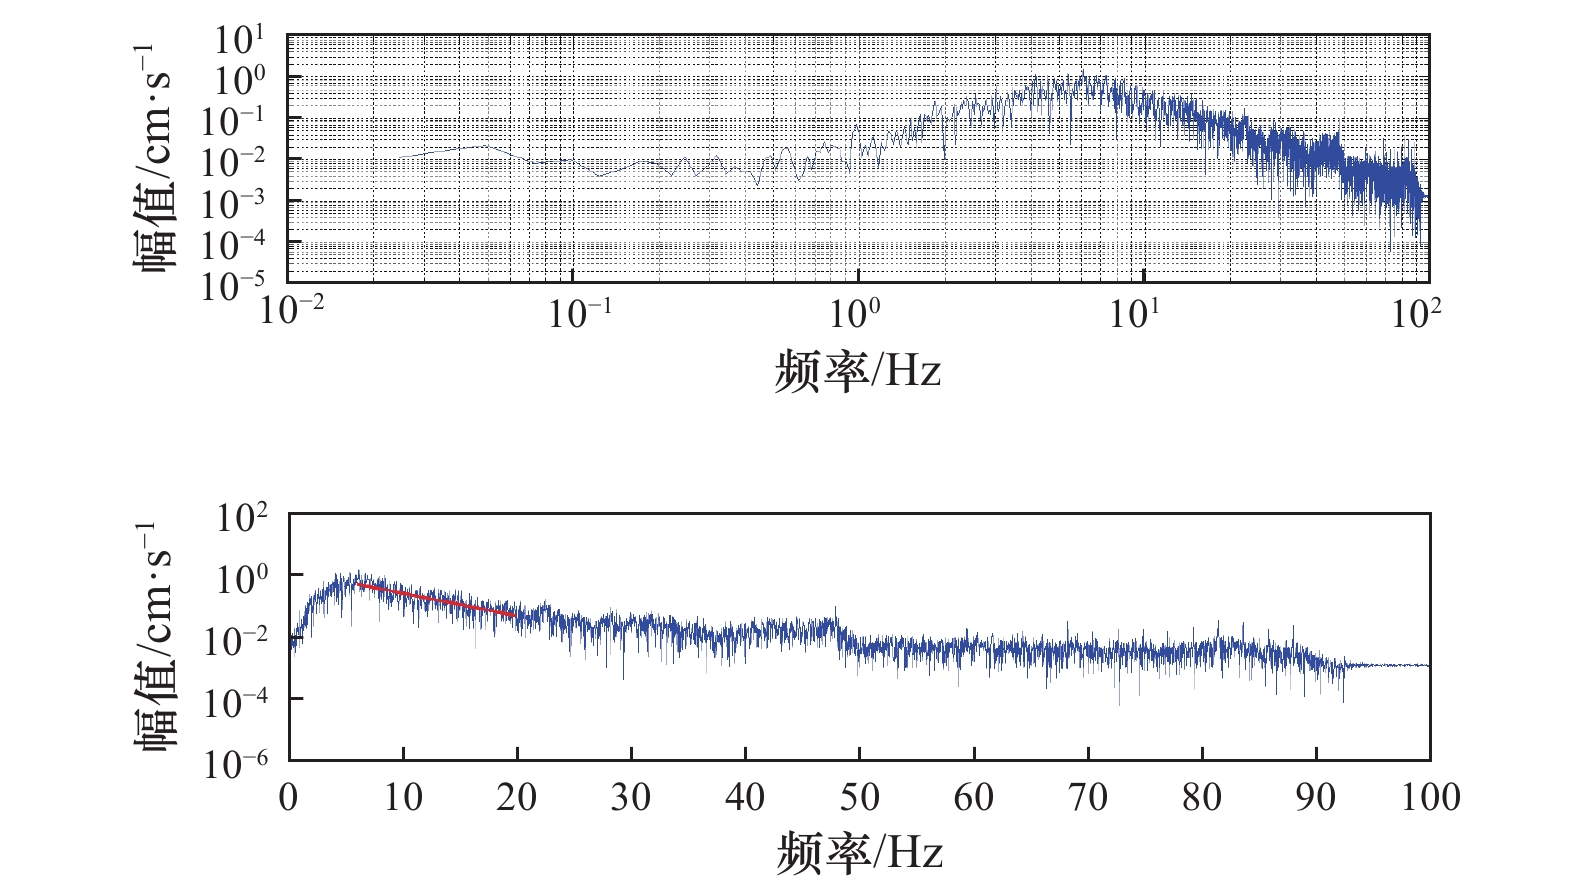
图 2 Anderson等(1984)经典计算方法计算的kappa值
Figure 2. Anderson&Hough's the classical method calculates k
表 1 研究区域地震台站信息
Table 1. The research area seismic station information
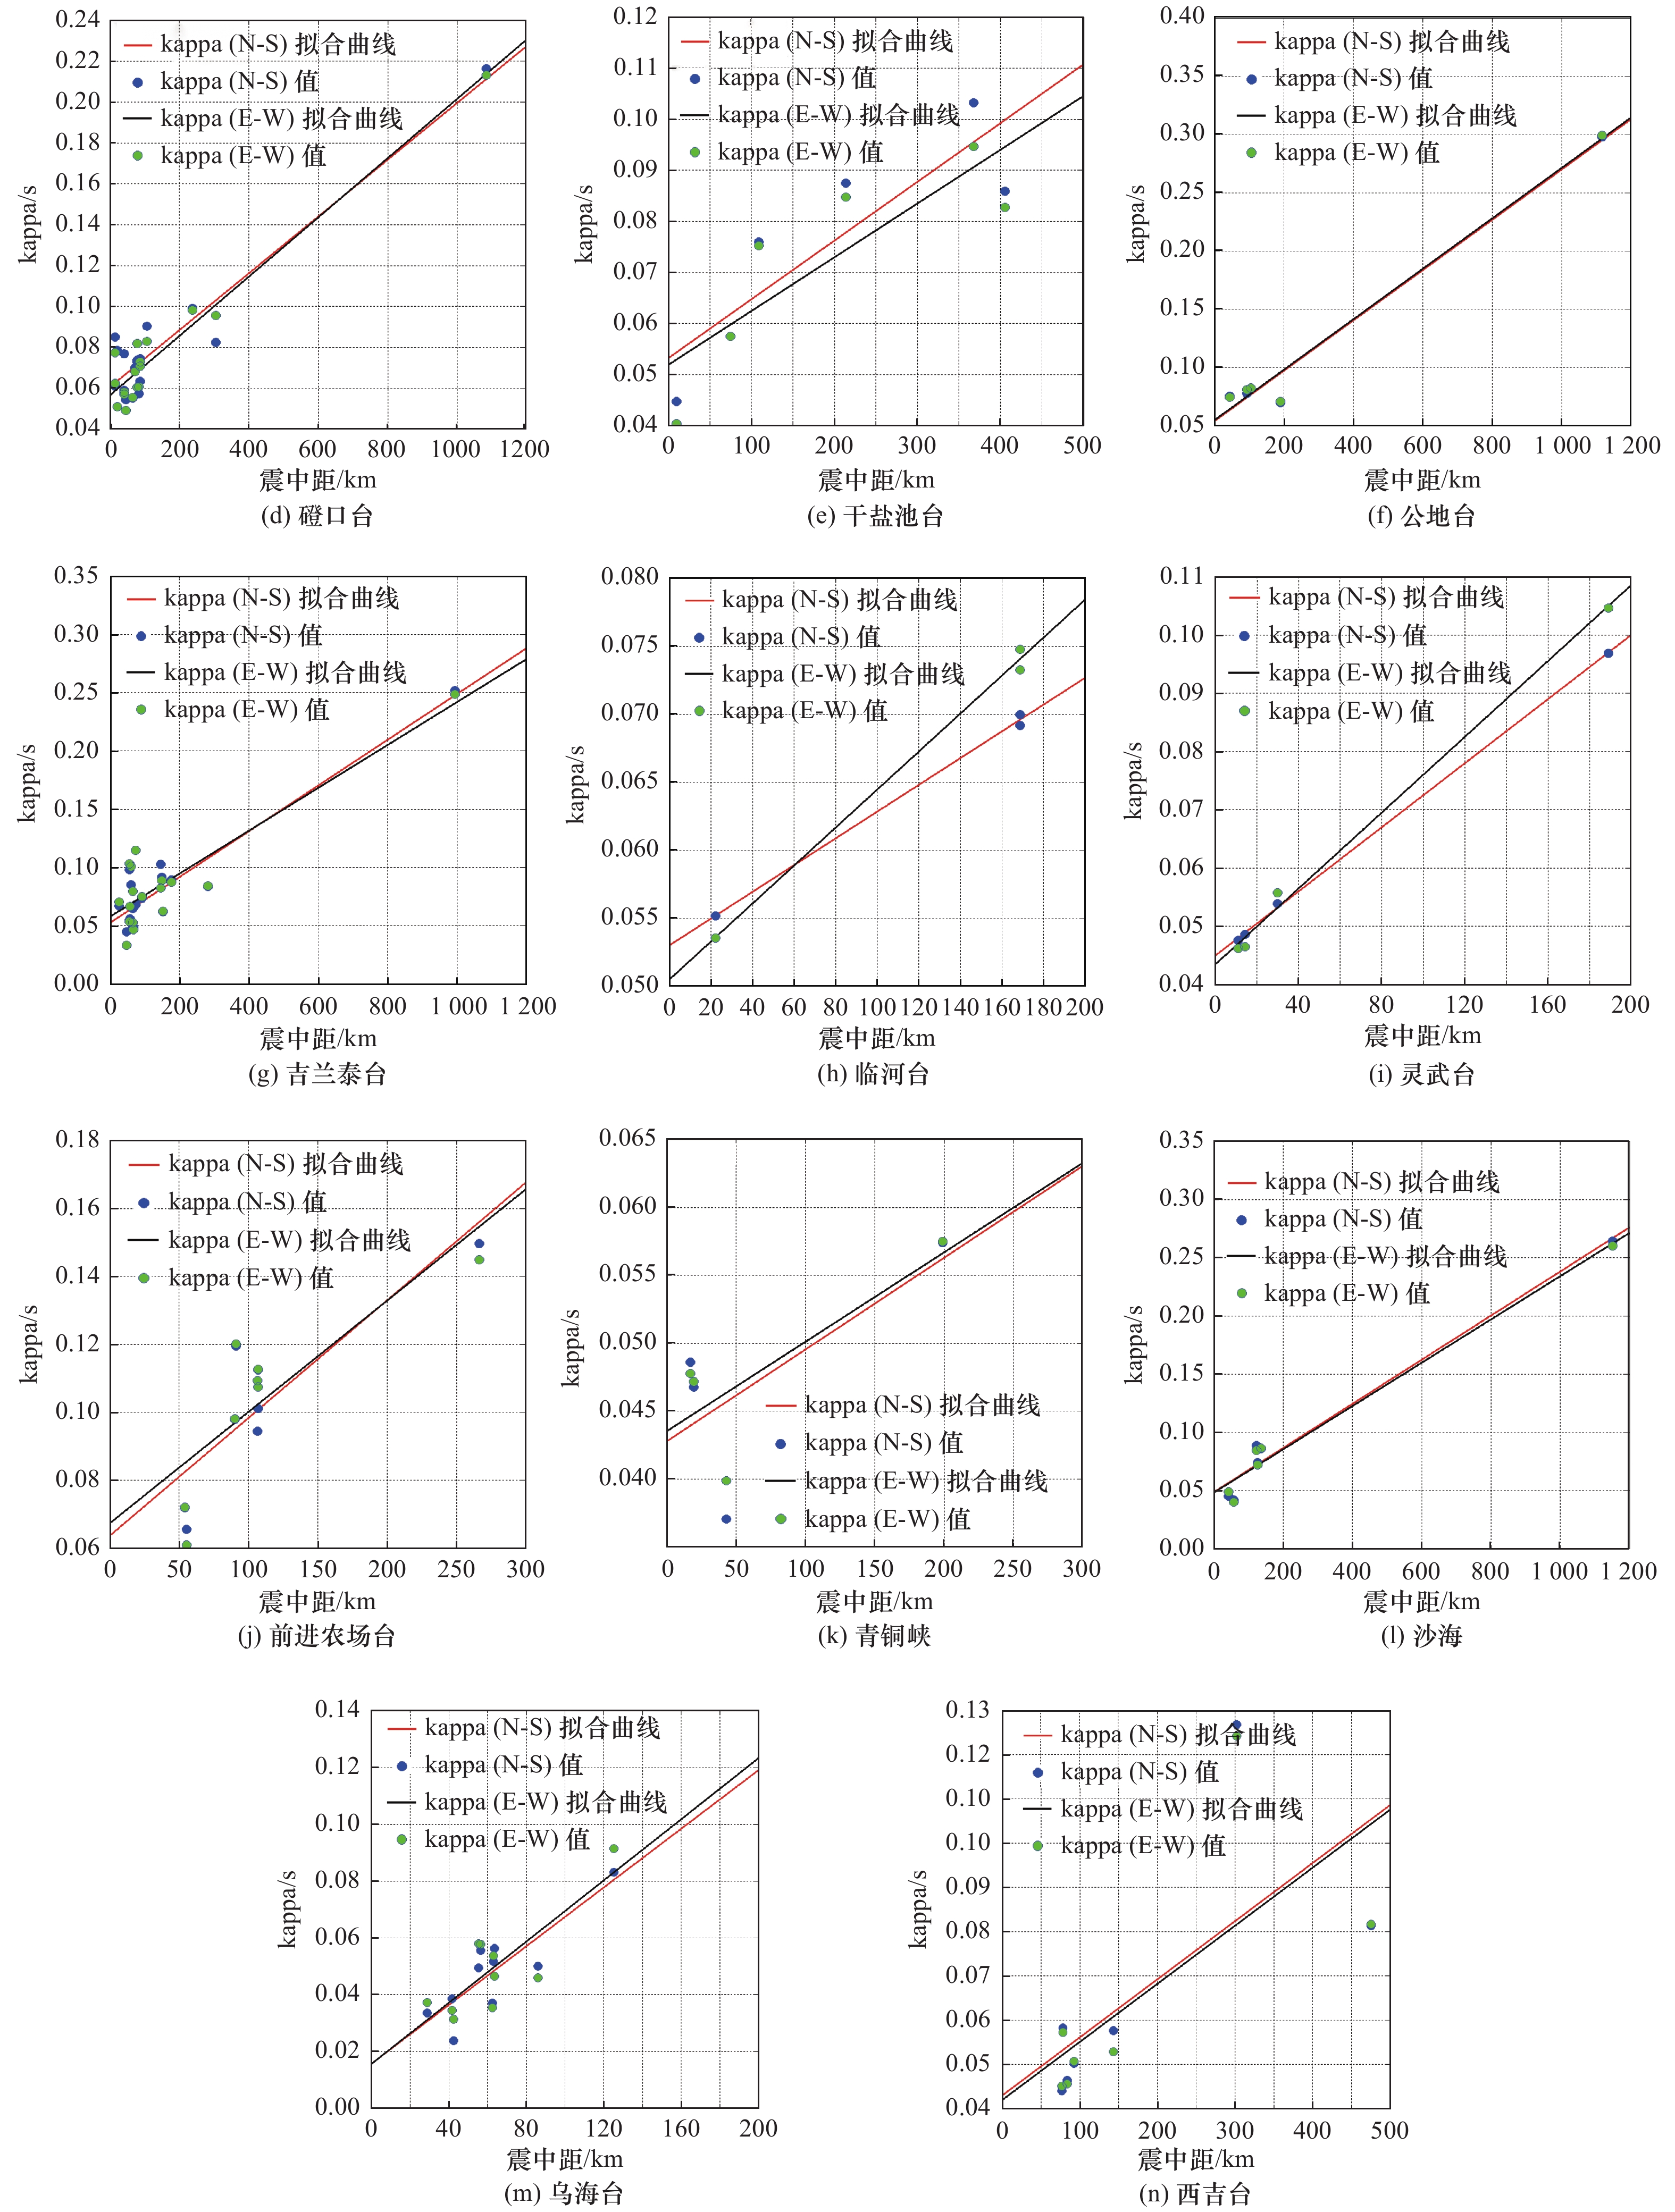
序号 台站名称 经度 纬度 记录器型号 场地类型 1 巴彦浩特 105.7°E 38.8°N ETNA 土层 2 巴彦木仁 106.7°E 39.9°N ETNA 土层 3 宝丰 106.3°E 39.0°N MR-2002 土层 4 磴口 106.9°E 40.3°N ETNA 土层 5 干盐池 105.3°E 36.6°N MR-2002 土层 6 公地 106.8°E 40.6°N ETNA 土层 7 吉兰泰 105.7°E 39.7°N ETNA 土层 8 临河 107.6°E 40.8°N ETNA 土层 9 灵武 106.3°E 38.1°N MR-2002 土层 10 前进农场 106.4°E 38.8°N MR-2002 土层 11 青铜峡 106.0°E 38.0°N MR-2002 基岩 12 沙海 106.9°E 40.9°N ETNA 土层 13 乌海 106.8°E 39.4°N ETNA 土层 14 西吉 105.4°E 35.5°N MR-2002 土层 表 2 kappa值与震中距拟合结果
Table 2. The relationship between kappa and epicentral distance
台站名称 方向 回归方程 K0/s 拟合优度值/R2 $ {{\bar{{K}}}_{\rm{0}}}$/s VS20/m·s−1 VS30/m·s−1 巴彦浩特 N-S kappa=0.000 3R+0.0264 0.0264 0.9803 0.02530 343.05 370.2 E-W kappa=0.000 3R+0.0242 0.0242 0.9854 巴彦木仁 N-S kappa=0.000 2R+0.0363 0.0363 0.8691 0.03485 353.4 389.4 E-W kappa=0.000 2R+0.0334 0.0334 0.9280 宝丰 N-S kappa=0.000 1R+0.0687 0.0687 0.6055 0.06560 180.4 222.1 E-W kappa=0.000 1R+0.0625 0.0625 0.7876 磴口 N-S kappa=0.000 1R+0.0605 0.0605 0.8971 0.05845 231.7 261.7 E-W kappa=0.000 1R+0.0564 0.0564 0.9425 干盐池 N-S kappa=0.000 1R+0.0531 0.0531 0.7542 0.05245 317.4 357.3 E-W kappa=0.000 1R+0.0518 0.0518 0.7194 公地 N-S kappa=0.000 2R+0.0541 0.0541 0.9790 0.05450 222.7 251.2 E-W kappa=0.000 2R+0.0549 0.0549 0.9730 吉兰泰 N-S kappa=0.000 2R+0.0526 0.0526 0.8812 0.05525 327.7 335.8 E-W kappa=0.000 2R+0.0579 0.0579 0.7826 临河 N-S kappa=0.000 1R+0.0530 0.0530 0.9977 0.05175 232.3 249.7 E-W kappa=0.000 1R+0.0505 0.0505 0.9960 灵武 N-S kappa=0.000 3R+0.0449 0.0449 0.9996 0.04415 292.6 325.1 E-W kappa=0.000 3R+0.0434 0.0434 0.9957 前进农场 N-S kappa=0.000 3R+0.0637 0.0637 0.7536 0.06555 209.5 248.9 E-W kappa=0.000 3R+0.0674 0.0674 0.6815 青铜峡 N-S kappa=0.000 1R+0.0428 0.0428 0.4987 0.04315 219.0 260.0 E-W kappa=0.000 1R+0.0435 0.0435 0.6287 沙海 N-S kappa=0.000 2R+0.0489 0.0489 0.9743 0.04870 188.3 216.5 E-W kappa=0.000 2R+0.0485 0.0485 0.9710 乌海 N-S kappa=0.000 5R+0.0155 0.0155 0.7320 0.01545 352.7 390.5 E-W kappa=0.000 5R+0.0154 0.0154 0.6702 西吉 N-S kappa=0.000 1R+0.0429 0.0429 0.4713 0.04240 195.1 228.7 E-W kappa=0.000 1R+0.0419 0.0419 0.4909 表 3 巴彦木仁、磴口台站kappa值与震中距拟合结果
Table 3. Fitting results of kappa value and epicenter distance at Bayanmuren and Dengkou station
台站名称 方向 回归方程 K0/s 拟合优度值/R2 巴彦木仁 N-S kappa=0.000 3R+0.0275 0.0275 0.6186 E-W kappa=0.000 3R+0.0266 0.0266 0.7081 磴口 NS kappa=0.000 1R+0.0650 0.0650 0.2447 EW kappa=0.000 1R+0.0562 0.0562 0.6064 -
[1] 白立新, 成云辉, 张杰等, 2019. 河北永清M4.3地震北京烈度仪台网记录分析. 震灾防御技术, 14(1): 210—219. doi: 10.11899/zzfy20190120Bai L. X., Cheng Y. H., Zhang J., et al., 2019. Analysis of the recoed of Beijing seismic intensity meter network for the M 4.3 Yongqing earthquake. Technology for Earthquake Disaster Prevention, 14(1): 210—219. (in Chinese) doi: 10.11899/zzfy20190120 [2] 崔建文, 李正光, 赵云旭, 2007. 2007年宁洱6.4级地震强震动观测记录. 地震研究, 30(4): 384—388. doi: 10.3969/j.issn.1000-0666.2007.04.013Cui J. W., Li Z. G., Zhao Y. X., 2007. Strong motion observation records of the 2007 Ning’er, Yunnan, MS6.4 earthquake. Journal of Seismological Research, 30(4): 384—388. (in Chinese) doi: 10.3969/j.issn.1000-0666.2007.04.013 [3] 高祥林, 马晓静, 李晓丽, 2010. 亚洲东部“大三角”地震构造区的周边和深部动力环境. 地学前缘, 17(4): 33—42.Gao X. L., Ma X. J. Li X. L., 2010. A surrounding and deep dynamic context of the great triangle-shaped seismic region in the eastern Asia continent. Earth Science Frontiers, 17(4): 33—42. (in Chinese) [4] 李文倩, 2014. 用数字地震台网小震数据建立兰州和华北地区强地震动衰减关系. 哈尔滨: 中国地震局工程力学研究所.Li W. Q., 2014. Strong ground motion attenuation relationships for Lanzhou and North China from small earthquake records by China earthquake networks. Harbin: Institute of Engineering Mechanics, China Earthquake Administration. (in Chinese) [5] 陶正如, 陶夏新, 2015. 美国2014地震区划中采用的地震动衰减关系. 世界地震工程, 31(3): 78—84.Tao Z. R., Tao X. X., 2015. Ground motion attenuation relationships adopted in 2014 update of the US national seismic hazard maps. World Earthquake Engineering, 31(3): 78—84. (in Chinese) [6] 万永革, 2012. 数字信号处理的MATLAB实现. 2版. 北京: 科学出版社. [7] 朱百慧, 2016. 强震数据Kappa值影响因素的讨论. 哈尔滨: 中国地震局工程力学研究所.Zhu B. H., 2016. The influence factors of Kappa from strong motion records. Harbin: Institute of Engineering Mechanics, China Earthquake Administration. (in Chinese) [8] Anderson J. G., Hough S. E., 1984. A model for the shape of the Fourier amplitude spectrum of acceleration at high frequencies. Bulletin of the Seismological Society ofAmerica, 74(5): 1969—1993. [9] Anderson J. G., 1986. Implication of attenuation for studies of the earthquake source. American: Earthquake Source Mechanics. American Geophysical Union, 37: 311—318. [10] Anderson, J. G., Humphrey J. R. Jr., 1991. A least squares method for objective determination of earthquake source parameters. Seismological Research Letters, 62(3—4): 201—209. [11] Ktenidou O. J., Gélis C., Bonilla L. F., 2013. A study on the variability of Kappa (κ) in a borehole: implications of the computation process. Bulletin of the Seismological Society of America, 103(2A): 1048—1068. doi: 10.1785/0120120093 [12] Sun X. D., Tao X. X., Duan S. S., et al., 2013. Kappa (k) derived from accelerograms recorded in the 2008 Wenchuanmainshock, Sichuan, China. Journal of Asian Earth Sciences, 73: 306—316. doi: 10.1016/j.jseaes.2013.05.008 -


 下载:
下载:
