
Predict House Area By GM (1, 1) ModelA Case Study of Urumqi
-
摘要: 房屋面积数据是地震灾害损失评估的重要参数,也是地震应急数据库基础数据。数据库要求每年及时更新,但数据更新周期较长,达不到更新要求。本研究主要从乌鲁木齐统计年鉴中提取2001—2018年房屋基础数据,建立乌鲁木齐住宅建筑总面积及人均住宅面积数据增长模型,利用GM(1,1)预测模型和多元线性回归模型预测未来2年乌鲁木齐住宅建筑总面积和人均住宅面积。本研究得到的住宅建筑总面积及人均住宅面积数据可作为应急数据库中相关基础数据更新的补充手段,也可作为未来几年震害预测的参考基础数据。Abstract: Building area is an important parameter of seismic loss assessment and the basic data of earthquake emergency database. The database is required to be updated in time every year, but the statistical data is delayed and the cycle is long, which cannot meet the requirements. We extracted the basic housing data from 2001 to 2018 in Urumqi Statistical Yearbook, then we established the data growth model of total residential building area and per capita residential area in Urumqi. Finally the data of total residential building area and per capita residential area in Urumqi in the next two years were provided by using GM (1, 1) prediction model and multiple linear regression model. The data of total residential building area and per capita residential area obtained in our study can be used as a supplementary means to update the relevant basic data in the emergency database, or as a reference for seismic loss prediction in the next few years.
-
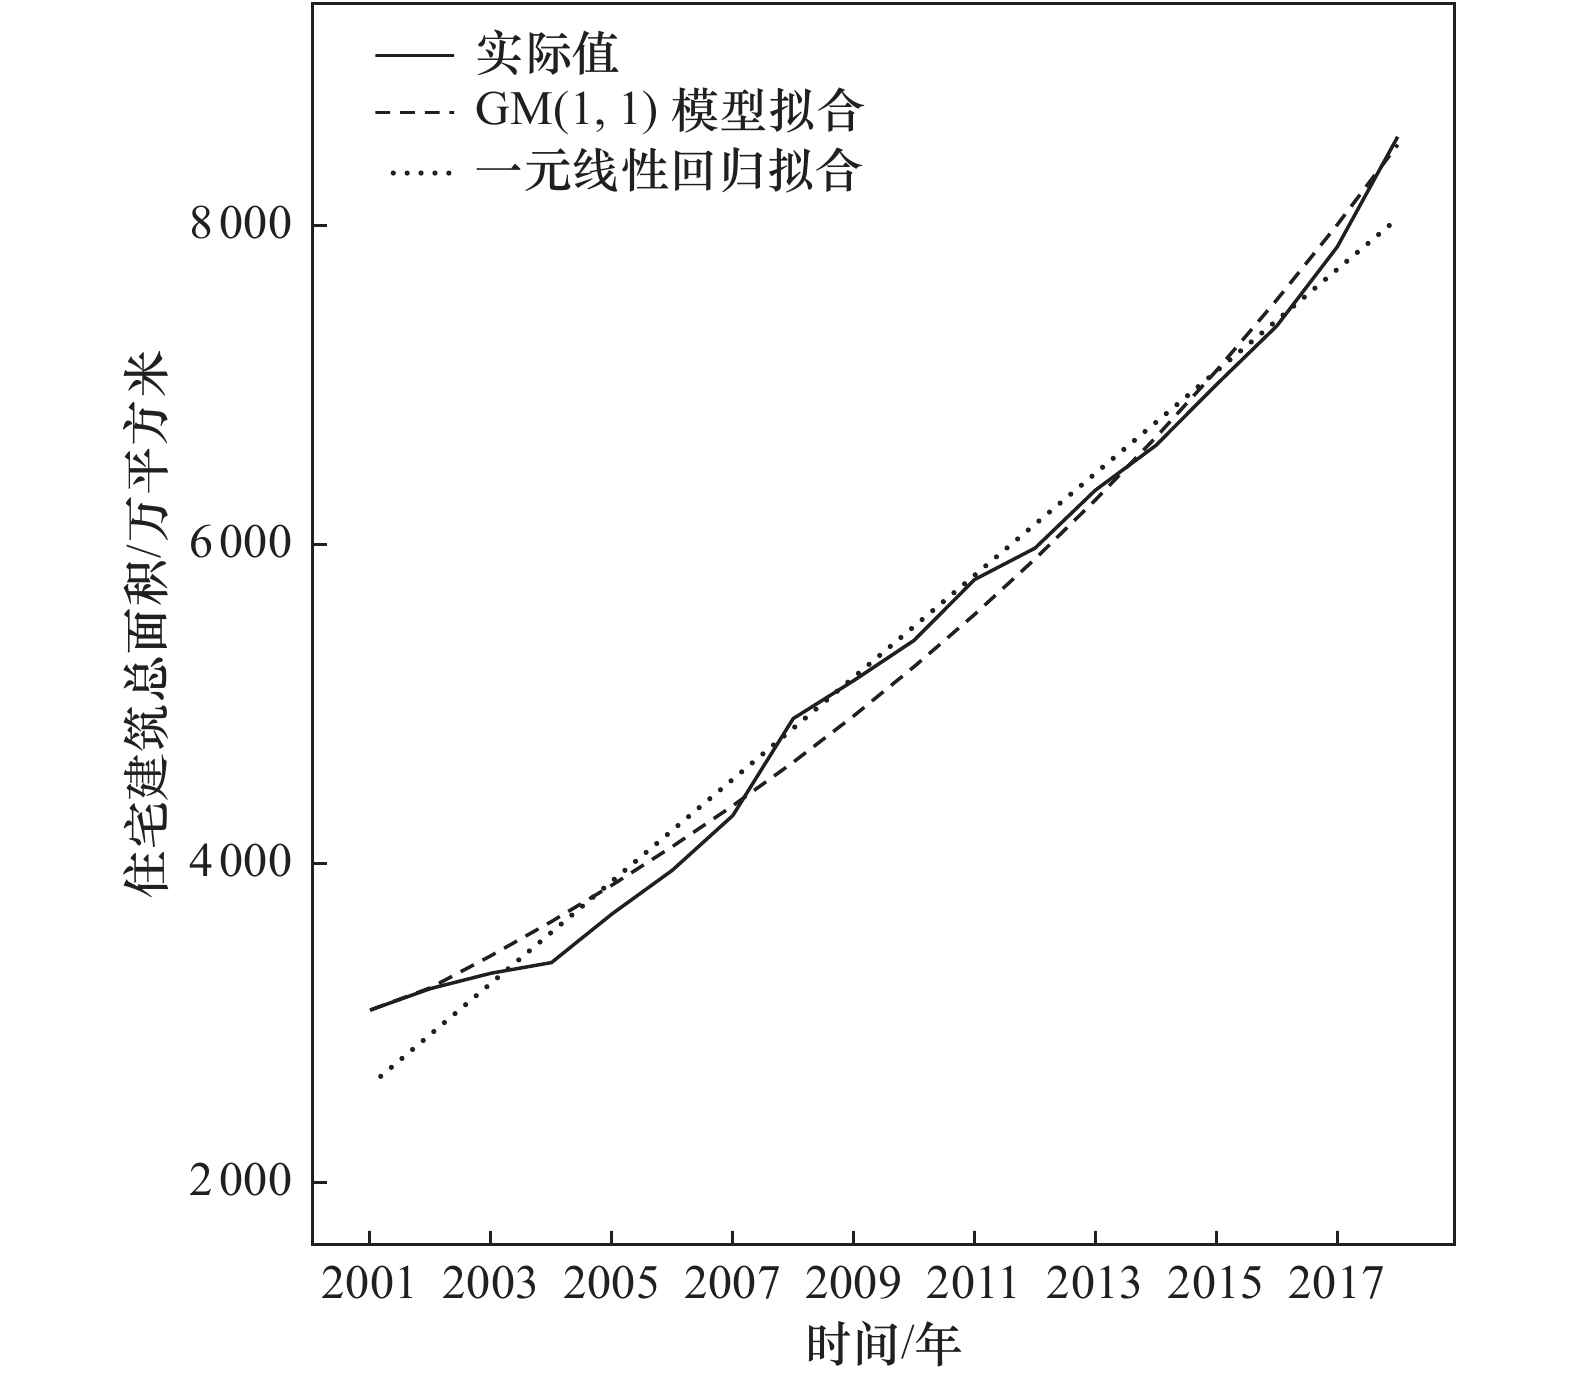
图 3 乌鲁木齐市住宅建筑总面积预测曲线图
Figure 3. Predictive Fitting curve of total area of residential buildings in Urumqi
表 1 乌鲁木齐市住宅建筑总面积和人均住宅面积
Table 1. Total area of residential buildings and per capita residential area in Urumqi
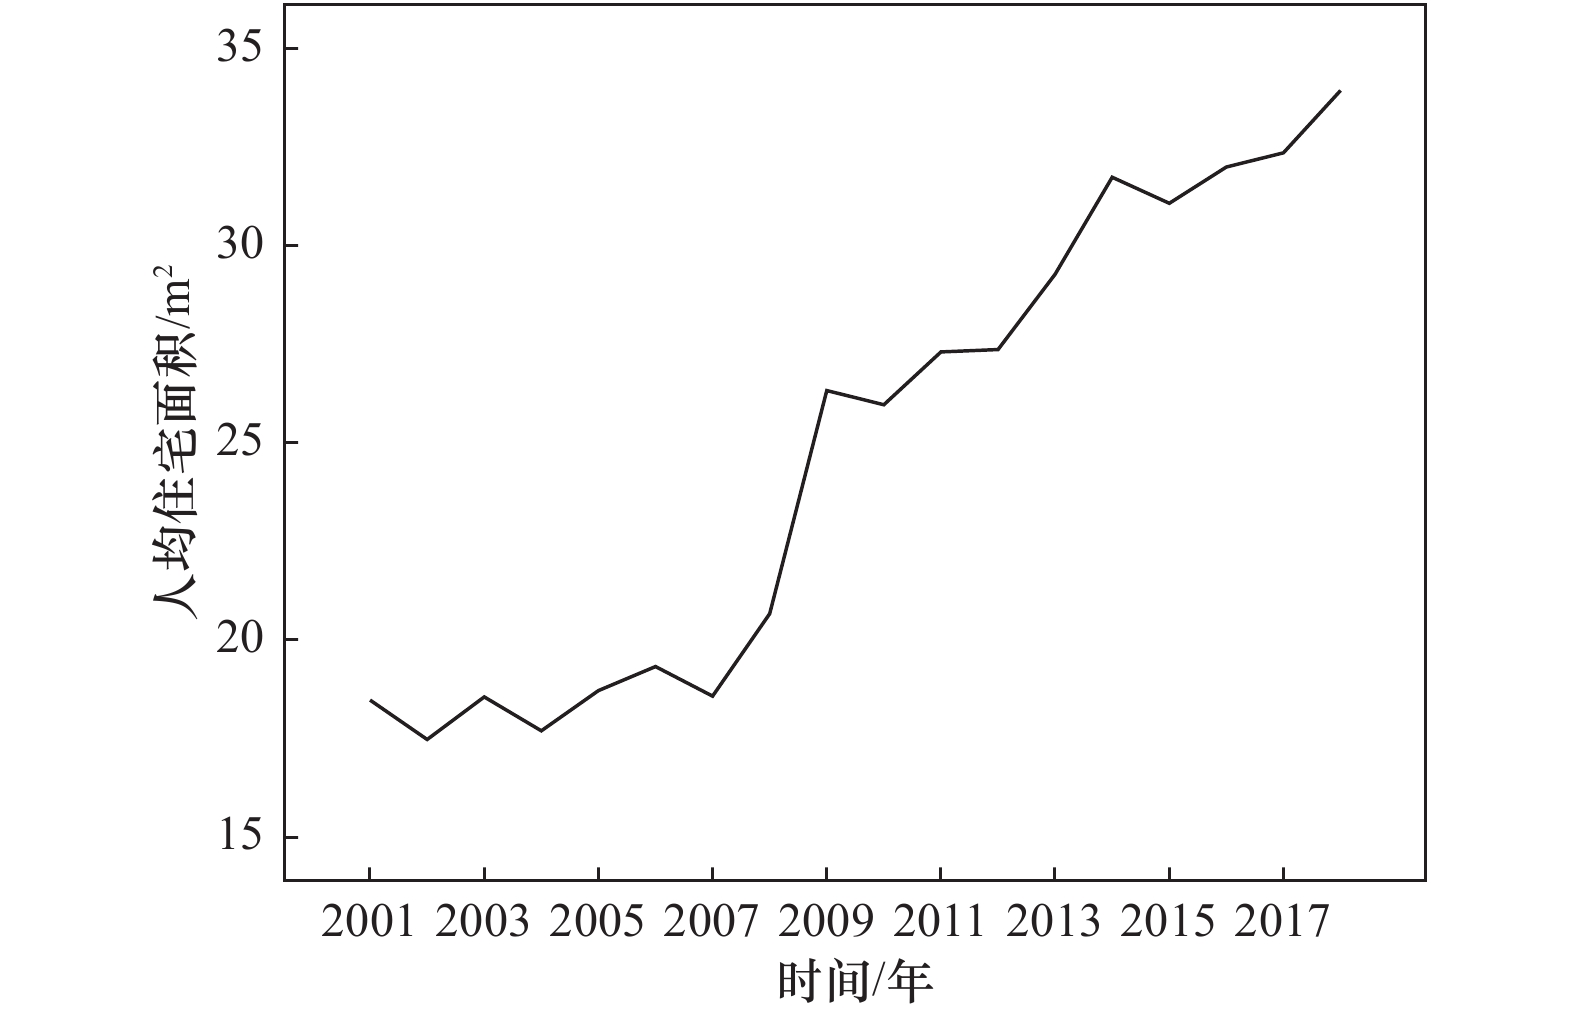
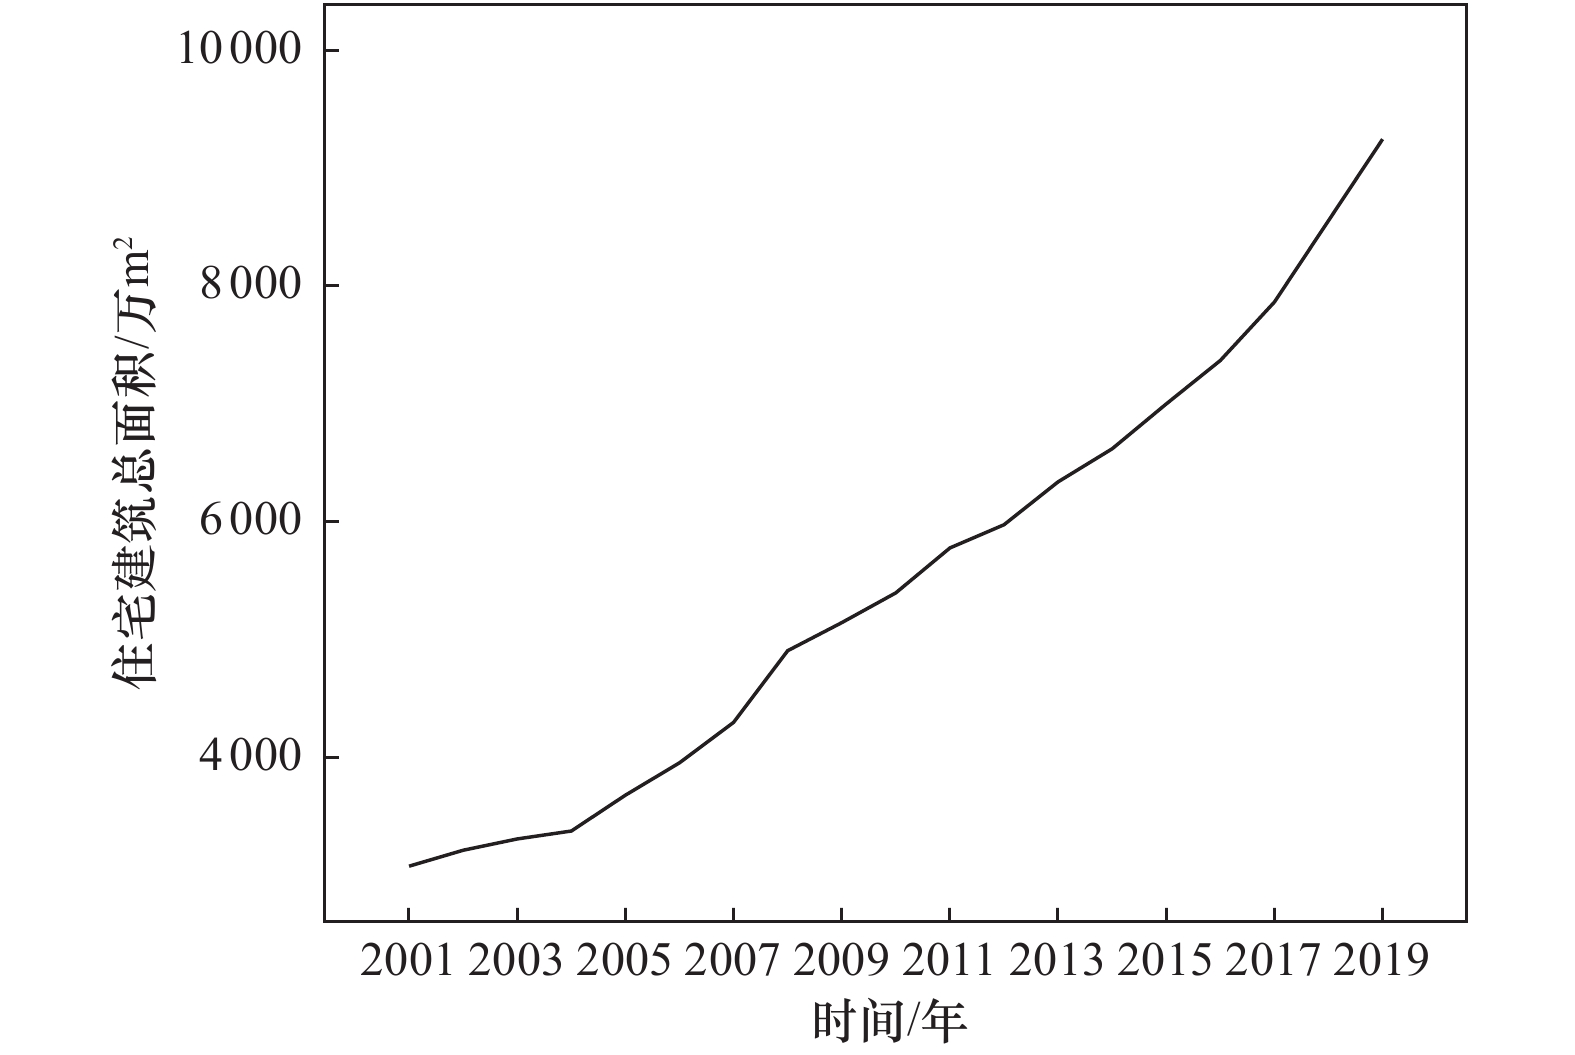
年份 总面积/104m2 人均面积/m2 年份 总面积/104m2 人均面积/m2 2001 3081.00 18.48 2010 5398.93 25.97 2002 3216.00 17.48 2011 5779.95 27.31 2003 3312.00 18.56 2012 5976.64 27.37 2004 3379.00 17.70 2013 6340.26 29.28 2005 3683.31 18.72 2014 6620.65 31.74 2006 3957.60 19.33 2015 7001.20 31.08 2007 4300.37 18.58 2016 7369.64 32.00 2008 4908.29 20.67 2017 7865.22 32.36 2009 5146.32 26.33 2018 8555.64 33.94  下载: 导出CSV
表 2 灰色系统GM(1,1)模型乌鲁木齐市住宅建筑总面积拟合
Table 2. Predictive fitting of total area of residential buildings in Urumqi using grey system GM(1,1) model
年份 实际值/104m2 预测值/104m2 相对误差 年份 实际值/104m2 预测值/104m2 相对误差 2001 3081.00 3081 0.00 2010 5398.93 5234 0.03 2002 3216.00 3221 0.00 2011 5779.95 5561 0.04 2003 3312.00 3422 0.03 2012 5976.64 5909 0.01 2004 3379.00 3636 0.08 2013 6340.26 6279 0.01 2005 3683.31 3864 0.05 2014 6620.65 6672 0.01 2006 3957.60 4106 0.04 2015 7001.20 7089 0.01 2007 4300.37 4362 0.01 2016 7369.64 7533 0.02 2008 4908.29 4635 0.06 2017 7865.22 8004 0.02 2009 5146.32 4925 0.04 2018 8555.64 8505 0.01
下载: 导出CSV
表 3 乌鲁木齐住宅建筑总面积GM(1,1)模型参数
Table 3. Parameters a and b of GM(1,1) model of total area of residential buildings in Urumqi
系数 数值 a −0.0607 b 2936.9
下载: 导出CSV
表 4 精度检验等级参照表
Table 4. Precision inspection level reference table
精度等级指标 相对误差 一级 0.01 二级 0.05 三级 0.10
下载: 导出CSV
表 5 乌鲁木齐住宅建筑总面积一元线性回归参数
Table 5. Univariate linear regression parameter values of total area of residential buildings and per capita residential area in Urumqi
a 系数b 有关指数R2 显著性概率Sig 常数项 斜率 统计量F 系数 319.674 −637058.012 0.983 0.000 −30.144 30.396 923.909
下载: 导出CSV
表 6 一元线性回归模型拟合得到的乌鲁木齐住宅建筑总面积
Table 6. Predictive fitting of total area of residential buildings in Urumqi by univariate linear regression
年份 实际值/104m2 预测值/104m2 相对误差 年份 实际值/104m2 预测值/104m2 相对误差 2001 3081.00 2609.66 0.15 2010 5398.93 5486.73 0.00 2002 3216.00 2929.34 0.09 2011 5779.95 5806.40 0.02 2003 3312.00 3249.01 0.02 2012 5976.64 6126.08 0.00 2004 3379.00 3568.68 0.06 2013 6340.26 6445.75 0.03 2005 3683.31 3888.36 0.06 2014 6620.65 6765.42 0.02 2006 3957.60 4208.03 0.06 2015 7001.20 7085.10 0.01 2007 4300.37 4527.71 0.06 2016 7369.64 7404.77 0.00 2008 4908.29 4847.38 0.05 2017 7865.22 7724.45 0.02 2009 5146.32 5167.05 0.01 2018 8555.64 8044.12 0.06
下载: 导出CSV
表 7 2001—2018年乌鲁木齐人均住宅面积影响因素原始数据
Table 7. Raw data of influencing factors of per capita residential area in Urumqi from 2001 to 2018
年份 人均住宅面积/m2 人均GDP/万元 居民人均可支配收入/元 常住人口/万人 住宅竣工面积/104m2 2001 18.48 1.8331 7897.0 166.71 388.35 2002 17.48 1.7780 8652.0 172.37 389.71 2003 18.56 1.9899 9087.0 178.63 376.44 2004 17.70 2.2820 8948.2 183.74 231.68 2005 18.72 2.5507 9605.0 190.50 267.93 2006 19.33 2.8261 10432.0 198.00 270.08 2007 18.58 3.1140 11373.0 263.42 404.33 2008 20.67 3.7133 12328.0 273.24 427.76 2009 26.33 3.8249 13075.0 284.32 387.32 2010 25.97 4.4917 14402.0 311.03 309.85 2011 27.31 5.2649 16141.0 321.21 287.39 2012 27.37 5.9576 18385.0 335.00 613.24 2013 29.28 6.4695 21304.0 346.00 442.24 2014 31.74 7.0428 26890.0 353.00 812.59 2015 31.08 7.4340 31604.0 355.00 591.62 2016 32.00 6.9865 34190.0 351.96 295.07 2017 32.36 7.7756 37028.0 350.40 378.87 2018 33.94 8.7196 40101.0 350.58 365.24
下载: 导出CSV
表 8 系数
Table 8. Coefficient
项目 非标准化系数 标准系数 斜率 显著性概率Sig 系数b 标准误差 常量b0 10.123 2.702 — 3.746 0.002 人均GDP 1.525 0.020 0.283 1.774 0.2610 常住人口 0.023 1.544 0.133 0.483 0.8637 人均可支配收入 0.746 1.191 0.584 1.281 0.2230 住宅竣工面积 0.000 0.003 −0.008 −0.116 0.9090
下载: 导出CSV
表 9 各模型对乌鲁木齐人均住宅面积拟合值(m2)
Table 9. Predictive fitting of per capita residential area in Urumqi of each model(Unit:m²)
年份 实际值 多元线性回归模型 GM(1,1)模型 一元线性回归模型 理论值 绝对误差 理论值 绝对误差 理论值 绝对误差 2001 18.48 17.34 0.06 18.48 0.00 15.31 0.17 2002 17.48 17.44 0.00 17.11 0.02 16.41 0.06 2003 18.56 17.94 0.03 17.90 0.04 17.50 0.06 2004 17.70 18.50 0.05 18.74 0.06 18.59 0.05 2005 18.72 19.11 0.02 19.61 0.05 19.68 0.05 2006 19.33 19.77 0.02 20.52 0.06 20.77 0.07 2007 18.58 21.78 0.17 21.48 0.16 21.87 0.18 2008 20.67 22.99 0.11 22.47 0.09 22.96 0.11 2009 26.33 23.47 0.11 23.52 0.11 24.05 0.09 2010 25.97 25.20 0.03 24.61 0.05 25.14 0.03 2011 27.31 26.74 0.02 25.76 0.06 26.23 0.04 2012 27.37 28.28 0.03 26.96 0.02 27.33 0.00 2013 29.28 29.54 0.01 28.21 0.04 28.42 0.03 2014 31.74 30.99 0.02 29.53 0.07 29.51 0.07 2015 31.08 31.98 0.03 30.90 0.01 30.60 0.02 2016 32.00 31.42 0.02 32.34 0.01 31.69 0.01 2017 32.36 32.80 0.01 33.84 0.05 32.79 0.01 2018 33.94 34.48 0.02 35.42 0.04 33.88 0.00
下载: 导出CSV
表 10 不同模型误差分布比例
Table 10. Error distribution ratio of each model
模型 误差分级 一级 二级 三级 GM(1,1)模型 17% 61% 89% 一元线性回归模型 22% 56% 83% 多元线性回归模型 17% 78% 83%
下载: 导出CSV
表 11 2019—2020年乌鲁木齐人均住宅面积影响因素预测值
Table 11. The result of total area of per capita residential area in Urumqi from 2019 to 2020
年份 人均GDP/万元 居民人均可支配收入/元 常住人口/万人 2019 10.1917 44550 341.12 2020 11.1629 50070 351.34
下载: 导出CSV
表 12 2019—2020年乌鲁木齐住宅建筑总面积和人均住宅面积预测结果
Table 12. The result of total area of residential buildings and per capita residential area in Urumqi from 2019 to 2020
项目 年份 2019 2020 乌鲁木齐住宅建筑总面积/104m2 9037 9602 乌鲁木齐人均住宅面积/104m2 36.83 38.96
下载: 导出CSV
-
[1] 常想德, 孙静, 谭明等, 2017. 2016年新疆呼图壁6.2级地震房屋震害及成因浅析. 震灾防御技术, 12(1): 1—13. doi: 10.11899/zzfy20170101Chang X. D., Sun J., Tan M., et al., 2017. Study on earthquake damages by the 2016 Hutubi MS 6.2 earthquake. Technology for Earthquake Disaster Prevention, 12(1): 1—13. (in Chinese) doi: 10.11899/zzfy20170101 [2] 陈志敏, 2008. 乌鲁木齐统计年鉴. 北京: 中国统计出版社.Chen Z. M., 2008. Urumqi statistical yearbook. Beijing: China Statistics Press. (in Chinese) [3] 陈志敏, 2009. 乌鲁木齐统计年鉴. 北京: 中国统计出版社.Chen Z. M., 2009. Urumqi statistical yearbook. Beijing: China Statistics Press. (in Chinese) [4] 陈志敏, 2010. 乌鲁木齐统计年鉴. 北京: 中国统计出版社.Chen Z. M., 2010. Urumqi statistical yearbook. Beijing: China Statistics Press. (in Chinese) [5] 邓聚龙, 1990. 灰色系统理论教程. 武汉: 华中理工大学出版社. [6] 何少林, 李佐唐, 张苏平等, 2007. 甘肃省地震应急指挥技术系统设计与实现. 地震地磁观测与研究, 28(5): 71—79. doi: 10.3969/j.issn.1003-3246.2007.05.015He S. L., Li Z. T., Zhang S. P., et al., 2007. Design and implement of technical system for earthquake emergency direction in Gansu Province. Seismological and Geomagnetic Observation and Research, 28(5): 71—79. (in Chinese) doi: 10.3969/j.issn.1003-3246.2007.05.015 [7] 黄国森, 2012. 乌鲁木齐统计年鉴. 北京: 中国统计出版社.Huang G. S., 2012. Urumqi statistical yearbook. Beijing: China Statistics Press. (in Chinese) [8] 黄国森, 2013. 乌鲁木齐统计年鉴. 北京: 中国统计出版社.Huang G. S., 2013. Urumqi statistical yearbook. Beijing: China Statistics Press. (in Chinese) [9] 黄国森, 2014. 乌鲁木齐统计年鉴. 北京: 中国统计出版社.Huang G. S., 2014. Urumqi statistical yearbook. Beijing: China Statistics Press. (in Chinese) [10] 姜立新, 吴天安, 刘在涛等, 2004. 地震现场应急指挥技术系统的结构与设计. 地震, 24(3): 35—41. doi: 10.3969/j.issn.1000-3274.2004.03.006Jiang L. X., Wu T. A., Liu Z. T., et al., 2004. Structure and design of emergency command system in earthquake site. Earthquake, 24(3): 35—41. (in Chinese) doi: 10.3969/j.issn.1000-3274.2004.03.006 [11] 李凯, 张涛, 2018. 基于组合插值的GM(1,1)模型背景值的改进. 计算机应用研究, 35(10): 2994—2999. doi: 10.3969/j.issn.1001-3695.2018.10.026Li K., Zhang T., 2018. Optimization of background value in GM (1,1) model based on combination interpolation. Application Research of Computers, 35(10): 2994—2999. (in Chinese) doi: 10.3969/j.issn.1001-3695.2018.10.026 [12] 刘颂, 江立敏, 1999. GM(1,1)模型在上海市区人均居住面积预测中的应用. 住宅科技, (8): 3—5. [13] 刘伟, 陈浮, 1999. GM(1,1)模型在南京市人均居住面积预测和关联分析中的应用. 城市问题, (1): 15—18.Liu W., Chen F., 1999. Application of GM (1,1) model in the prediction and correlation analysis of per capita living area in Nanjing. Urban Problems, (1): 15—18. (in Chinese) [14] 卢永坤, 代博洋, 庞卫东等, 2011. 云南地区房屋建筑面积的统计和调查结果. 地震研究, 34(4): 533—537. doi: 10.3969/j.issn.1000-0666.2011.04.021Lu Y. K., Dai B. Y., Pang W. D., et al., 2011. Statistical and investigative result of buildings in Yunnan. Journal of Seismological Research, 34(4): 533—537. (in Chinese) doi: 10.3969/j.issn.1000-0666.2011.04.021 [15] 马建, 常想德, 黄帅堂等, 2020. 无人机摄影技术在精河地震房屋震害定量评估中的应用. 震灾防御技术, 15(1): 208—215. doi: 10.11899/zzfy20200121Ma J., Chang X. D., Huang S. T., et al., 2020. Application of UAV photography technology in quantitative assessment of building damage of the Jinghe Earthquake. Technology for Earthquake Disaster Prevention, 15(1): 208—215. (in Chinese) doi: 10.11899/zzfy20200121 [16] 潘世锦, 2015. 乌鲁木齐统计年鉴. 北京: 中国统计出版社.Pan S. J., 2015. Urumqi statistical yearbook. Beijing: China Statistics Press. (in Chinese) [17] 潘世锦, 2016. 乌鲁木齐统计年鉴. 北京: 中国统计出版社.Pan S. J., 2016. Urumqi statistical yearbook. Beijing: China Statistics Press. (in Chinese) [18] 潘世锦, 2017. 乌鲁木齐统计年鉴. 北京: 中国统计出版社.Pan S. J., 2017. Urumqi statistical yearbook. Beijing: China Statistics Press. (in Chinese) [19] 潘世锦, 2018. 乌鲁木齐统计年鉴. 北京: 中国统计出版社.Pan S. J., 2018. Urumqi statistical yearbook. Beijing: China Statistics Press. (in Chinese) [20] 潘世锦, 2019. 乌鲁木齐统计年鉴. 北京: 中国统计出版社.Pan S. J., 2019. Urumqi statistical yearbook. Beijing: China Statistics Press. (in Chinese) [21] 彭振斌, 张闯, 彭文祥等, 2017. GM(1,1)模型背景值构造的不同方法与应用. 东北大学学报(自然科学版), 38(6): 869—873. doi: 10.12068/j.issn.1005-3026.2017.06.022Peng Z. B., Zhang C., Peng W. X., et al., 2017. Different structure methods and application of background value in GM (1,1) model. Journal of Northeastern University (Natural Science), 38(6): 869—873. (in Chinese) doi: 10.12068/j.issn.1005-3026.2017.06.022 [22] 沈艳, 尹金姗, 韩帅等, 2019. 基于数值积分公式的GM(1,1)模型优化研究. 计算机工程与应用, 55(24): 41—45. doi: 10.3778/j.issn.1002-8331.1812-0390Shen Y., Yin J. S., Han S., et al., 2019. Research and its optimization of GM (1,1) model based on numerical integration formula. Computer Engineering and Applications, 55(24): 41—45. (in Chinese) doi: 10.3778/j.issn.1002-8331.1812-0390 [23] 王伟, 2011. 乌鲁木齐统计年鉴. 北京: 中国统计出版社.Wang W., 2011. Urumqi statistical yearbook. Beijing: China Statistics Press. (in Chinese) [24] 王宇, 敬莉, 2016. 基于灰色GM(1, 1)模型和一元线性回归的人口发展趋势预测——以新疆南疆三地州为例. 西部学刊, (7): 54—59. [25] 谢江丽, 李帅, 姚远, 2019. 地震应急数据库中人口数据预测——以乌鲁木齐市为例. 中国地震, 35(2): 389—398. doi: 10.3969/j.issn.1001-4683.2019.02.018Xie J. L., Li S., Yao Y., 2019. Prediction of population data in earthquake emergency database - a case study of Urumqi. Earthquake Research in China, 35(2): 389—398. (in Chinese) doi: 10.3969/j.issn.1001-4683.2019.02.018 [26] 叶淳, 吴翔华, 黄雨婴, 2020. 城镇人均住房建筑面积预测研究——以江苏省为例. 中国房地产, (18): 73—79. [27] 曾亮, 2019. 基于振荡序列的灰色GM(1,1|sin)幂模型及其应用. 浙江大学学报(理学版), 46(6): 697—704.Zeng L., 2019. Grey GM (1,1|sin) power model based on oscillation sequences and its application. Journal of Zhejiang University (Science Edition), 46(6): 697—704. (in Chinese) [28] 赵卓峰, 杨宗润, 2017. 基于残差修正GM(1,1)模型的车流量预测. 计算机科学, 44(4): 96—99, 130. doi: 10.11896/j.issn.1002-137X.2017.04.021Zhao Z. F., Yang Z. R., 2017. Traffic flow forecast based on residual modification GM (1,1) model. Computer Science, 44(4): 96—99, 130. (in Chinese) doi: 10.11896/j.issn.1002-137X.2017.04.021 [29] 郑坚, 陈斌, 2018. 基于时间权重序列的GM(1,1)初始条件优化模型. 控制与决策, 33(3): 529—534.Zheng J., Chen B., 2018. Initial condition optimization of GM (1,1) model based on time weighted sequence. Control and Decision, 33(3): 529—534. (in Chinese) [30] 朱明, 王志荣, 梁华等, 2017. 基于GM(1,1)的残差修正模型的电梯故障率预测. 安全与环境学报, 17(5): 1701—1704.Zhu M., Wang Z. R., Liang H., et al., 2017. Prediction of the elevator failure rate based on the residual error correcting model of GM (1,1). Journal of Safety and environment, 17(5): 1701—1704. (in Chinese) -

 点击查看大图
计量
- 文章访问数: 275
- HTML全文浏览量: 104
- PDF下载量: 13
- 被引次数: 0
