
Research on the Influence of DEM Resolution on the Slope Extraction in Northeast, China
-
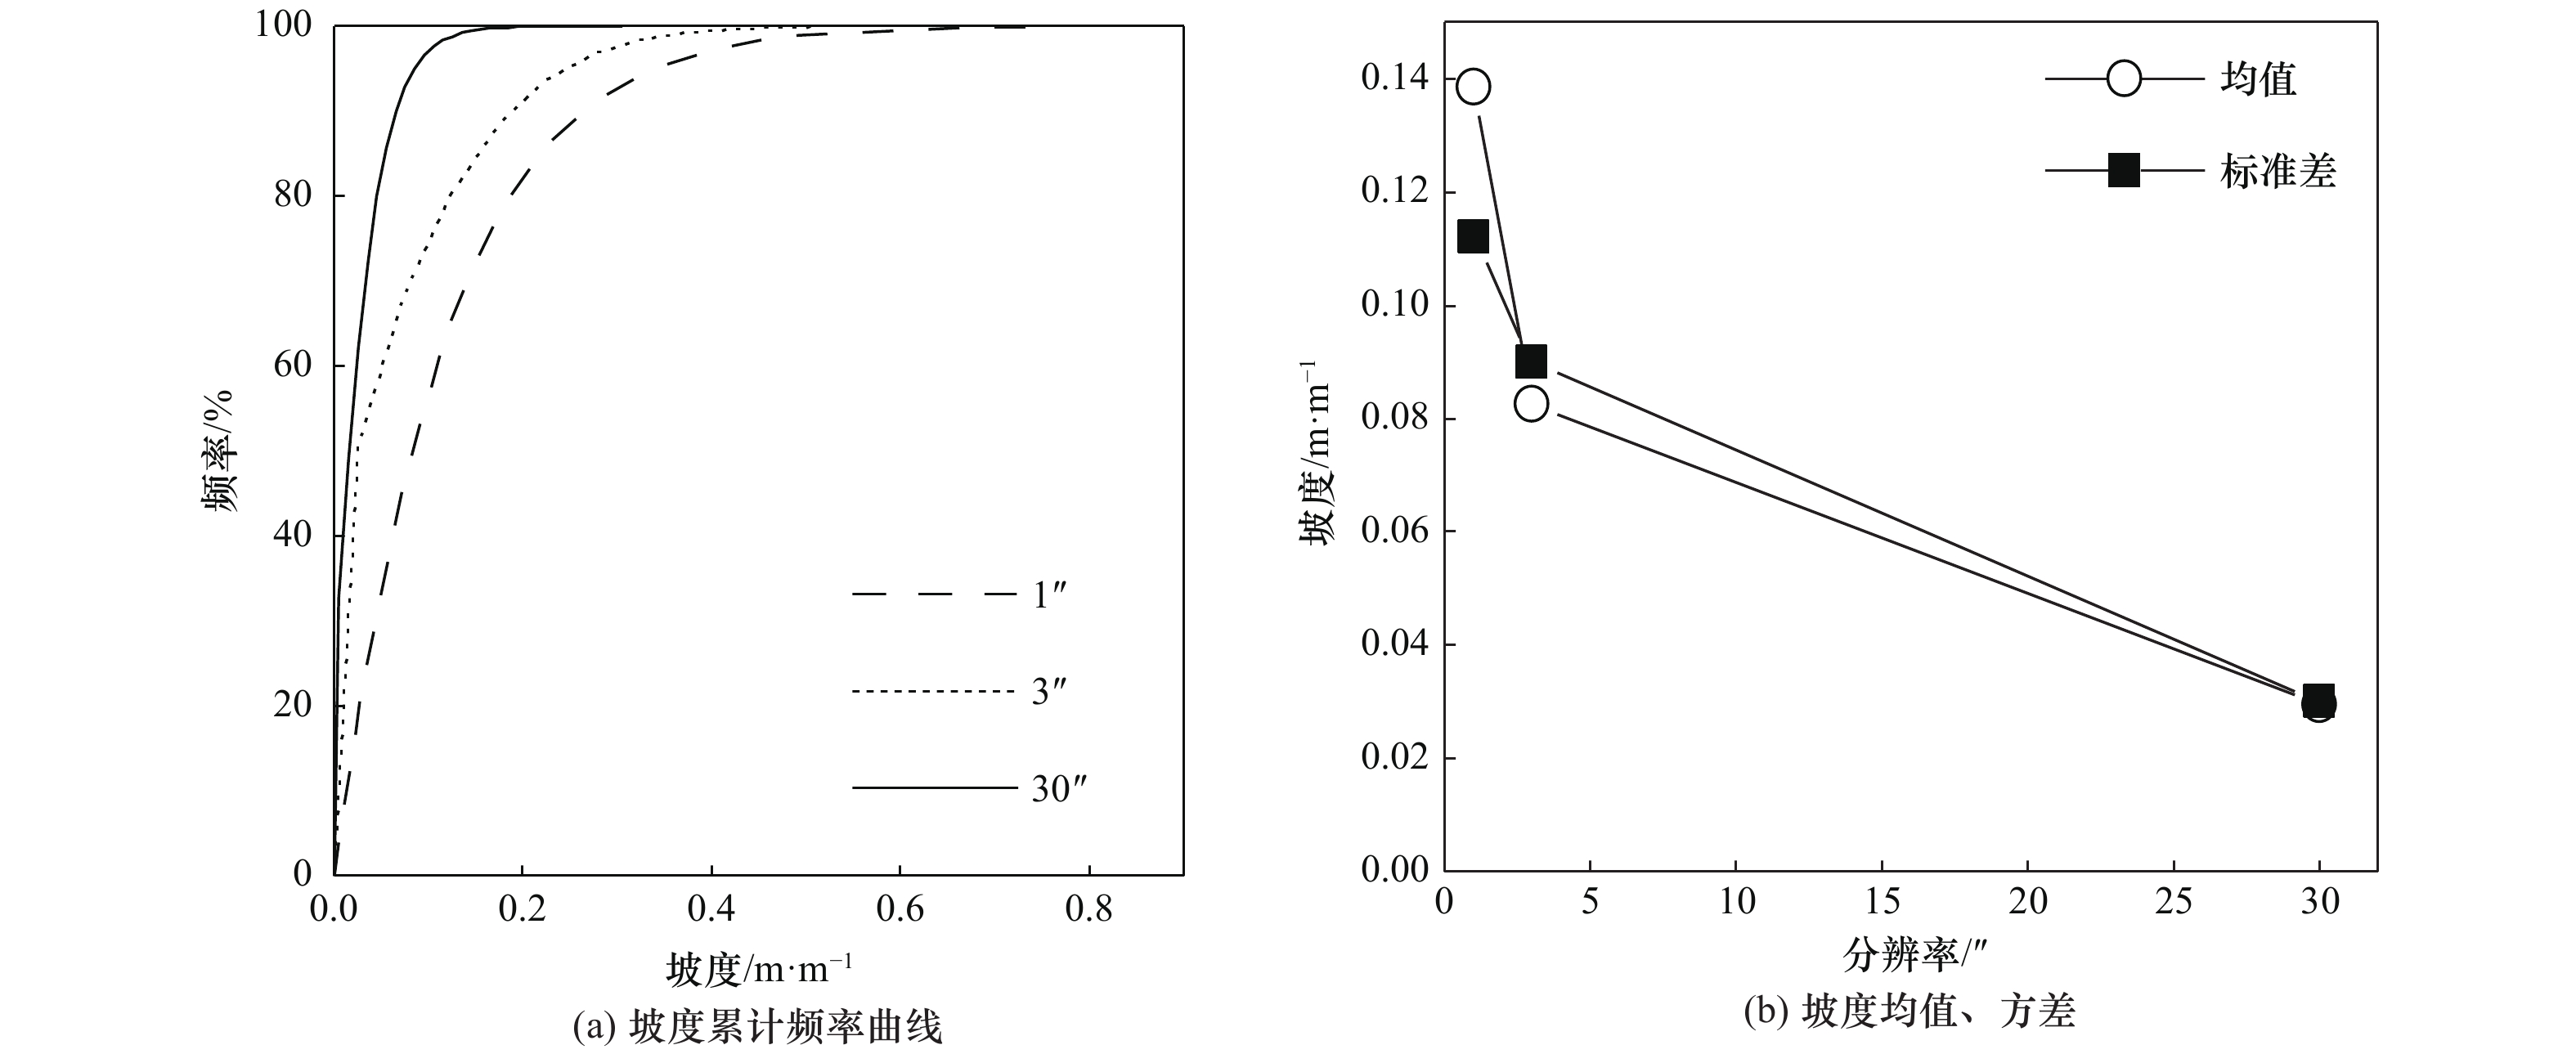
摘要: 目前国内外广泛采用的坡度-等效剪切波速关系模型中,坡度主要基于30″分辨率数字高程数据的提取。DEM分辨率对坡度的提取具有重要影响,且对于不同地区、地貌单元的影响不同。本文以我国东北地区1″、3″、30″分辨率DEM为基础,分别提取研究区域内公里网格点的百分比坡度,分析不同分辨率下提取坡度差异的原因。区分平原、丘陵和山地统计分析坡度随分辨率变化特征,通过比较多种拟合模型的拟合优度和坡度分级平均相对差值,给出不同分辨率下的最佳坡度转换关系。研究结果表明,坡度体现计算面积的平均特性,随着分辨率的增大,栅格计算面积减小,导致坡度有所差异,区域坡度变化越大差异越大;在我国东北地区,随着DEM分辨率的降低,坡度-频率分布曲线向低坡度段移动,且均值、方差及值域变小,不同地貌的坡度-频率分布曲线向低坡度方向移动,且峰值区域变窄,其中平原地貌变化趋势性显著,丘陵次之,山地最小;平原及山地地貌最佳坡度拟合为线性拟合,丘陵地貌下1″、3″与30″分辨率下最佳坡度拟合分别为线性拟合和多项式拟合。Abstract: The regional site classification method based on the slope has been successfully applied. The relationship model of slope-equivalent shear wave velocity based on 30 arc-second DEM is widely used at home and abroad. DEM resolution influences the extraction of the slope, and this influence is different in varying regions and landforms. Based on 1 arc-second, 3 arc-second, and 30 arc-second resolution DEM in Northeast China, this paper extracts the percentage slopes of the kilometer grid points and analyzes the reasons for the different slopes. Analyzing the characteristics of slope change with resolution in varying landforms, comparing the goodness of fit and the average relative difference, the best grade conversion relationship for different resolutions is selected. The results indicate the slope reflects the average characteristics of the calculated area. As the resolution increases, the grid area for slope calculation becomes smaller, which is the main reason for the different slopes. And the greater the slope of the area, the more significant the difference. With the decrease of DEM resolution, the frequency distribution curve of slope shifts to the low slope section, and the mean, variance, and range of values become smaller. The frequency distribution curves of varying landforms also move to the low slopes section, and the peak area becomes narrower. Among them, the changing trend of plain landforms is significant, followed by hills and mountains. The best fits for the slopes of plain and mountainous landforms are linear fitting. The best fits for slopes of 1 arc-second, 3 arc-seconds and 30 arc-seconds of hilly landforms are linear fitting and polynomial fitting, respectively.
-
Key words:
- DEM resolution /
- Landform /
- Slope /
- Slope conversion /
- Site classification
-
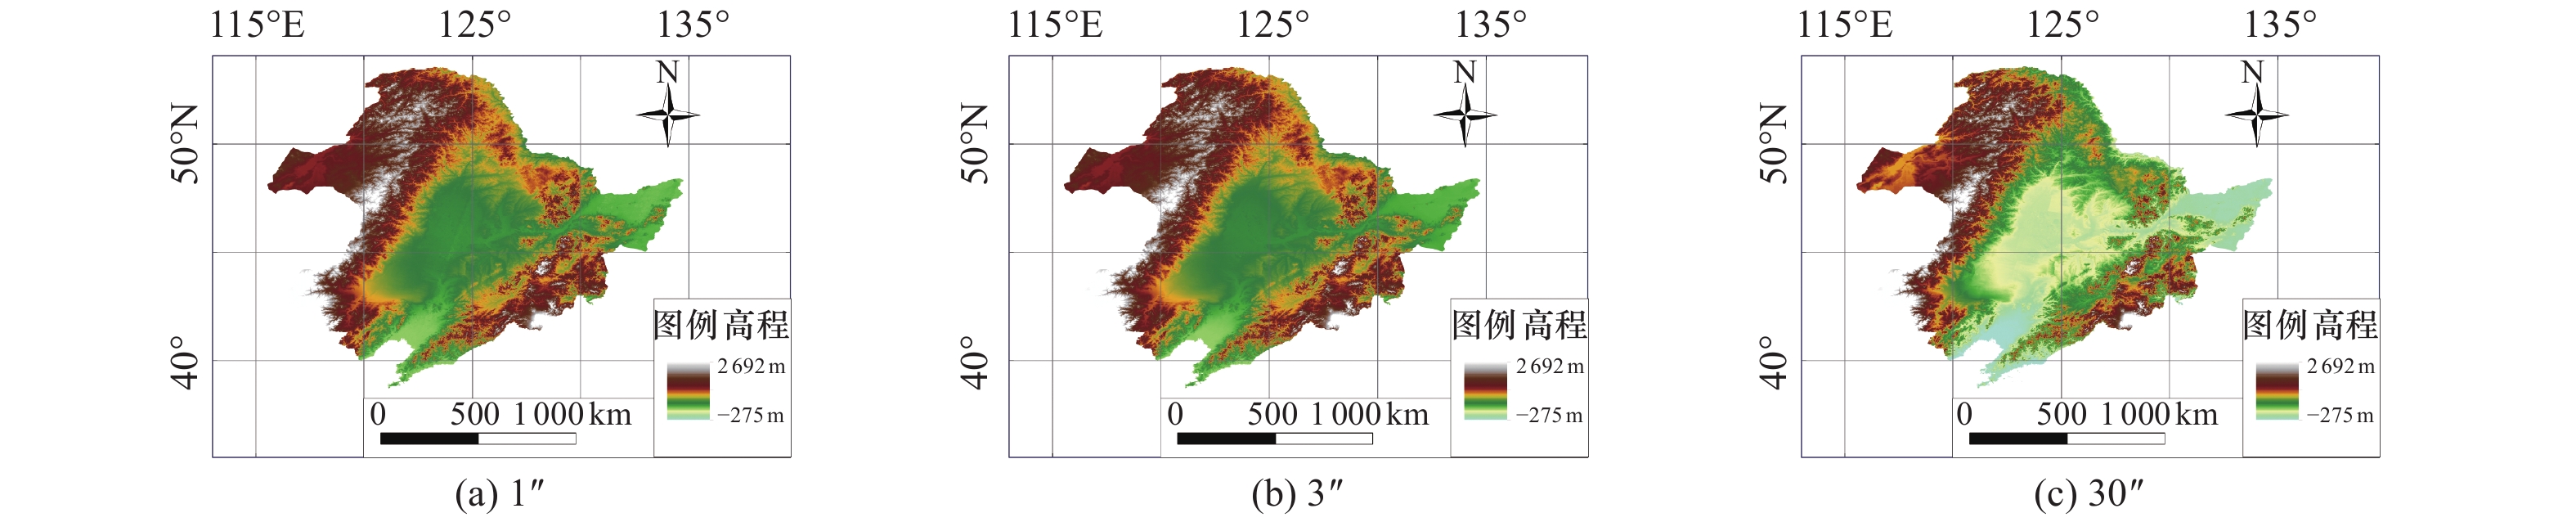
图 1 东北地区不同分辨率下高程数据模型图
Figure 1. Elevation maps of 1 arc second, 3 arc second, and 30 arc second resolution in the Northeast, China
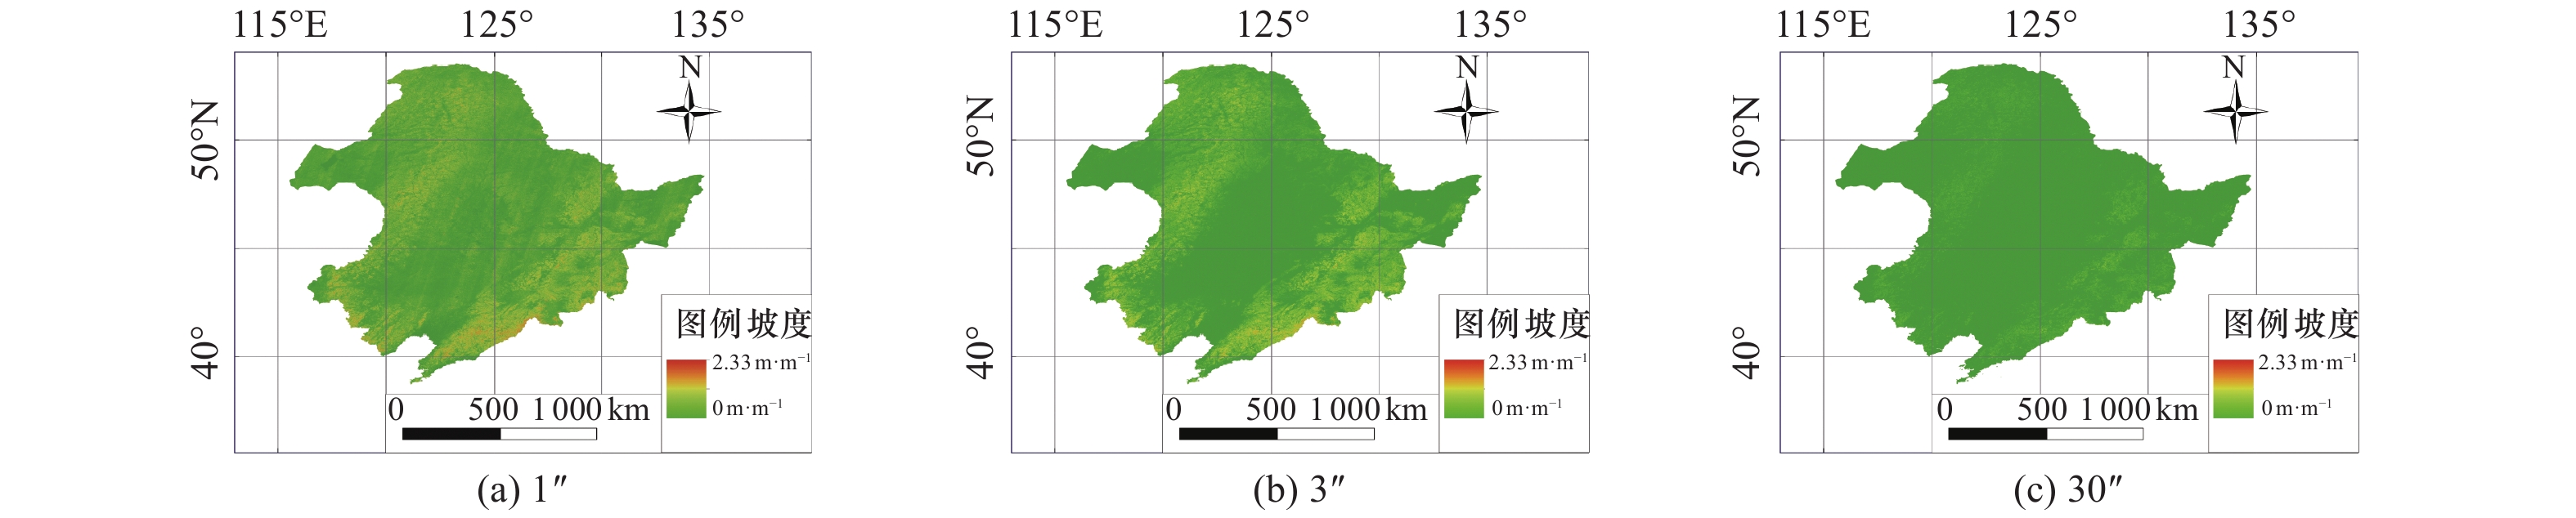
图 3 东北地区不同分辨率下坡度图
Figure 3. Slope maps of 1 arc second, 3 arc second, and 30 arc second resolution in the Northeast, China
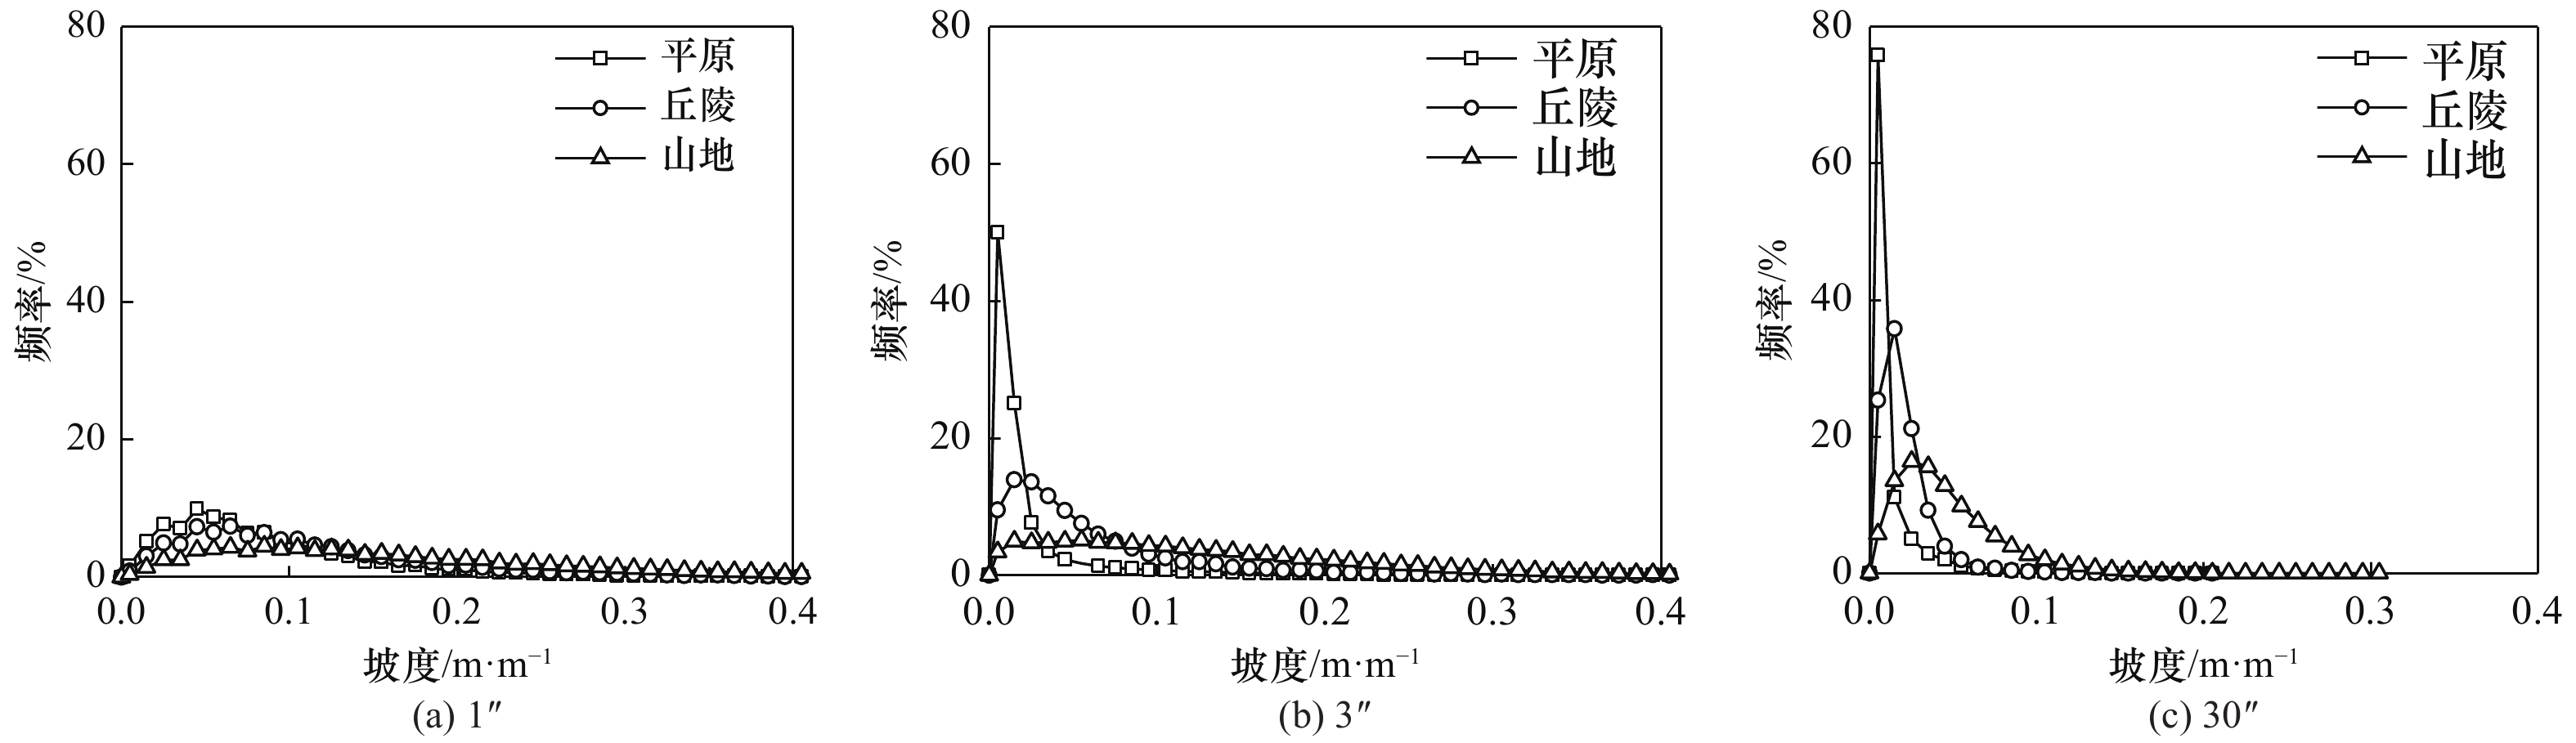
图 6 不同分辨率下不同地貌单元坡度-频率分布曲线
Figure 6. Slope-frequency distribution curves of different topography at different resolutions
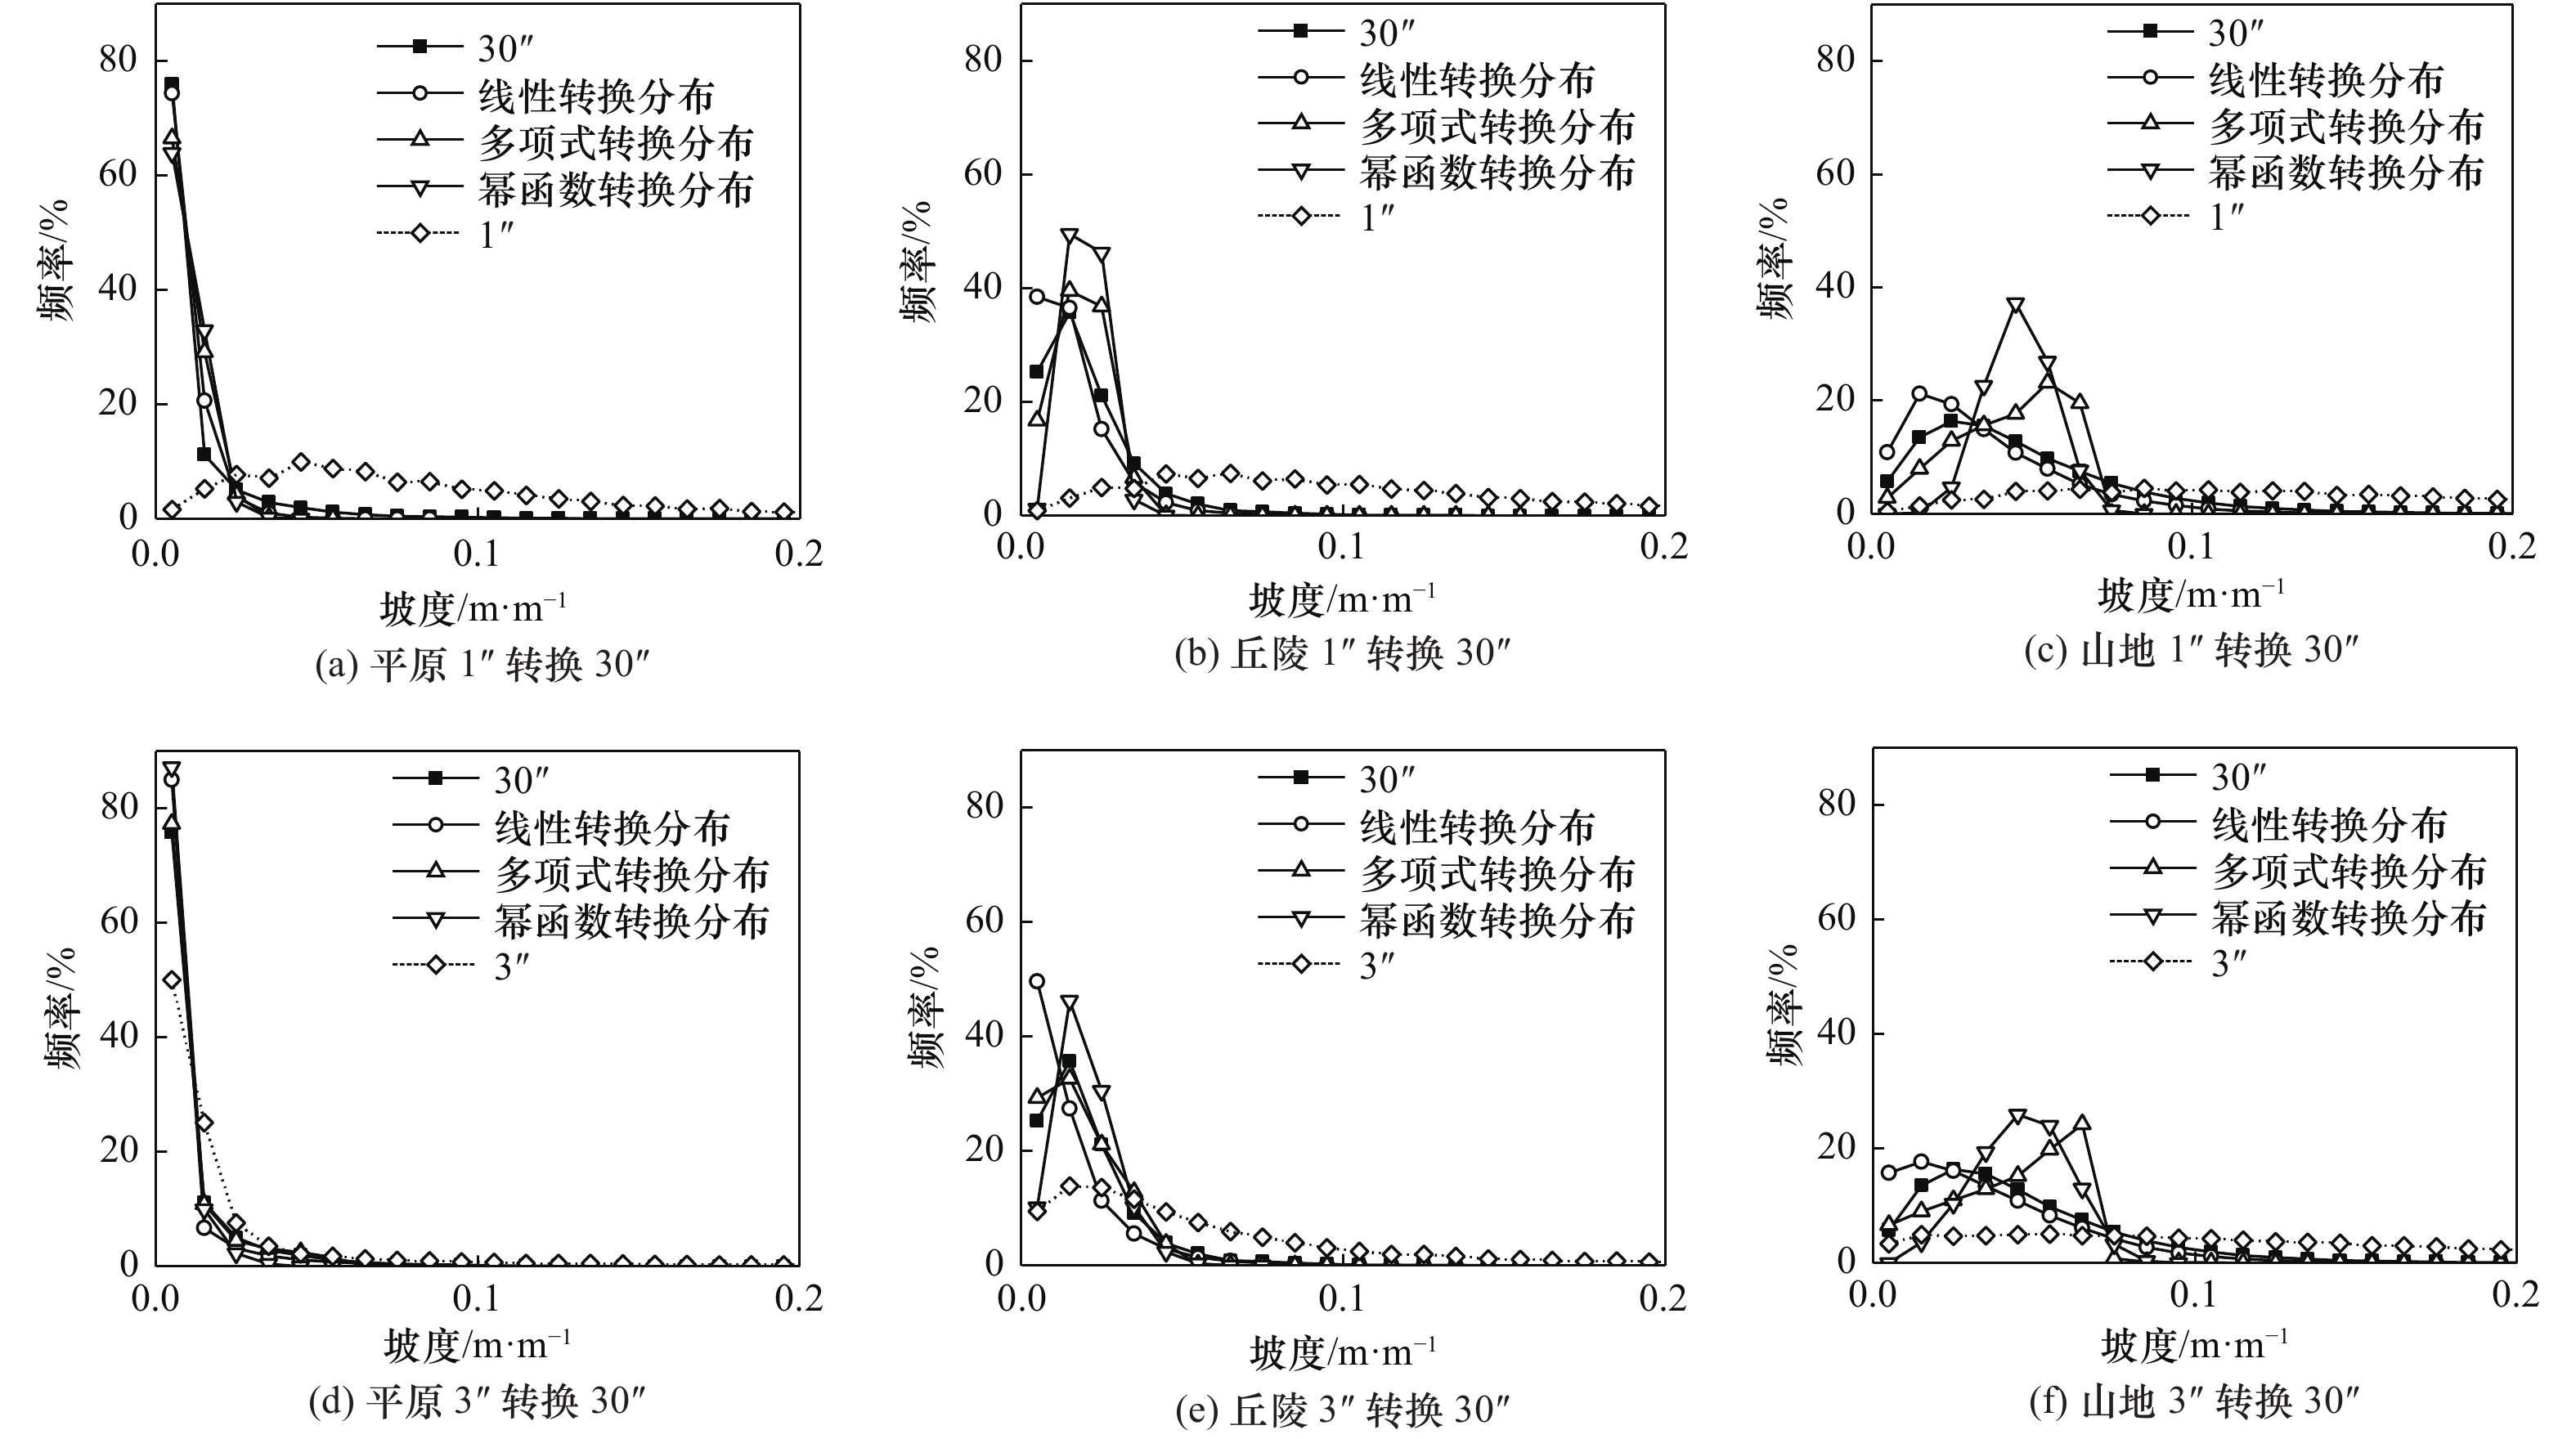
图 7 不同地貌单元不同分辨率下坡度转换结果
Figure 7. Conversion results of DEM slopes with different resolutions under different landforms
表 1 不同地貌单元回归模型拟合参数及评价参数(1″与30″分辨率下)
Table 1. Fitting and evaluation parameters of regression models for different landforms (1 arc second and 30 arc second)
地貌单元类型 拟合模型 拟合参数 R2 Δmean K a b c d 平原 线性函数 0 0.085 63 — — 0.313 40 0.535 7 0.585 0 多项式函数 0.114 600 −0.154 80 0.090 50 0 0.322 20 0.763 9 0.421 7 幂函数 0.047 160 0.658 50 0 — 0.080 00 0.892 3 0.089 6 丘陵 线性函数 0 0.132 57 — — 0.552 50 0.320 8 1.722 2 多项式函数 0.259 270 −0.736 80 0.711 46 0 0.610 81 0.486 5 1.255 5 幂函数 0.043 249 0.329 23 0 — 0.077 8 0.842 3 0.092 3 山地 线性函数 0 0.199 24 — — 0.598 49 0.345 1 1.734 2 多项式函数 0.445 110 −0.996 52 0.686 59 0 0.687 30 0.714 8 0.961 5 幂函数 0.079 990 0.287 73 0 — 0.092 45 0.965 3 0.095 7  下载: 导出CSV
表 2 不同地貌单元回归模型拟合参数及评价参数(3″与30″分辨率下)
Table 2. Fitting and evaluation parameters of regression models for different landforms (3 arc second and 30 arc second)
地貌 拟合模型 拟合参数 R2 Δmean K a b c d 平原 线性函数 0 0.180 0 — — 0.313 40 0.106 7 2.937 20 多项式函数 0.485 0 −1.476 0 1.646 0 0.322 20 0.324 4 0.993 20 幂函数 0.160 0 0.713 0 0 — 0.080 00 0.525 9 0.152 10 丘陵 线性函数 0 0.246 0 — — 0.552 50 0.385 1 1.434 70 多项式函数 0.449 0 −1.695 0 2.337 0 0.610 81 0.410 1 1.489 40 幂函数 0.082 1 0.465 0 0 — 0.077 80 0.579 9 0.134 10 山地 线性函数 0 0.279 8 — — 0.598 49 0.354 1 1.690 10 多项式函数 0.635 0 −2.104 0 2.366 0 0.687 30 0.716 0 0.959 90 幂函数 0.103 6 0.360 2 0 — 0.092 45 0.782 7 0.118 11
下载: 导出CSV
表 3 不同地貌单元不同分辨率下坡度转换公式
Table 3. The slope conversion formula of different resolution DEM for different landforms
地貌单元类型 与30″的转换关系 1″(i=1″) 3″(i=3″) 平原 $ {S_{30}} = {\text{0}}{\text{.085 63}}{S_{{i}}} $ $ {S_{30}} = {\text{0}}{\text{.18}}{S_{{i}}} $ 丘陵 $ {S_{30}} = {\text{0}}{\text{.132 57}}{S_{{i}}} $ $ {S_{30}} = {\text{0}}{\text{.449}}{S_{{i}}}{{ - 1}}{\text{.695}}{S_{{i}}}^{\text{2}}{\text{ + 2}}{\text{.337}}{S_{{i}}}^{\text{3}} $ 山地 $ {S_{30}} = {\text{0}}{\text{.199 24}}{S_{{i}}} $ $ {S_{30}} = {\text{0}}{\text{.279 8}}{S_{{i}}} $
下载: 导出CSV
-
[1] 李昕蕾, 2020. 基于多因素的区域场地分类方法研究. 哈尔滨: 中国地震局工程力学研究所.Li X. L., 2020. Regional site classification method based on multiple factors. Harbin: Institute of Engineering Mechanics, China Earthquake Administration. (in Chinese) [2] 刘飞, 范建容, 崔兆岩等, 2019. 基于DEM分形特征的坡度尺度变换模型. 山地学报, 37(1): 129—136Liu F., Fan J. R., Cui Z. Y., et al., 2019. A model of re-scaling slope based on DEM fractal feature. Mountain Research, 37(1): 129—136. (in Chinese) [3] 刘利峰, 2018. DEM分辨率对白马小流域坡度与坡向提取的影响. 山西水土保持科技, (2): 10—12 doi: 10.3969/j.issn.1008-0120.2018.02.005Liu L. F., 2018. DEM resolving capability influence on extract slope and aspect in Baima minor watershed. Soil and Water Conservation Science and Technology in Shanxi, (2): 10—12. (in Chinese) doi: 10.3969/j.issn.1008-0120.2018.02.005 [4] 刘晓, 赵荣, 梁勇等, 2017. 顾及地貌与DEM分辨率的坡度算法适应性研究. 测绘科学, 42(3): 29—34Liu X., Zhao R., Liang Y., et al., 2017. Research of algorithms for deriving slope based on different geomorphic types and DEM resolution. Science of Surveying and Mapping, 42(3): 29—34. (in Chinese) [5] 乔之轩, 2019. 基于DEM的多分辨率水文特征提取. 北京: 北京林业大学.Qiao Z. X., 2019. Multi-resolution hydrological feature extraction based on DEM. Beijing: Beijing Forestry University. (in Chinese) [6] 师动, 朱奇峰, 杨勤科等, 2020. DEM分辨率对坡度算法选择影响的分析. 山地学报, 38(6): 935—944Shi D., Zhu Q. F., Yang Q. K., et al., 2020. DEM resolution influence on slope algorithm selection. Mountain Research, 38(6): 935—944. (in Chinese) [7] 史大成, 2009. 基于GIS的场地分类新方法研究. 哈尔滨: 中国地震局工程力学研究所.Shi D. C., 2009. Study on new methods of site classification based on GIS. Harbin: Institute of Engineering Mechanics, China Earthquake Administration. (in Chinese) [8] 土祥, 王春梅, 庞国伟等, 2018. 黄土丘陵沟壑区坡度尺度效应空间分异分析. 山地学报, 36(6): 964—972Tu X., Wang C. M., Pang G. W., et al., 2018. On the spatial differentiation of scale effect of slopes in Loess Hill and Gully Region, China. Mountain Research, 36(6): 964—972. (in Chinese) [9] 王英, 龚家国, 贾仰文等, 2019. 基于不同分辨率DEM提取坡度值的转换关系研究. 水利水电技术, 50(8): 45—51Wang Y., Gong J. G., Jia Y. W., et al., 2019. Study on conversion relationship of slope information extracted from different resolution DEM. Water Resources and Hydropower Engineering, 50(8): 45—51. (in Chinese) [10] 吴效勇, 2019. 基于多因素的地震影响场研究. 北京: 中国地震局地震预测研究所.Wu X. Y., 2019. Study on seismic influence field based on multi-factors. Beijing: Institute of Earthquake Forecasting, China Earthquake Administration. (in Chinese) [11] Grohmann C. H., 2015. Effects of spatial resolution on slope and aspect derivation for regional-scale analysis. Computers & Geosciences, 77: 111—117. [12] Horn B. K. P., 1981. Hill shading and the reflectance map. Proceedings of the IEEE, 69(1): 14—47. doi: 10.1109/PROC.1981.11918 [13] Mukherjee S., Mukherjee S., Garg R. D., et al., 2013. Evaluation of topographic index in relation to terrain roughness and DEM grid spacing. Journal of Earth System Science, 122(3): 869—886. doi: 10.1007/s12040-013-0292-0 [14] Olaya V., 2009. Basic land-surface parameters. Developments in Soil Science, 33: 141—169. [15] Thompson E. M., Wald D. J., Worden C. B., 2014. A Vs30 map for California with geologic and topographic constraints. Bulletin of the Seismological Society of America, 104(5): 2313—2321. doi: 10.1785/0120130312 [16] Thornley J. H. M., 1976. Mathematical models in plant physiology. London: Academic Press, 86—110. [17] Wald D. J., Earle P. E., Lin K. W., et al., 2006. Challenges in rapid ground motion estimation for the prompt assessment of global urban earthquakes. Bulletin of the Earthquake Research Institute, 81: 273—281. [18] Walker J. P., Willgoose G. R., 1999. On the effect of digital elevation model accuracy on hydrology and geomorphology. Water Resources Research, 35(7): 2259—2268. doi: 10.1029/1999WR900034 [19] Wang C. M., Yang Q. K., Guo W. L., et al., 2012. Influence of resolution on slope in areas with different topographic characteristics. Computers & Geosciences, 41: 156—168. -


 点击查看大图
计量
- 文章访问数: 216
- HTML全文浏览量: 205
- PDF下载量: 16
- 被引次数: 0
