
Difference Between Horizontal-to-Vertical Spectral Ratio and Surface-to-Bedrock Spectral ratio of Strong-Motion and Modified Horizontal-to-Vertical Spectral Ratio Method
-
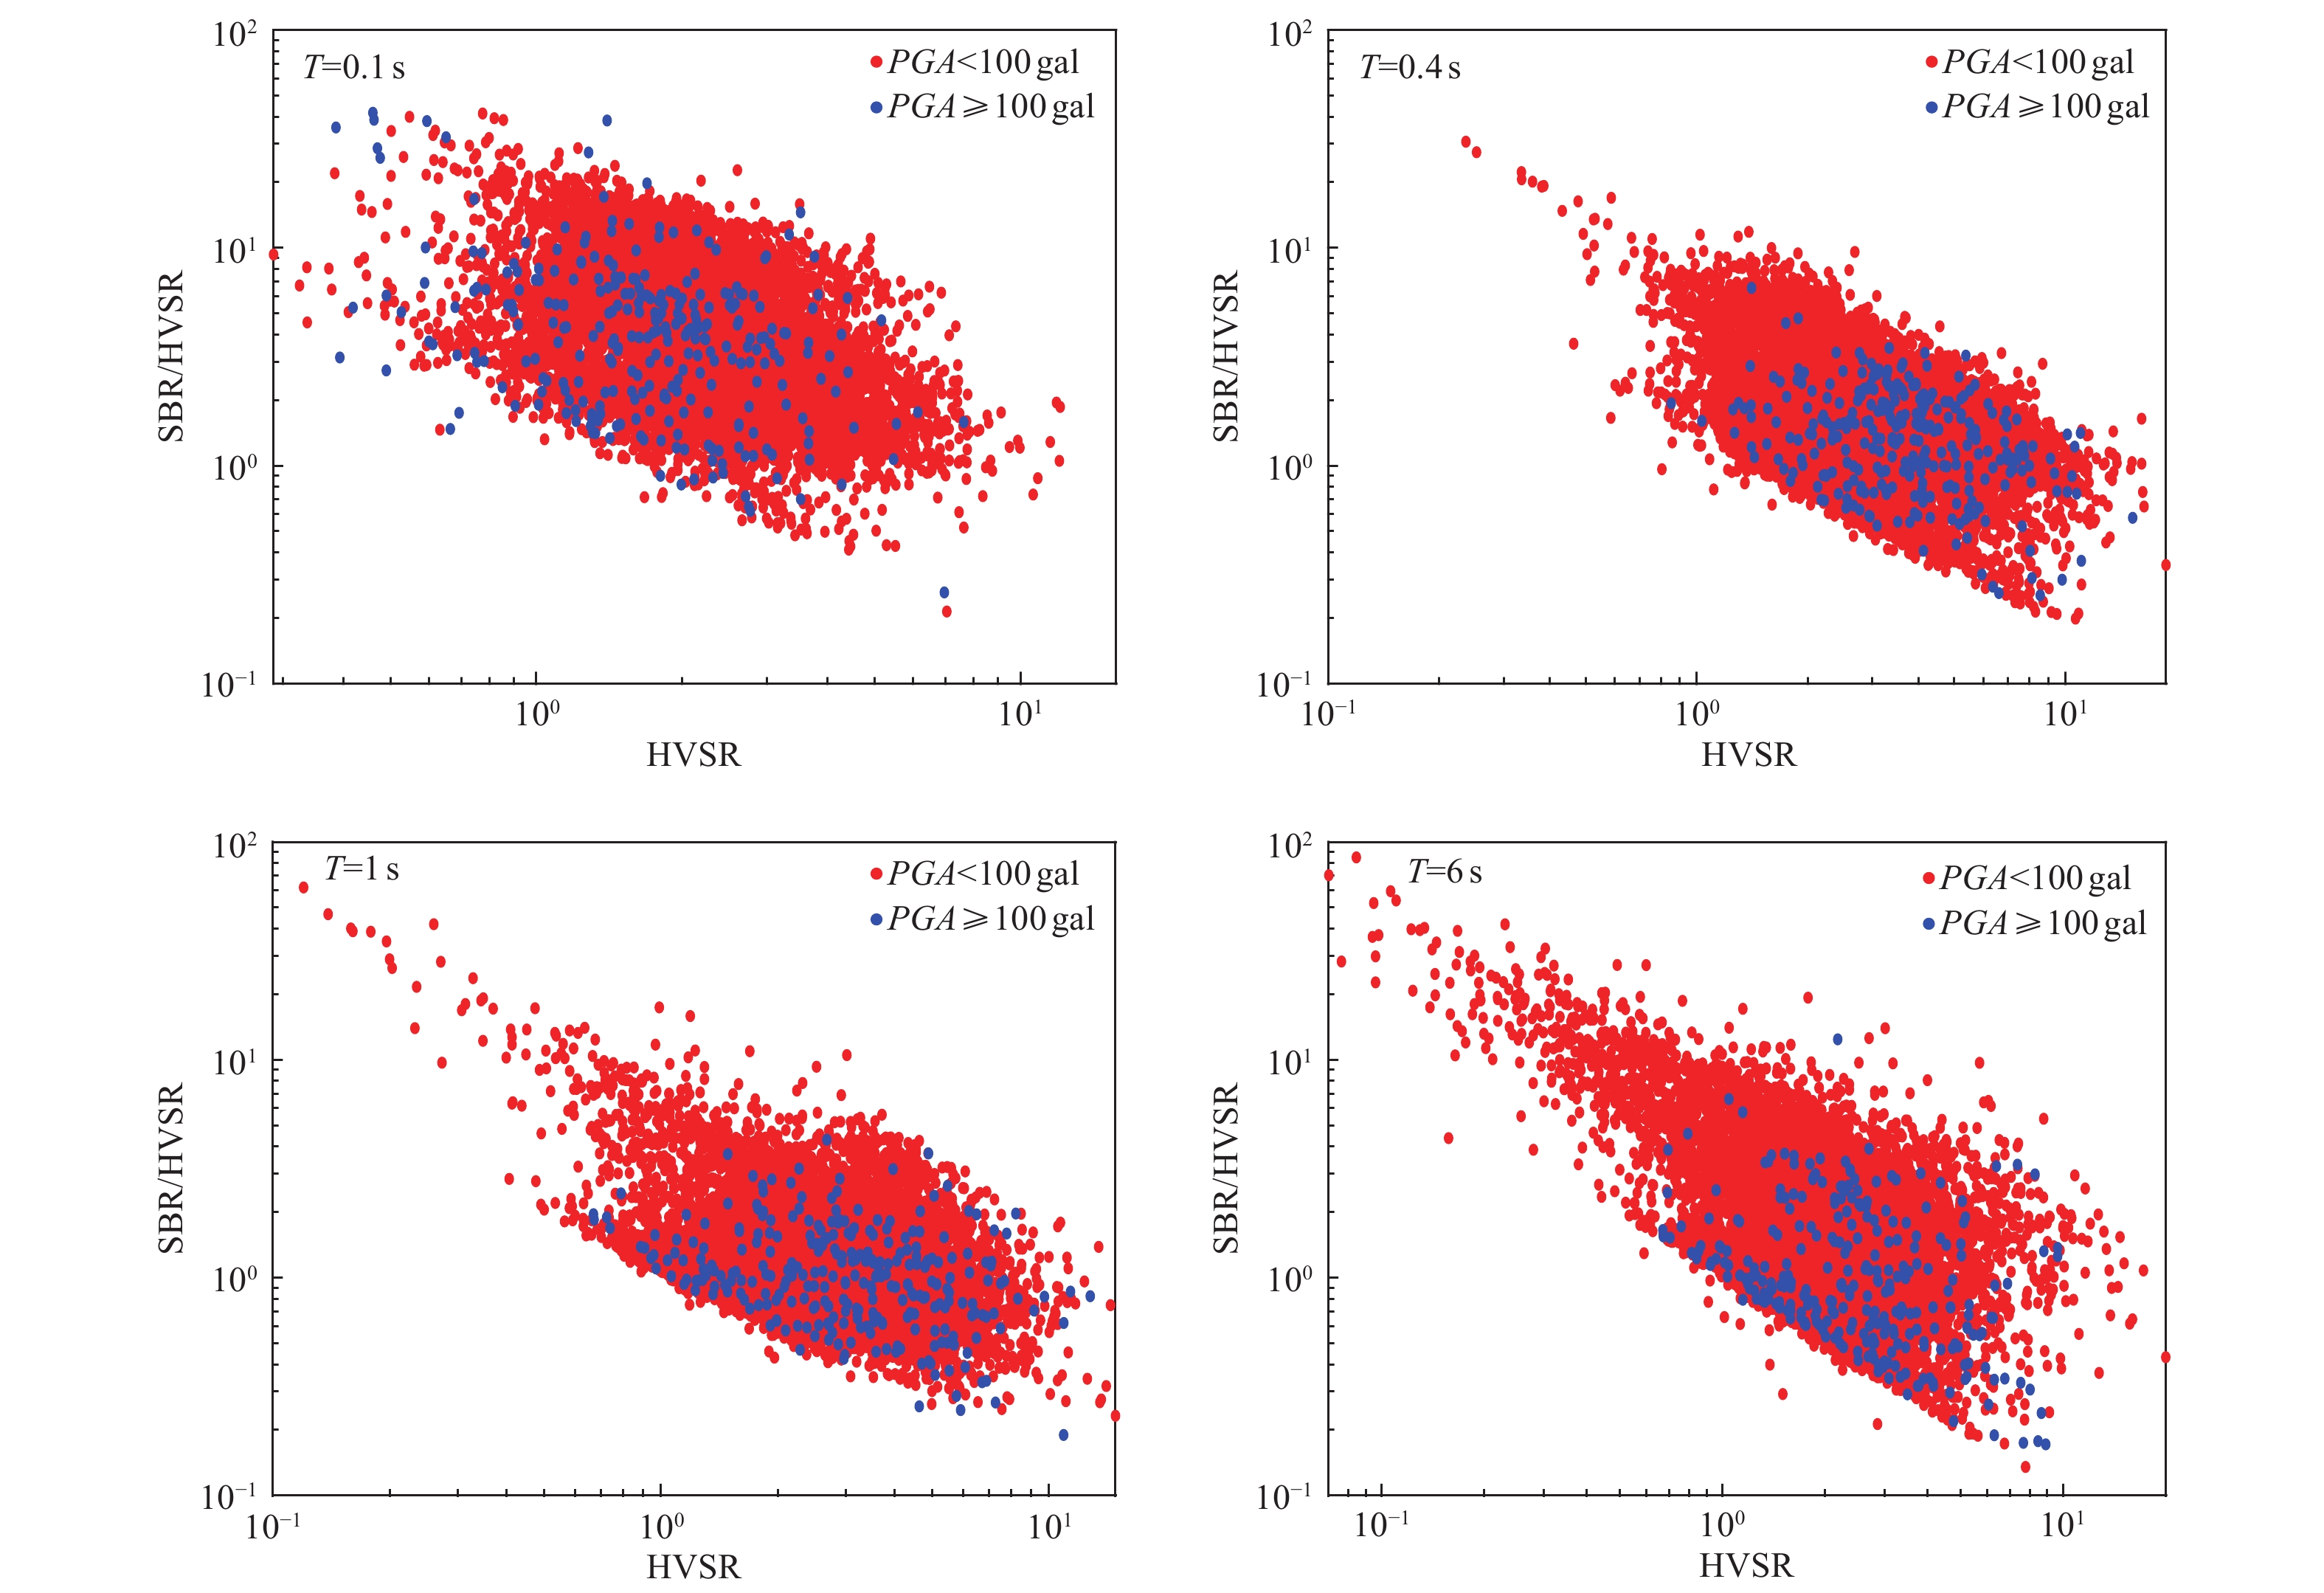
摘要: 局部场地条件是决定场地地震动强度和频谱的重要因素,基于强震动和脉动记录的统计分析,获取表征场地条件影响的特征参数已成为确定工程场地设计地震动的较经济和实用方法,特别是对于大范围或难以开展现场勘测的工程场地。利用日本KiK-net台网强震动记录计算分析了台站场地地震动水平/竖向谱比(HVSR)与地表/基底谱比(SBSR)的差异,揭示SBSR/HVSR与HVSR呈对数线性分布的统计特征,并给出其定量关系,据此提出表征场地对地震动影响的修正水平/竖向谱比法。修正水平/竖向谱比法具有仅需地表观测记录的优势,并进一步考虑了场地竖向地震效应对水平/竖向谱比法精度的影响,更能合理地表征场地对地震动的影响。Abstract: During an earthquake, local site conditions are an important factor in determining the intensity and spectrum of ground motion. Statistical analysis to obtain characteristic parameters to characterize the influence of site conditions based on strong-motion and microtremor has become a more economical and practical method to determine the design ground motion of engineering sites, especially for a large survey area or an engineering site that are difficult to carry out site survey. The differences between the surface-to-bedrock spectral ratio (HVSR) and the horizontal-to-vertical spectral ratio (SBSR) of the strong-motion station sites were analyzed by using the strong-motion records from the Japanese KiK-net network, the statistical characteristics of log linear relation between SBSR/HVSR and HVSR was revealed, and a quantitative relationship between them was obtained, and then a modified horizontal-to-vertical spectral ratio method was proposed to characterize the influence of site conditions on ground-motion. This modified method has the advantage that the HVSR method only needs surface records, and further considers the influence of the vertical seismic effect on the accuracy of the HVSR method. The modified HVSR method can more reasonably characterize the influence of site conditions on ground-motion.
-

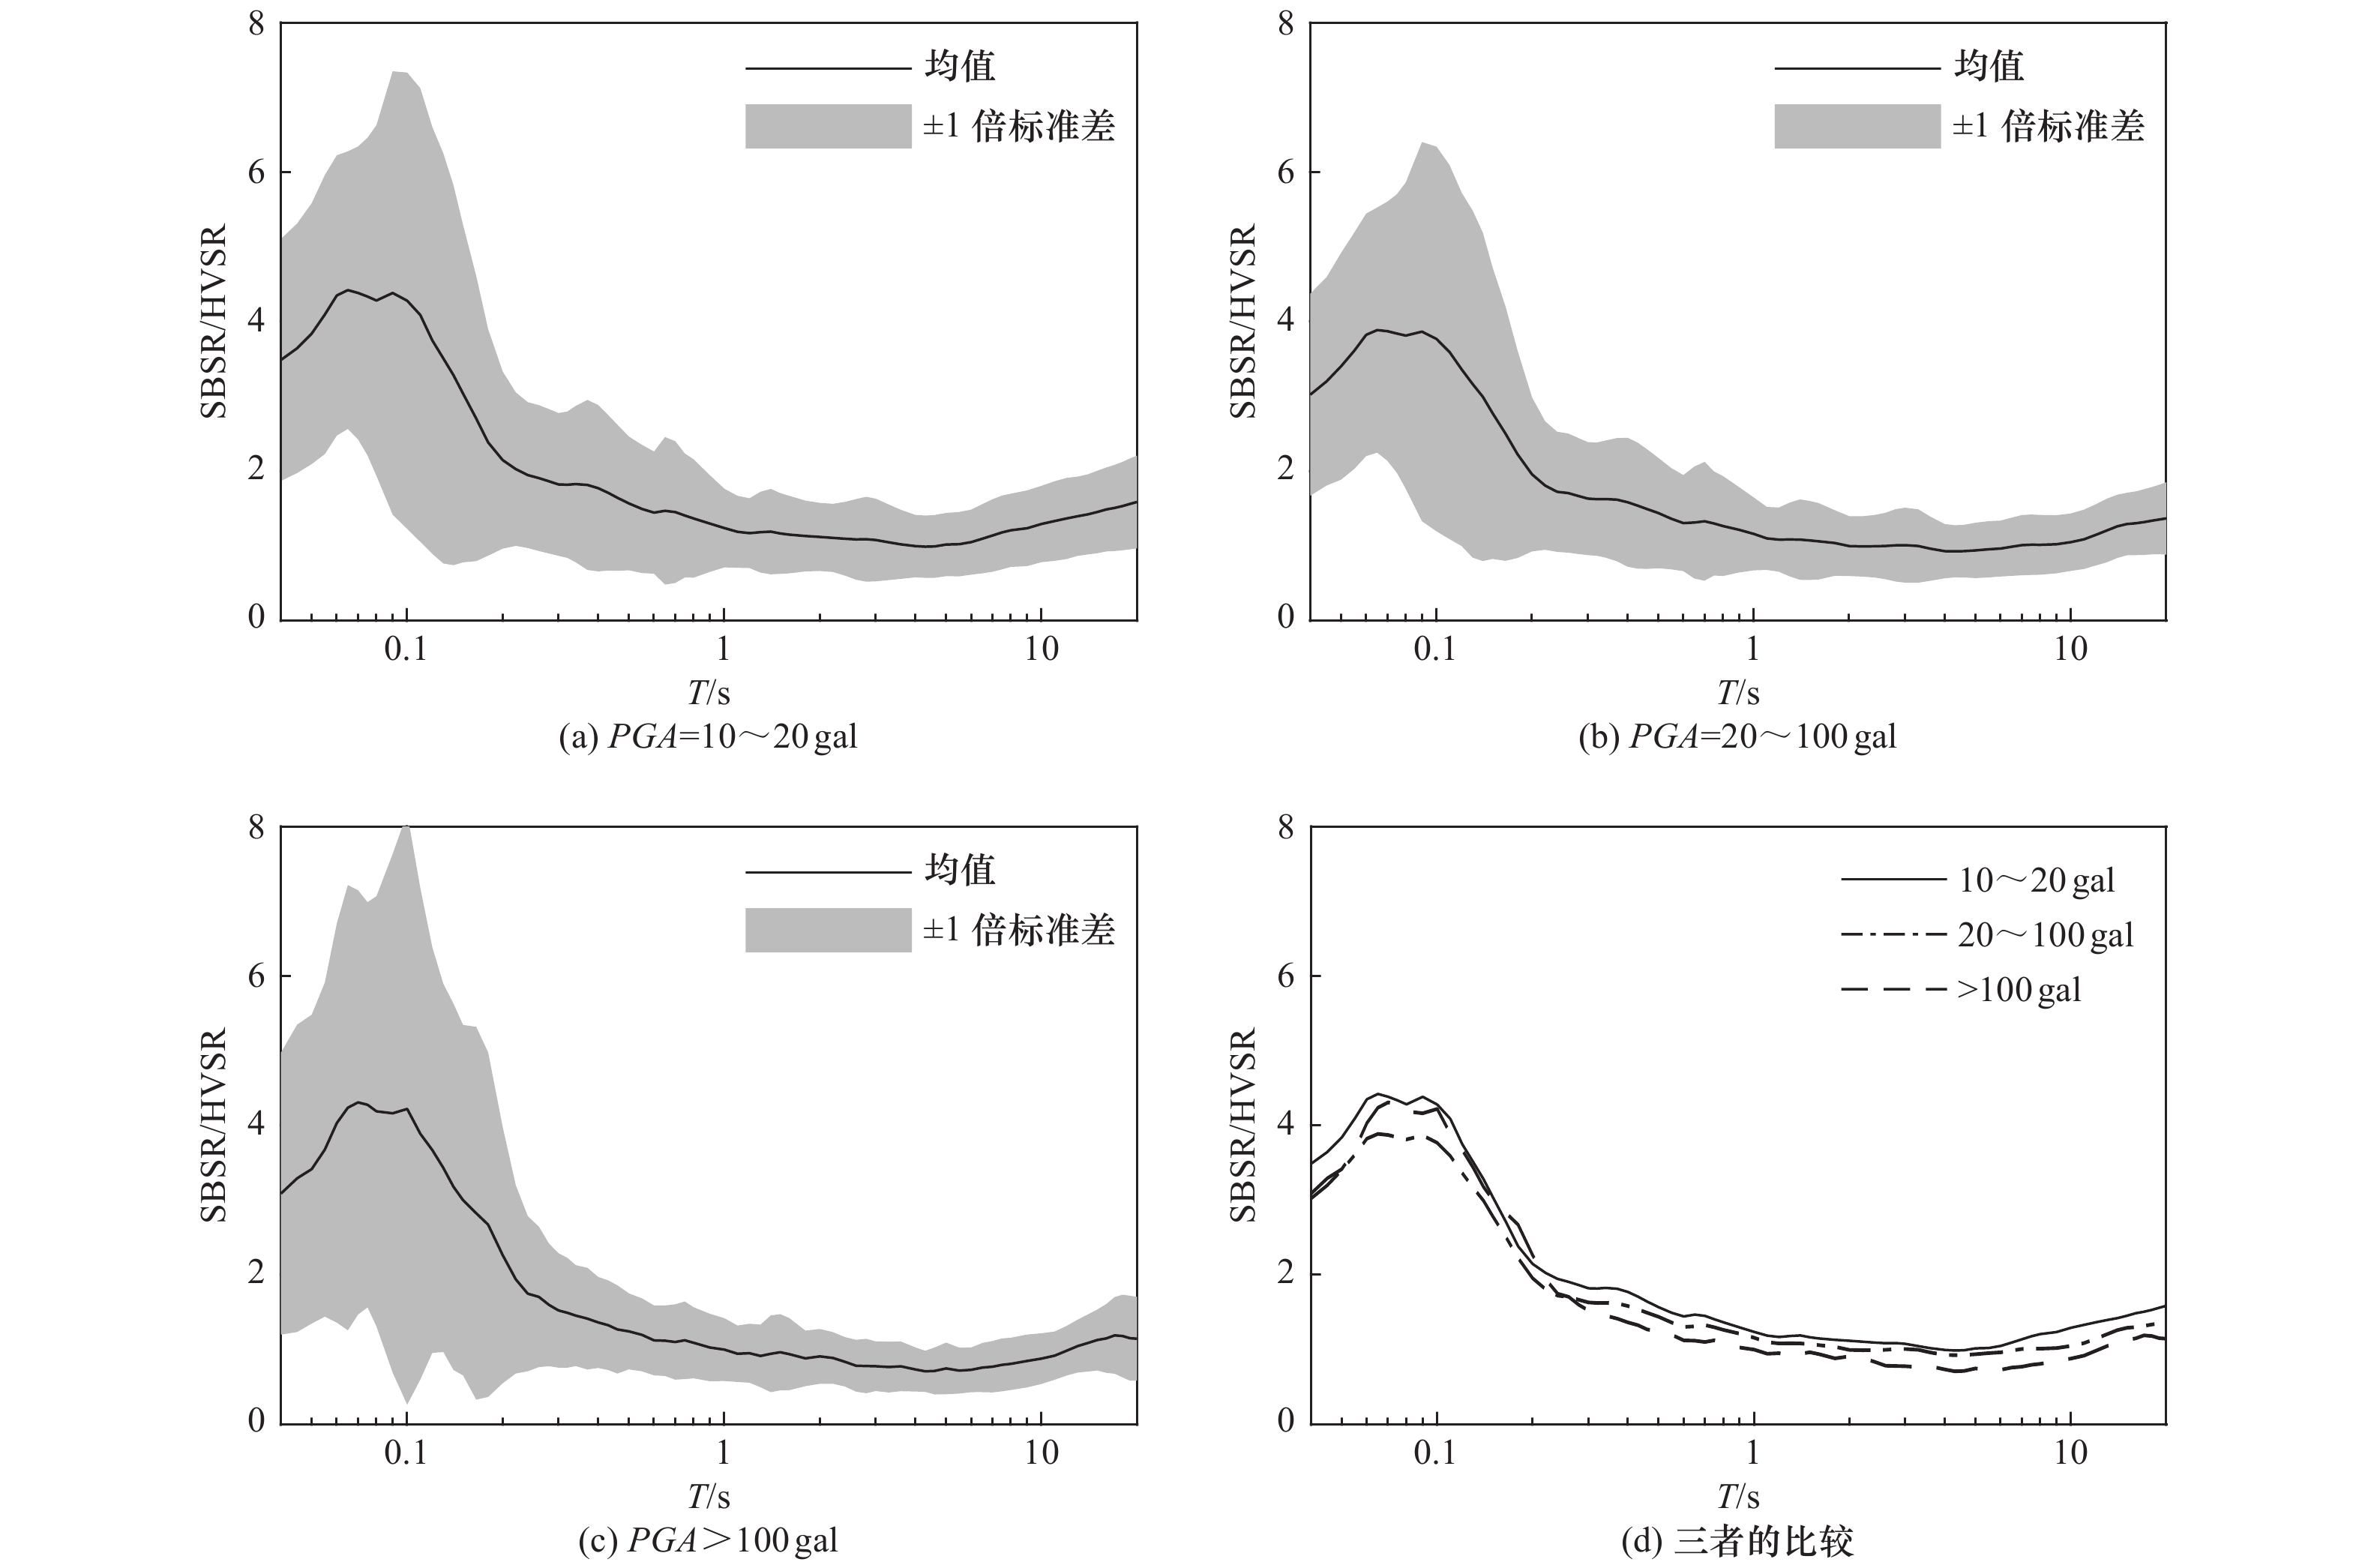
图 1 同一台站不同PGA分档地震动记录HVSR、SBSR及SBSR/HVSR平均值
Figure 1. The average value of SBSR, HVSR and SBSR/HVSR for strong-motion records with different PGA ranges at the same station
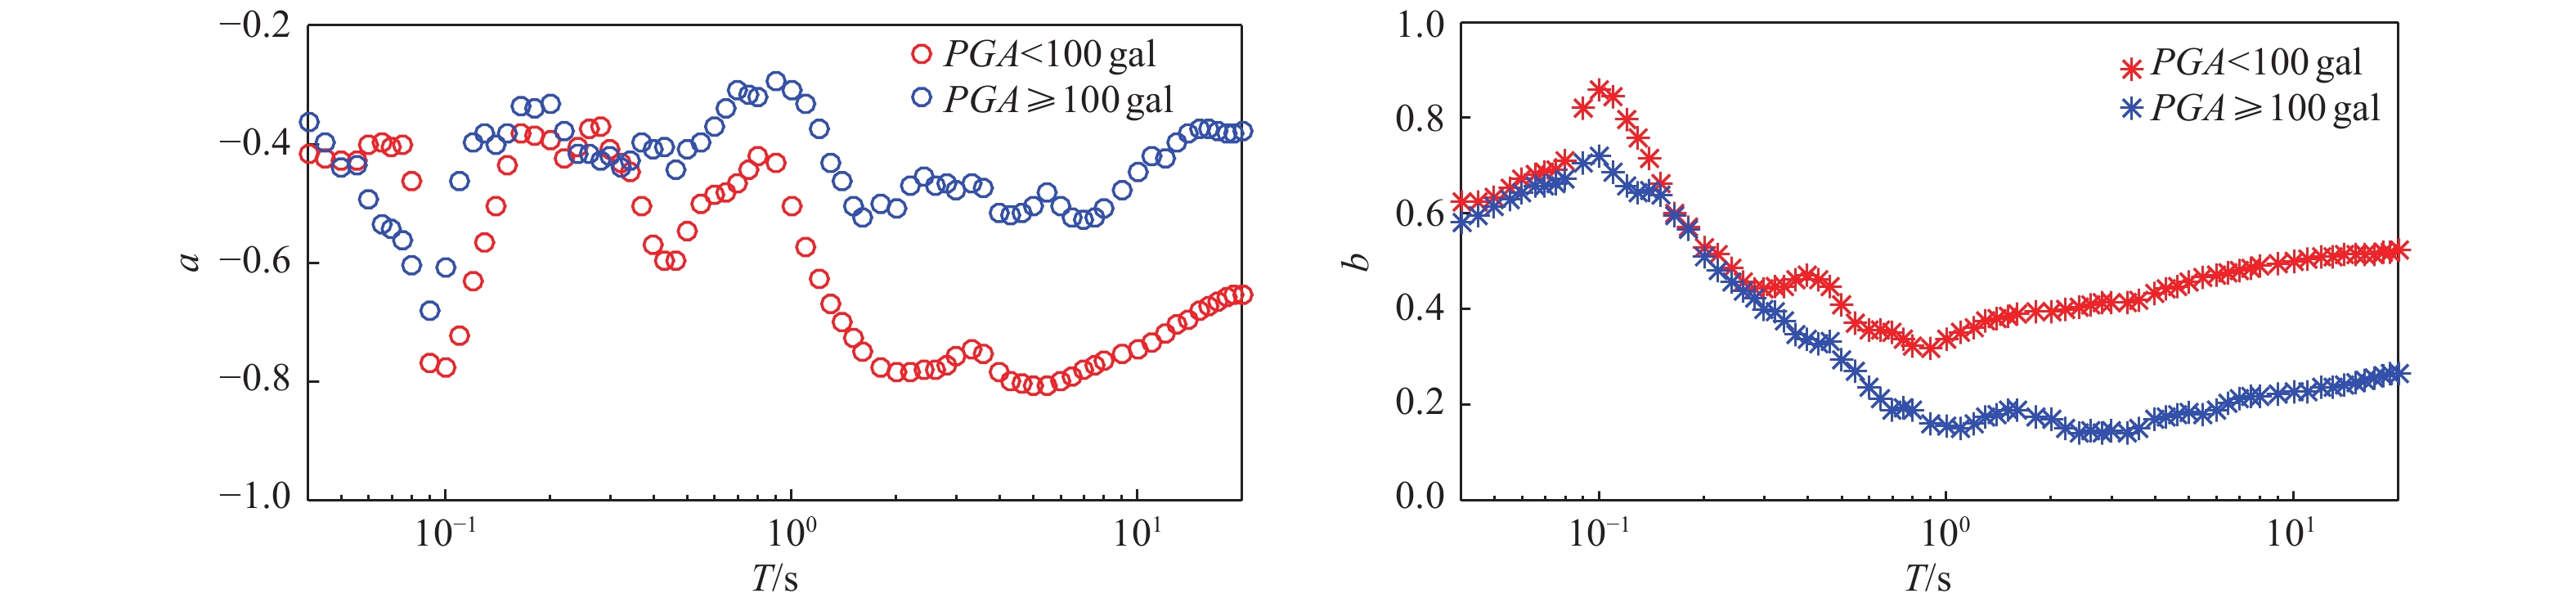
图 4 a和b随T变化分布
Figure 4. Variation of statistical values of parameters a and b with period T
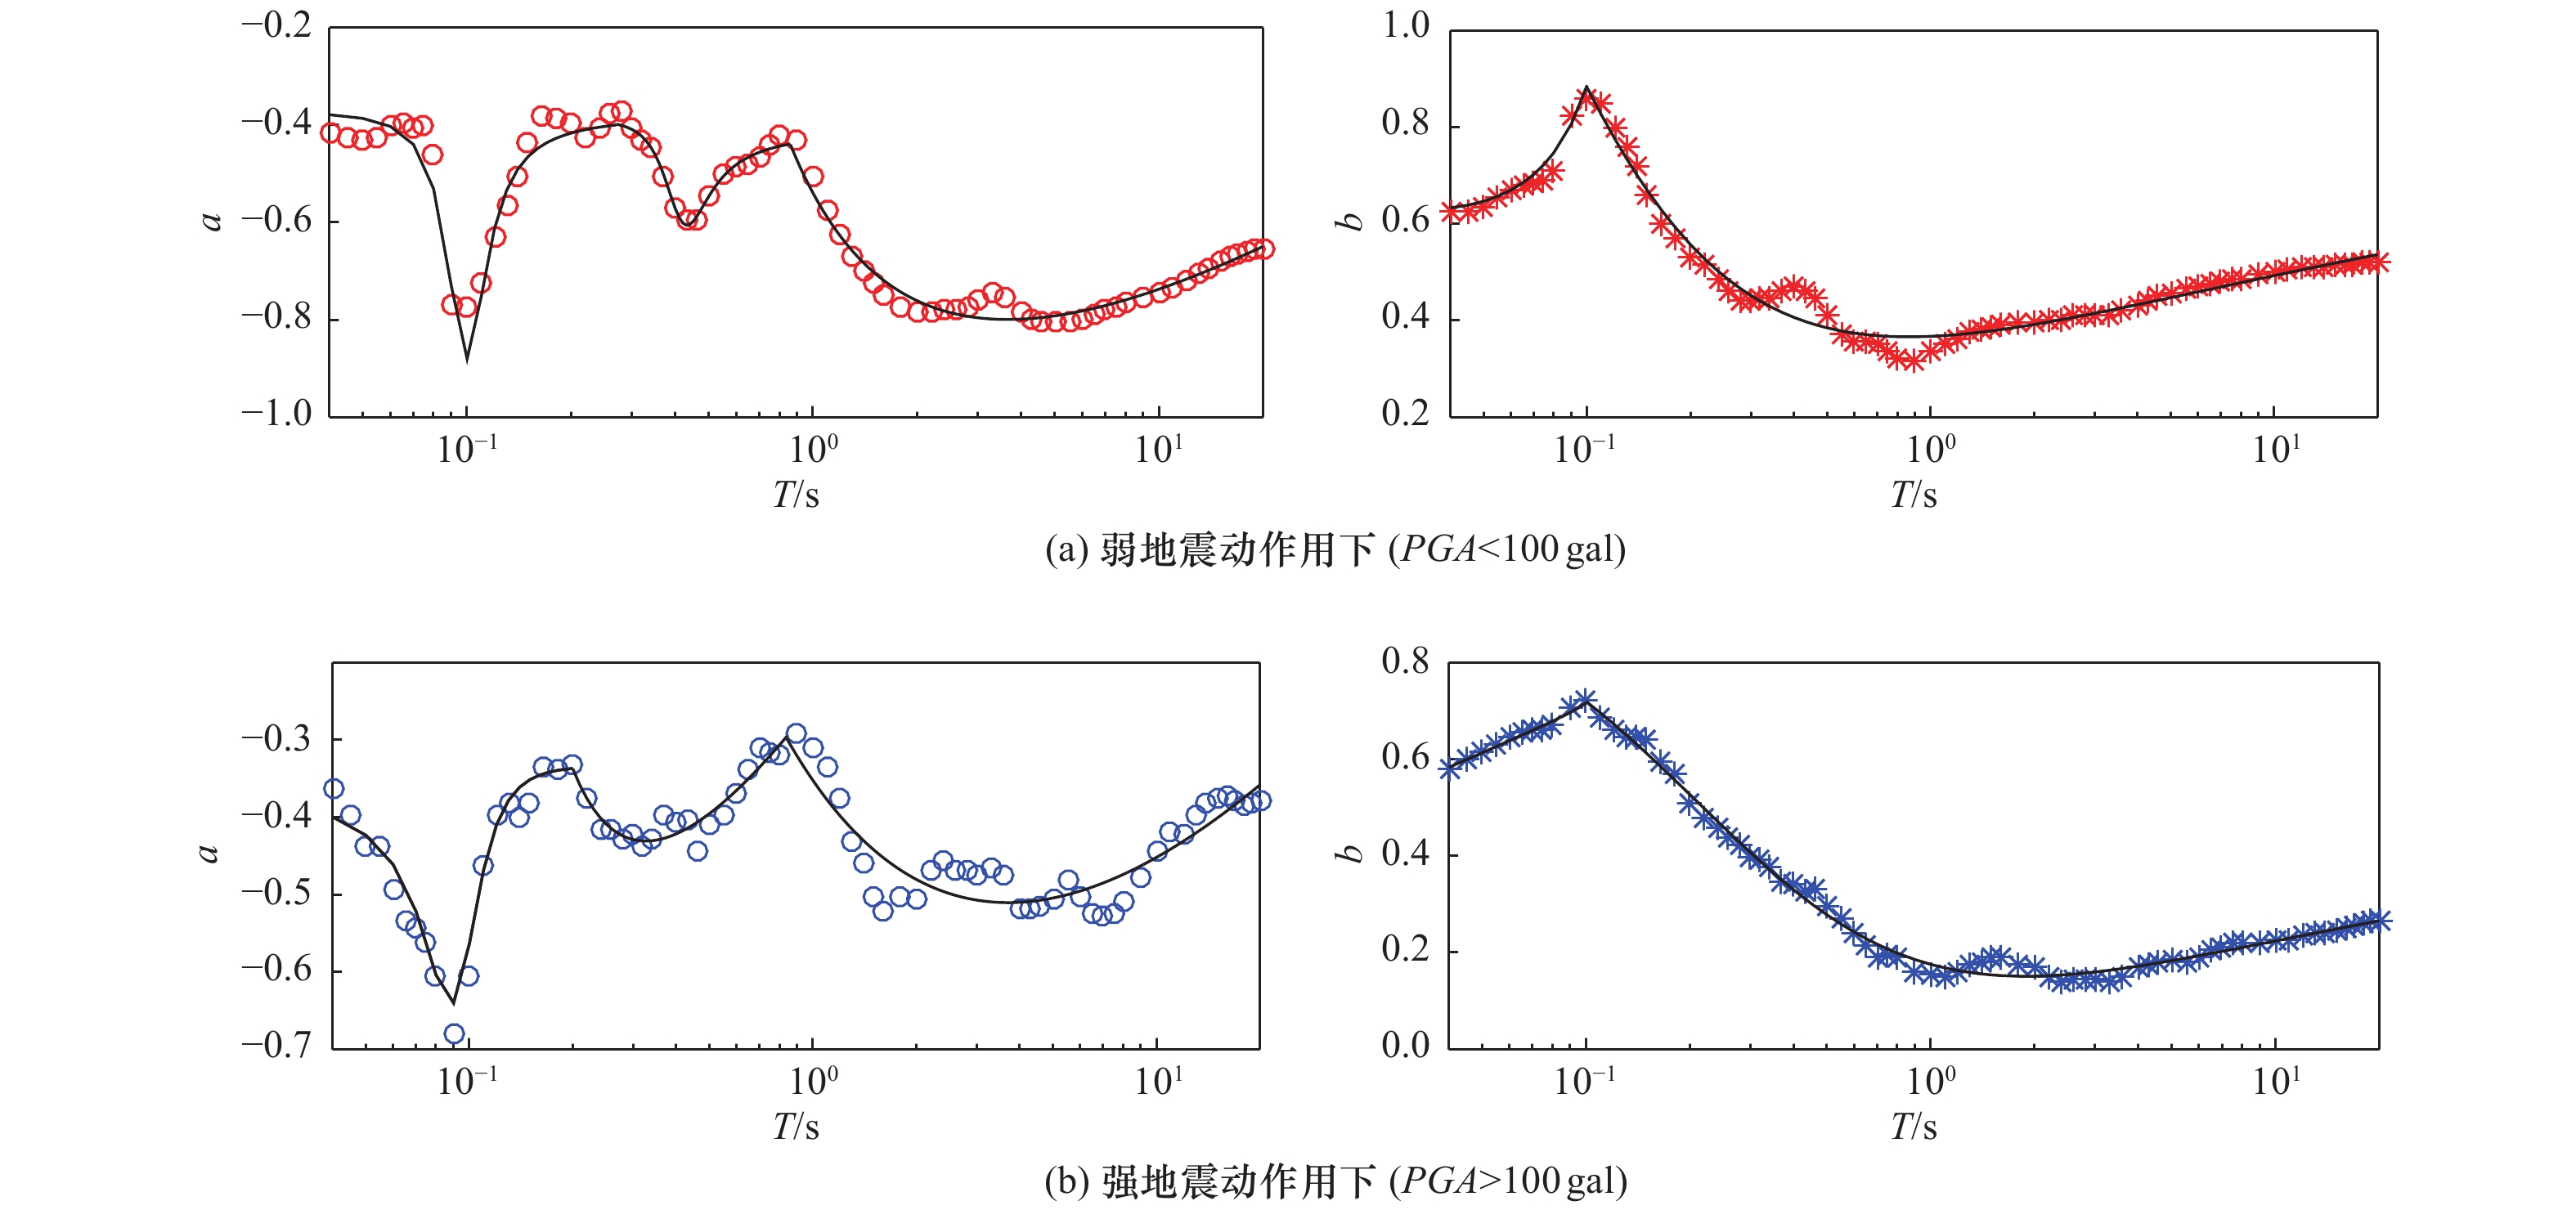
图 5 a和b模型拟合曲线
Figure 5. Regression curves of parameters a and b under different intensities of ground motion
表 1 选取台站及相关信息
Table 1. Selected stations and related information in this study
编号 台站代码 纬度N/° 经度E /° 钻井度/m VS,30/m·s−1 美国分类场地类别 日本分类场地类别 1 AKTH02 39.6634 140.5721 100 620.404 C SCⅠ 2 AKTH13 39.9819 140.4072 100 535.723 C SCⅠ 3 AOMH05 40.8564 141.1033 312 238.302 D SCⅢ 4 AOMH13 40.5794 141.4451 150 154.274 E SCⅣ 5 AOMH16 40.4624 141.0923 150 225.750 D SCⅣ 6 AOMH17 40.4624 141.3374 114 378.362 C SCⅡ 7 FKSH11 37.2006 140.3386 115 239.826 D SCⅢ 8 FKSH14 37.0264 140.9702 147 236.561 D SCⅣ 9 FKSH20 37.4911 140.9871 109 350.000 D SCⅣ 10 HDKH01 42.7031 142.2296 100 368.252 C SCⅡ 11 HDKH04 42.5126 142.0381 220 235.026 D SCⅣ 12 IBRH10 36.1112 139.9889 900 144.138 E SCⅣ 13 IBRH13 36.7955 140.5750 100 335.369 D SCⅡ 14 IBRH17 36.0864 140.3140 510 300.774 D SCⅣ 15 IBUH01 42.8739 141.8191 101 306.785 D SCⅣ 16 IWTH02 39.8250 141.3826 102 389.567 C SCⅡ 17 IWTH06 40.2611 141.1709 100 431.655 C SCⅡ 18 IWTH08 40.2686 141.7831 100 304.521 D SCⅢ 19 IWTH24 39.1979 141.0118 150 486.412 C SCⅣ 20 IWTH27 39.0307 141.532 100 670.313 C SCⅠ 21 KMMH01 33.1090 130.695 100 574.631 C SCⅠ 22 KSRH06 43.2200 144.4285 237 326.193 D SCⅣ 23 KSRH07 43.1359 144.3274 222 204.104 D SCⅣ 24 KSRH10 43.2084 145.1168 255 212.875 D SCⅣ 25 MYGH13 38.6990 141.4180 100 570.591 C SCⅠ 26 NIGH11 37.1728 138.7440 205 375.000 C SCⅣ 27 NMRH04 43.3978 145.1224 216 168.103 E SCⅣ 28 SMNH12 35.1634 132.8558 101 590.200 C SCⅠ 29 TCGH12 36.6959 139.9842 120 343.678 D SCⅣ 30 TKCH08 42.4865 143.1520 100 353.208 D SCⅣ  下载: 导出CSV
表 2 不同峰值加速度分组的地震动记录数量
Table 2. The number of strong-motion records in different PGA groups
场地类型 台站代码 PGA/gal 10~20 20~100 100~200 200~300 >300 C AKTH02 74 54 2 0 0 AKTH13 122 79 9 0 0 AOMH17 299 106 9 4 0 HDKH01 127 60 3 0 4 IWTH02 876 667 42 11 14 IWTH06 181 85 6 0 0 IWTH24 185 112 10 3 2 IWTH27 1079 504 31 8 8 KMMH01 99 39 6 2 0 MYGH13 675 311 13 1 2 NIGH11 146 110 9 3 3 SMNH12 52 52 6 4 0 D AOMH05 417 207 15 3 0 AOMH16 428 171 9 2 0 FKSH11 622 285 12 2 3 FKSH14 635 283 18 2 2 FKSH20 393 238 21 0 2 HDKH04 119 56 4 1 2 IBRH13 1175 732 79 23 33 IBRH17 796 424 21 2 3 IBUH01 317 136 10 3 4 IWTH08 423 182 13 0 2 KSRH06 349 155 3 1 8 KSRH07 286 149 8 1 4 KSRH10 273 174 11 3 5 TCGH12 680 338 6 0 2 TKCH08 197 117 10 0 1 E AOMH13 213 86 7 0 0 IBRH10 522 248 16 2 0 NMRH04 328 150 8 0 2
下载: 导出CSV
表 3 a和b模型系数取值
Table 3. Coefficient values of relation of parameters a and b with period T
参数 PGA/gal 周期T/s 回归系数 p1 p2 p3 q1 q2 q3 R a <100 [0.04,0.27] −0.376 −0.762 −0.391 1 2.014 1.019 0.902 [0.27,0.86] −0.404 −0.318 −0.067 1 0.768 0.154 0.957 [0.86,20.00] 0.538 −1.404 −0.354 0 1.000 0.656 0.952 ≥100 [0.04,0.20] −0.348 −0.707 −0.365 1 2.066 1.077 0.958 [0.20,0.84] 0.813 0.361 −0.277 0 1.000 1.090 0.874 [0.84,20.00] 0.879 −1.510 −0.634 0 1.000 1.799 0.789 b <100 [0.04,0.10] −0.250 −0.118 −0.072 0 1.000 0.763 0.962 [0.10,20.00] 1.124 1.103 1.114 1 2.745 3.032 0.966 ≥100 [0.04,0.10] 0.309 1.307 0.964 0 1.000 0.951 0.985 [0.10,20.00] 0.670 −0.117 0.282 1 1.120 1.607 0.992
下载: 导出CSV
-
[1] 郭明珠, 赵芳, 赵凤仙, 2013. 场地地震动局部地形效应研究进展. 震灾防御技术, 8(3): 311-318. doi: 10.3969/j.issn.1673-5722.2013.03.010Guo M. Z., Zhao F., Zhao F. X., 2013. A review of the effect of small-scale surface topography on ground motions. Technology for Earthquake Disaster Prevention, 8(3): 311-388. (in Chinese) doi: 10.3969/j.issn.1673-5722.2013.03.010 [2] 黄雅虹, 吕悦军, 彭艳菊, 2009. 国内外不同抗震设计规范中场地分类方法的内在关系研究. 震灾防御技术, 4(1): 80-90. doi: 10.3969/j.issn.1673-5722.2009.01.008Huang Y. H., Lu Y. J., Peng Y. J., 2009. Study on the relations of site classification methods in seismic design standards between china and abroad. Technology for Earthquake Disaster Prevention, 4(1): 80-90. (in Chinese) doi: 10.3969/j.issn.1673-5722.2009.01.008 [3] 李小军, 1992. 场地土层对地震地面运动影响的分析方法. 世界地震工程, 8(2): 49-60. [4] 李小军, 彭青, 2001. 不同类别场地地震动参数的计算分析. 地震工程与工程振动, 21(1): 29-36. doi: 10.3969/j.issn.1000-1301.2001.01.005Li X. J., Pen Q., 2001. Calculation and analysis of earthquake ground motion parameters for different site categories. Earthquake Engineering and Engineering Vibration, 21(1): 29-36. (in Chinese) doi: 10.3969/j.issn.1000-1301.2001.01.005 [5] 李小军, 2013. 地震动参数区划图场地条件影响调整. 岩土工程学报, 35(S2): 21-29.LI X. J., 2013. Adjustment of seismic ground motion parameters considering site effects in seismic zonation map. Chinese Journal of Geotechnical Engineering, 35(S2): 21-29. (in Chinese) [6] 吕悦军, 彭艳菊, 兰景岩等, 2008. 场地条件对地震动参数影响的关键问题. 震灾防御技术, 3(2): l26-l35. doi: 10.3969/j.issn.1673-5722.2008.02.003Lu Y. J., Peng Y. J., Lan J. Y., et al., 2008. Some key problems about site effects on seismic ground motion parameters. Technology for Earthquake Disaster Prevention, 3(2): 126-135. (in Chinese) doi: 10.3969/j.issn.1673-5722.2008.02.003 [7] 荣棉水, 李小军, 王振明等, 2016. HVSR方法用于地震作用下场地效应分析的适用性研究. 地球物理学报, 59(8): 2878-2891. doi: 10.6038/cjg20160814Rong M. S., Li X. J., Wang Z. M., et al., 2016. Applicability of HVSR in analysis of site-effects caused by earthquakes. Chinese Journal of Geophysics, 59(8): 2878-2891. (in Chinese) doi: 10.6038/cjg20160814 [8] 中华人民共和国住房和城乡建设部, 中华人民共和国国家质量监督检验检疫总局, 2010. GB 50011—2010 建筑抗震设计规范(2016年版). 北京: 中国建筑工业出版社.Ministry of Housing and Urban-Rural Development of the People’s Republic of China, General Administration of Quality Supervision, Inspection and Quarantine of the People’s Republic of China, 2010. GB 50011—2010 Code for seismic design of buildings (2016 Edition). Beijing: China Architecture and Building Press. (in Chinese) [9] Baise L. G., 2000. Investigations in site response from ground motion observations in vertical arrays. Berkeley: University of California. [10] Borcherdt R. D., 1970. Effects of local geology on ground motion near San Francisco Bay. Bulletin of the Seismological Society of America, 60(1): 29-61. [11] Borcherdt R. D., Gibbs J. F., 1976. Effects of local geological conditions in the San Francisco Bay region on ground motions and the intensities of the 1906 earthquake. Bulletin of the Seismological Society of America, 66(2): 467-500. [12] Building Seismic Safety Council, 2004. 2003 Edition NEHPR recommended provisions for seismic regulations for new buildings and other structures (FEMA 450), Part 1(Provisions). Washington D C: Building Seismic Safety Council, National Institute of Building Sciences, 19-45. [13] Chen Q. F., Liu L. B., Wang W. J., et al., 2009. Site effects on earthquake ground motion based on microtremor measurements for metropolitan Beijing. Chinese Science Bulletin, 54(2): 280-287. [14] Fukushima Y., Bonilla L. F., Scotti O., et al., 2007. Site classification using horizontal-to-vertical response spectral ratios and its impact when deriving empirical ground-motion prediction equations. Journal of Earthquake Engineering, 11(5): 712-724. doi: 10.1080/13632460701457116 [15] Hwang H. H. M., Lin H. J., Huo J. R., 1997. Site coefficients for design of buildings in eastern United States. Soil Dynamics and Earthquake Engineering, 16(1): 29-40. doi: 10.1016/S0267-7261(96)00031-0 [16] Kawase H., Sánchez-Sesma F. J., Matsushima S., 2011. The optimal use of horizontal-to-vertical spectral ratios of earthquake motions for velocity inversions based on diffuse-field theory for plane waves. Bulletin of the Seismological Society of America, 101(5): 2001-2004. doi: 10.1785/0120100263 [17] Konno K., Ohmachi T., 1998. Ground-motion characteristics estimated from spectral ratio between horizontal and vertical components of microtremor. Bulletin of the Seismological Society of America, 88(1): 228-241. [18] Lee C. T., Cheng C. T., Liao C. W., et al., 2001. Site classification of Taiwan free-field strong-motion stations. Bulletin of the Seismological Society of America, 91(5): 1283-1297. [19] Lermo J., Chávez-García F. J., 1993. Site effect evaluation using spectral ratios with only one station. Bulletin of the Seismological Society of America, 83(5): 1574-1594. [20] Li X. J., Jing B. B., Liu C., et al., 2019. Site classification method based on geomorphological and geological characteristics and its application in China. Bulletin of the Seismological Society of America, 109(5): 1843-1854. doi: 10.1785/0120190058 [21] Liu H. X., 2002. The great Tangshan earthquake of 1976. California: Earthquake Engineering Research Laboratory, California Institute of Technology, 171-338. [22] Nagashima F., Matsushima S., Kawase H., et al., 2014. Application of horizontal‐to‐vertical spectral ratios of earthquake ground motions to identify subsurface structures at and around the K‐NET site in Tohoku, Japan. Bulletin of the Seismological Society of America, 104(5): 2288-2302. doi: 10.1785/0120130219 [23] Nakamura Y., 1989. A method for dynamic characteristics estimation of subsurface using microtremor on the ground surface. Quarterly Report of the Railway Technical Research Institute, 30(1): 25-33. [24] Pitilakis K., Riga E., Anastasiadis A., 2013. New code site classification, amplification factors and normalized response spectra based on a worldwide ground-motion database. Bulletin of Earthquake Engineering, 11(4): 925-966. doi: 10.1007/s10518-013-9429-4 [25] Régnier J., Cadet H., Bonilla L. F., et al., 2013. Assessing nonlinear behavior of soils in seismic site response: statistical analysis on KiK-net strong-motion data. Bulletin of the Seismological Society of America, 103(3): 1750-1770. doi: 10.1785/0120120240 [26] Seed H. B., Ugas C., Lysmer J., 1976a. Site-dependent spectra for earthquake-resistant design. Bulletin of the Seismological Society of America, 66(1): 221-243. [27] Seed H. B., Murarka R., Lysmer J., et al., 1976b. Relationships of maximum acceleration, maximum velocity, distance from source, and local site conditions for moderately strong earthquakes. Bulletin of the Seismological Society of America, 66(4): 1323-1342. [28] Seed H. B., Romo M. P., Sun J. I., et al., 1988. The Mexico earthquake of September 19, 1985-relationships between soil conditions and earthquake ground motions. Earthquake Spectra, 4(4): 687-729. doi: 10.1193/1.1585498 [29] Wen K. L., Beresnev I. A., Yeh Y. T., 1994. Nonlinear soil amplification inferred from downhole strong seismic motion data. Geophysical Research Letters, 21(24): 2625-2628. doi: 10.1029/94GL02407 [30] Wen K. L., Beresnev I. A., Yeh Y. T., 1995. Investigation of non-linear site amplification at two downhole strong ground motion arrays in Taiwan. Earthquake Engineering & Structural Dynamics, 24(3): 313-324. [31] Wen R. Z., Ren Y. F., Zhou Z. H., et al., 2010. Preliminary site classification of free-field strong motion stations based on Wenchuan earthquake records. Earthquake Science, 23(1): 101-110. doi: 10.1007/s11589-009-0048-8 [32] Wood H. O., 1908. Distribution of apparent intensity in San Francisco. In: The California Earthquake of April 18, 1906, Report of the State Earthquake Investigation Commission. Washington DC: Carnegie Institution of Washington. [33] Yamazaki F., Ansary M. A., 1997. Horizontal-to-vertical spectrum ratio of earthquake ground motion for site characterization. Earthquake Engineering & Structural Dynamics, 26(7): 671-689. [34] Zhang X. L., Peng X. B., Li X. J., et al., 2020. Seismic effects of a small sedimentary basin in the eastern Tibetan plateau based on numerical simulation and ground motion records from aftershocks of the 2008 Mw7.9 Wenchuan, China earthquake. Journal of Asian Earth Sciences, 192: 104257. doi: 10.1016/j.jseaes.2020.104257 [35] Zhao J. X., Irikura K., Zhang J., et al., 2006. An empirical site-classification method for strong-motion stations in Japan using H/V response spectral ratio. Bulletin of the Seismological Society of America, 96(3): 914-925. doi: 10.1785/0120050124 -

 点击查看大图
计量
- 文章访问数: 425
- HTML全文浏览量: 51
- PDF下载量: 63
- 被引次数: 0
