
Study on the Long-period Ground Motion Predicting Model for Interface and Intraslab Earthquakes in Subduction Zone
-
摘要: 对海域地震区划中涉及的我国海域有影响的俯冲带地震动参数预测模型研究进展与阶段性成果进行介绍,基于资料、回归方法等,对地震动参数预测模型建立过程进行说明。依托可靠的强震加速度记录与宽频带速度记录,采用使结果更稳定的分步回归方法,考虑俯冲带深大地震断层尺度与震源深度影响选取新的预测模型。针对我国海域实际地震环境,新的预测模型重点关注了对俯冲带长周期地震动的估计。Abstract: The progress and periodical result for establishing ground motion predicting model for subduction earthquakes of China sea area is introduced. The developing procedures are briefly summarized through ground motion data, attenuation model and regression strategy. The study is based on reliable strong motion acceleration records and broad-band velocity data, using a more robust step-regression approach, and with a model considering both rupture scale and focal depth of subduction earthquakes. Special attention is fixed on the long-period spectral predicting base on the realistic earthquake situation for China sea area.
-
Key words:
- Sea area /
- Seismic hazard map /
- Ground motion predicting model /
- Response spectral /
- Long-period
-
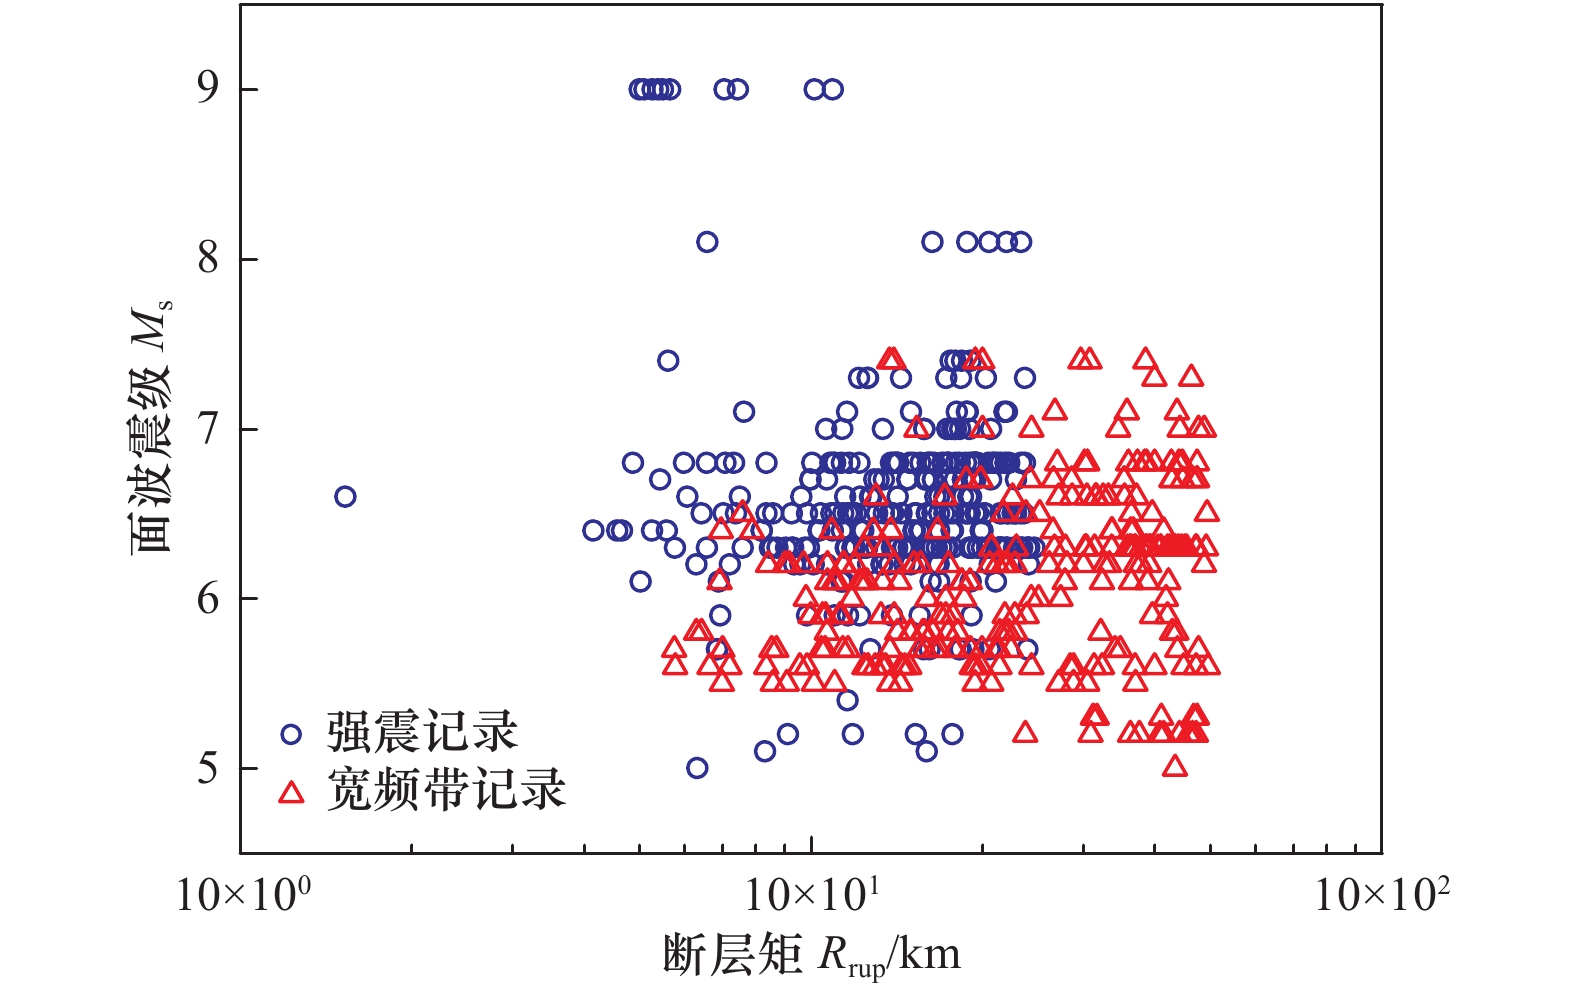
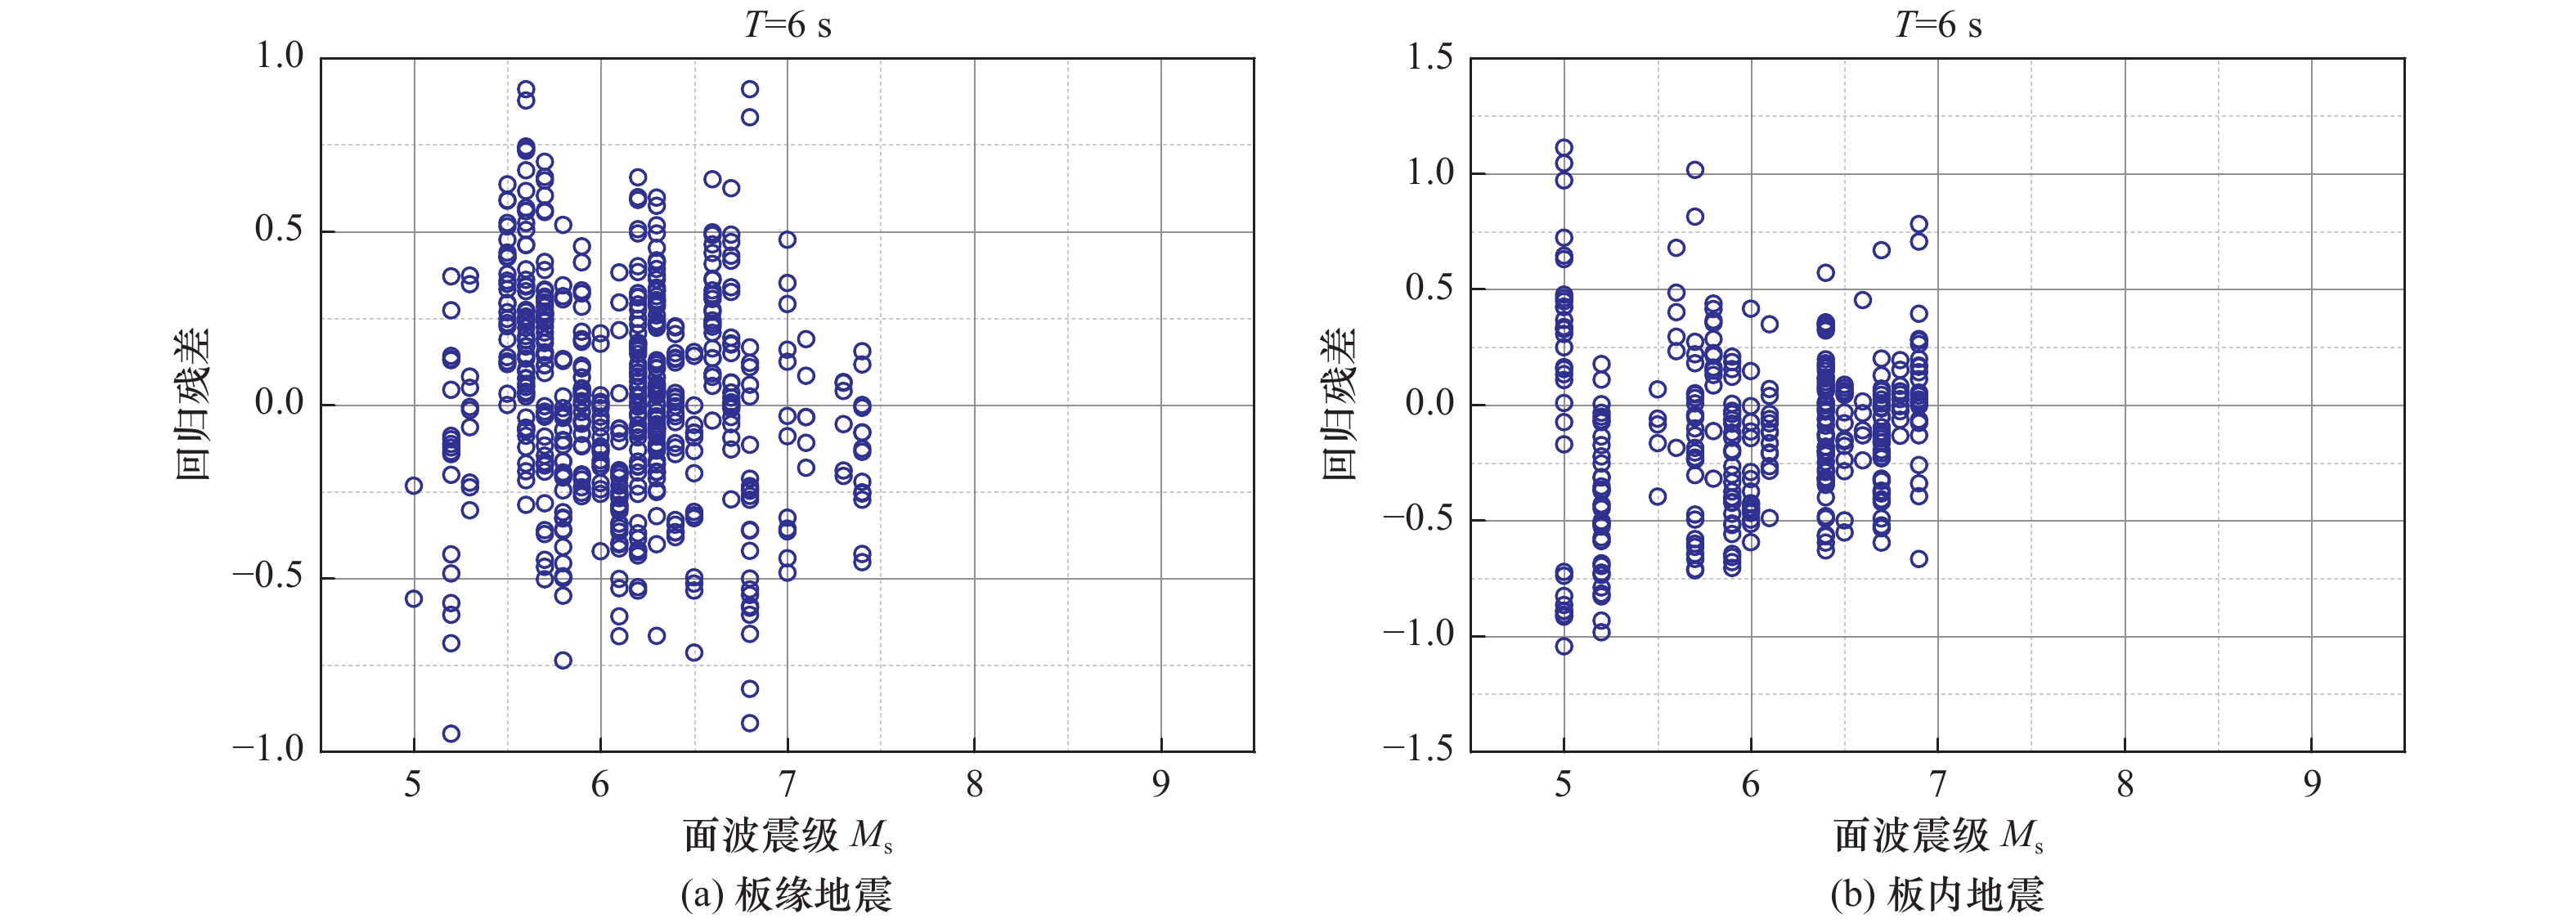
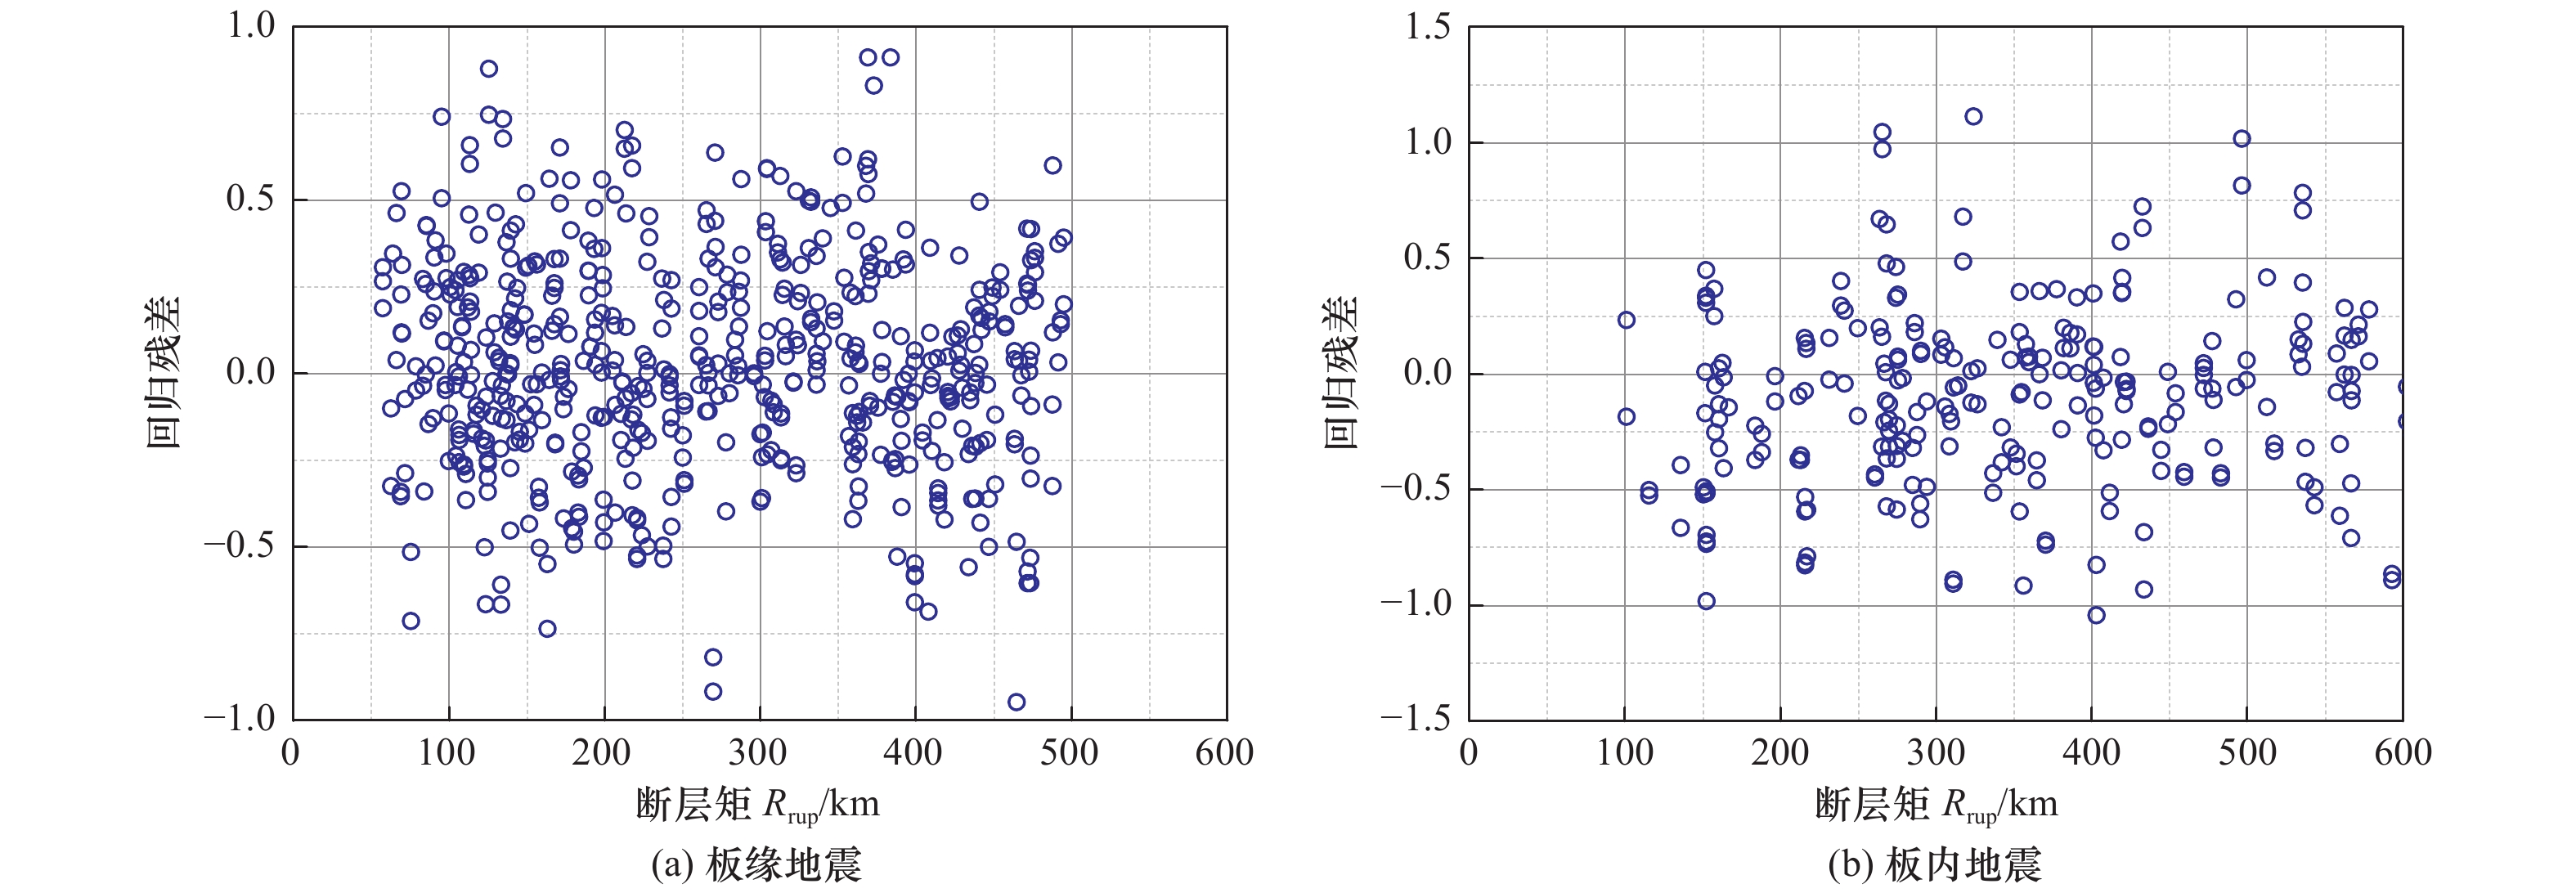
图 2 板缘地震记录震级-断层距分布关系图
Figure 2. Distribution of magnitude-distance of interface earthquakes
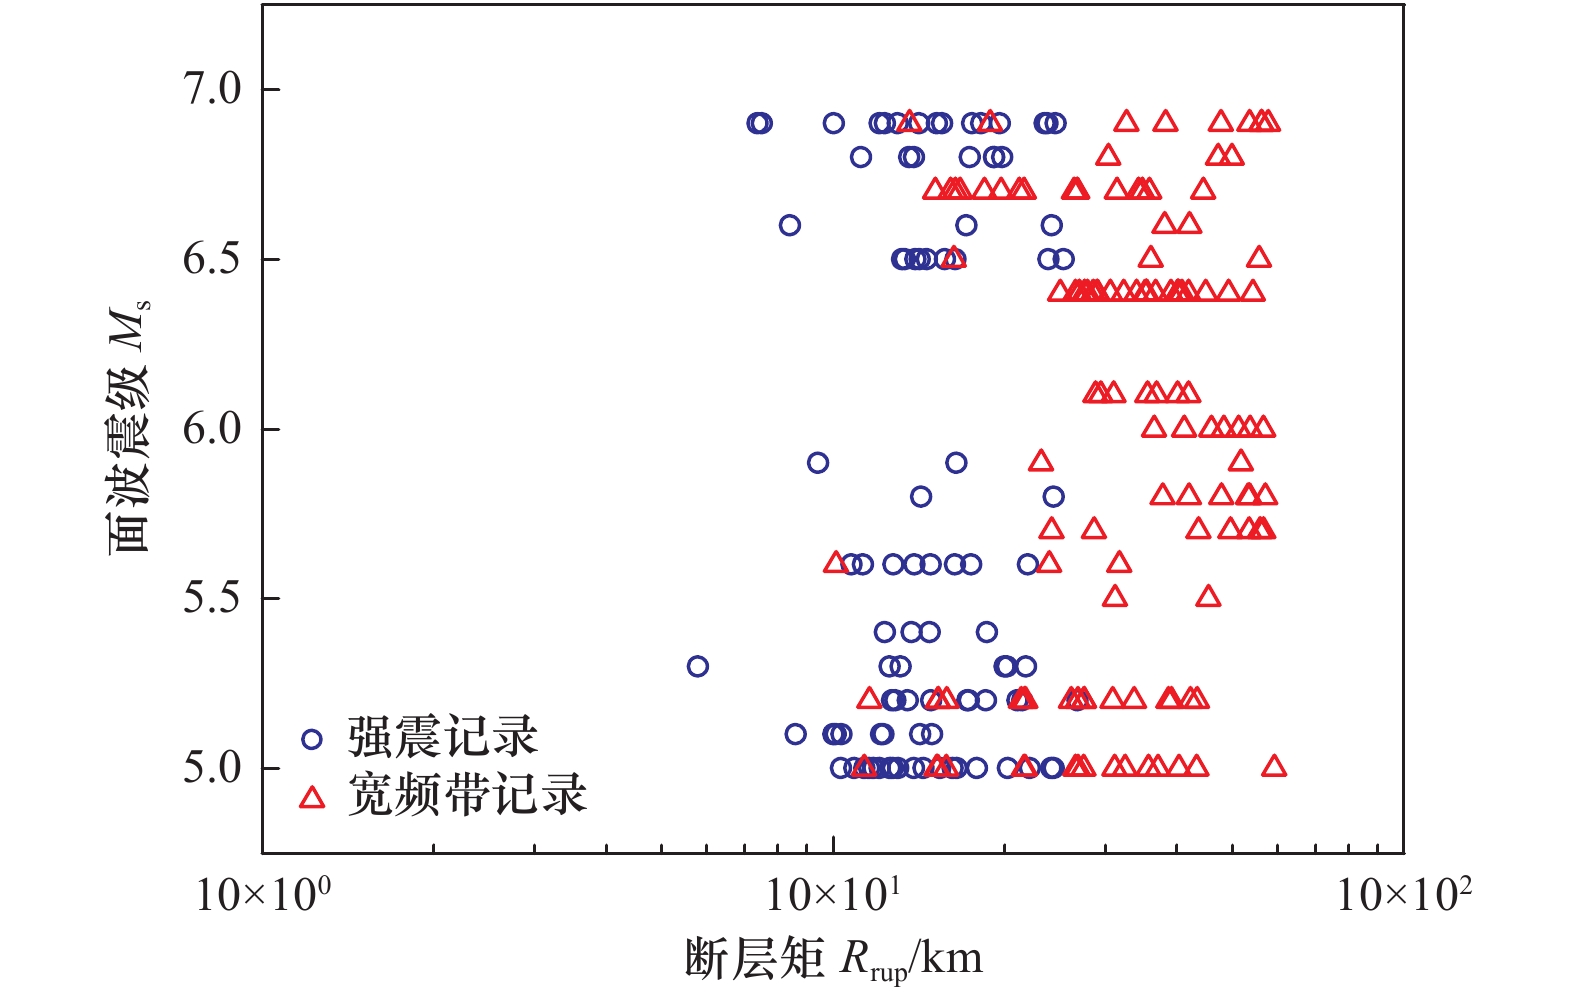
图 3 板内地震记录震级-断层距分布关系图
Figure 3. Distribution of magnitude-distance of intraslab earthquakes
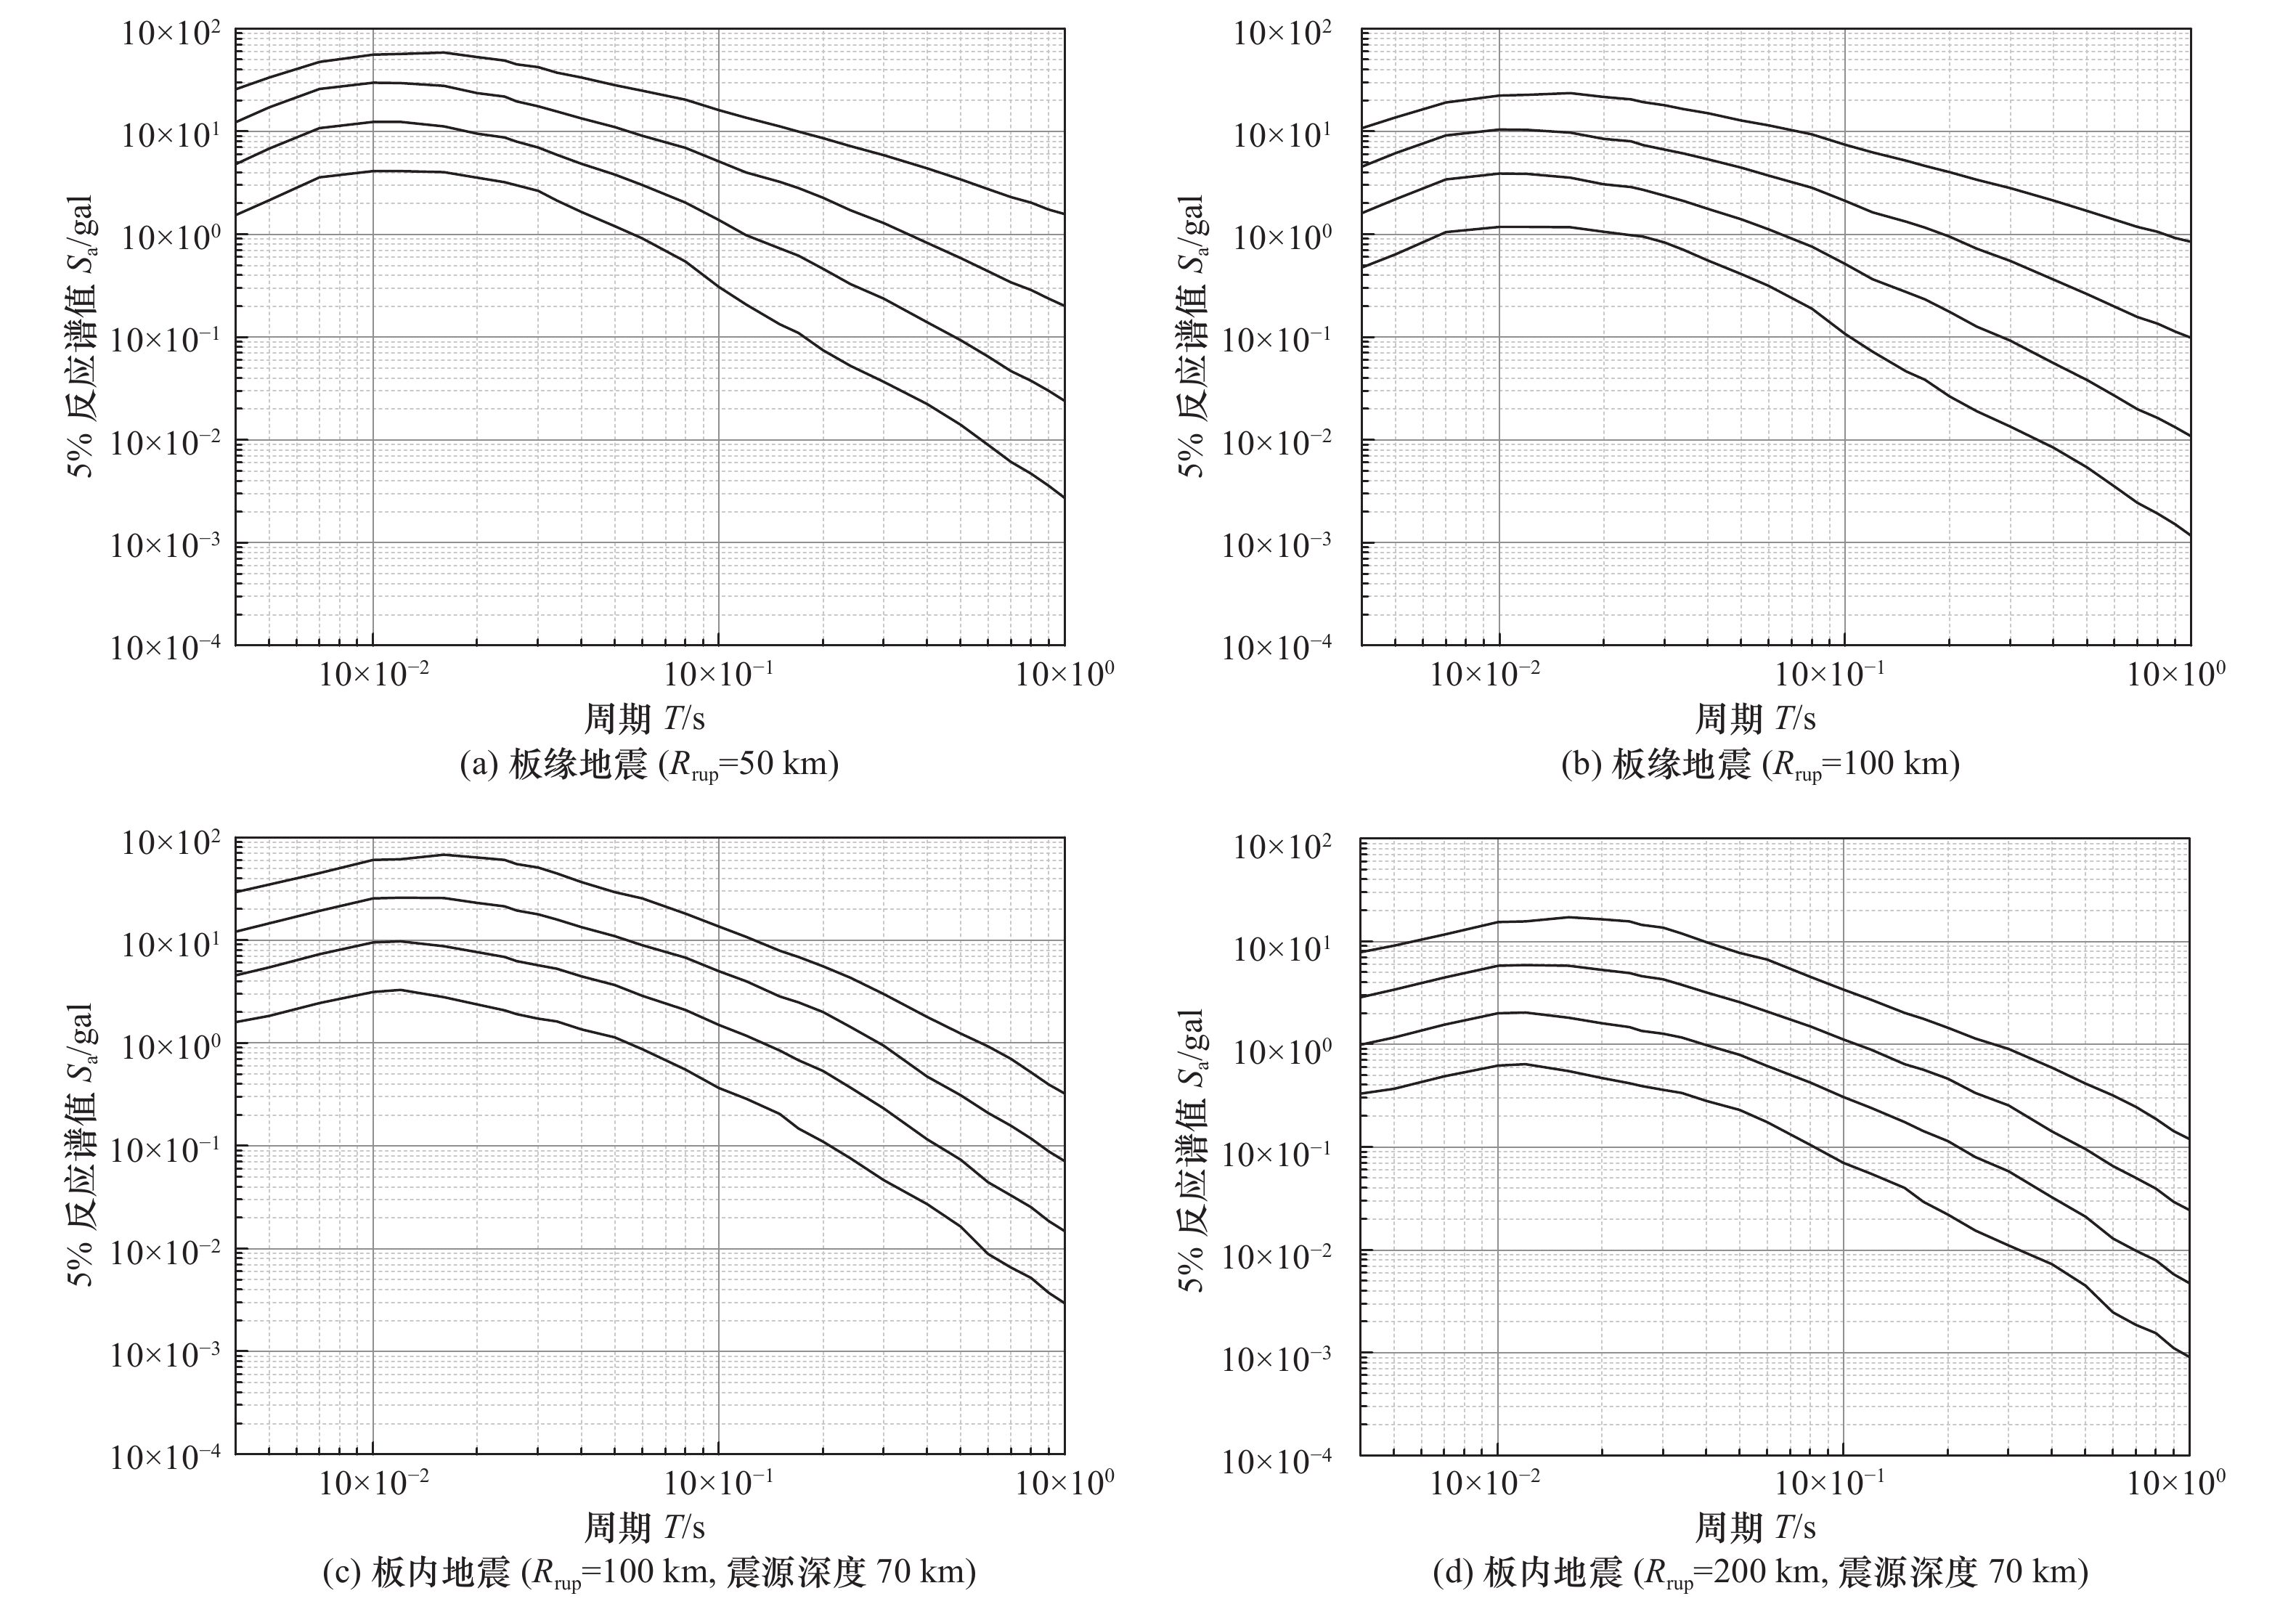
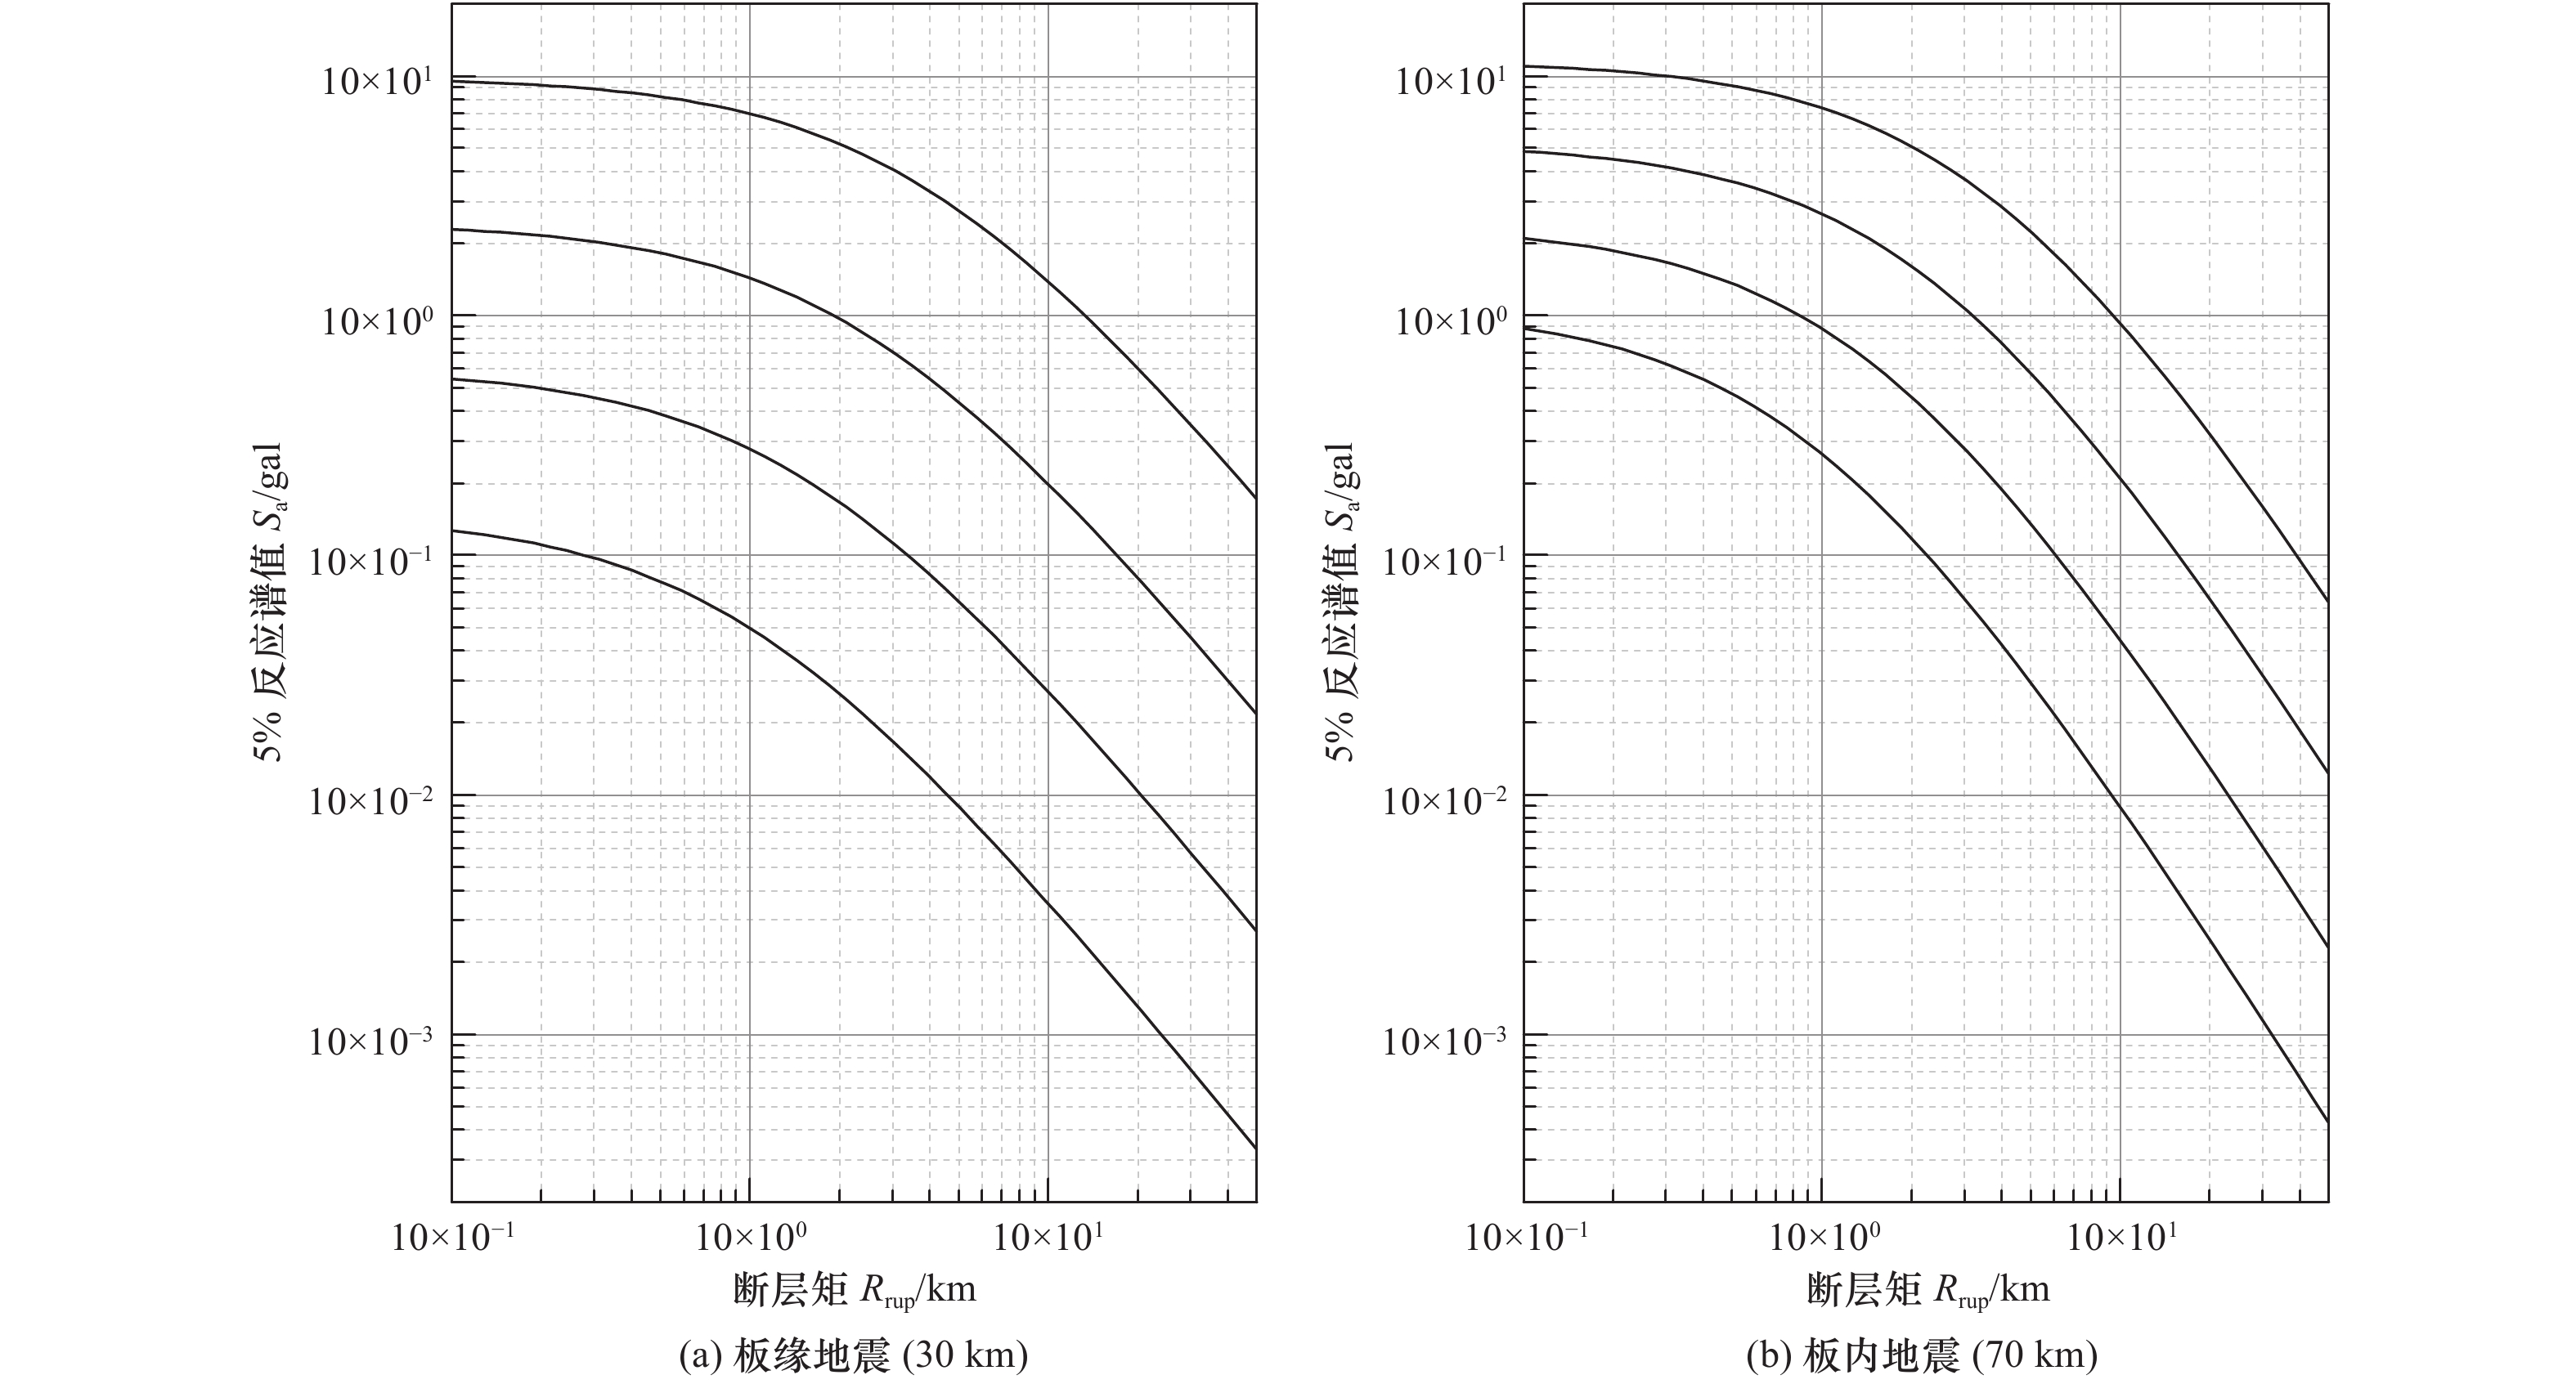
图 4 基岩水平向加速度反应谱曲线
Figure 4. Spectral acceleration curves for horizontal rock ground motion
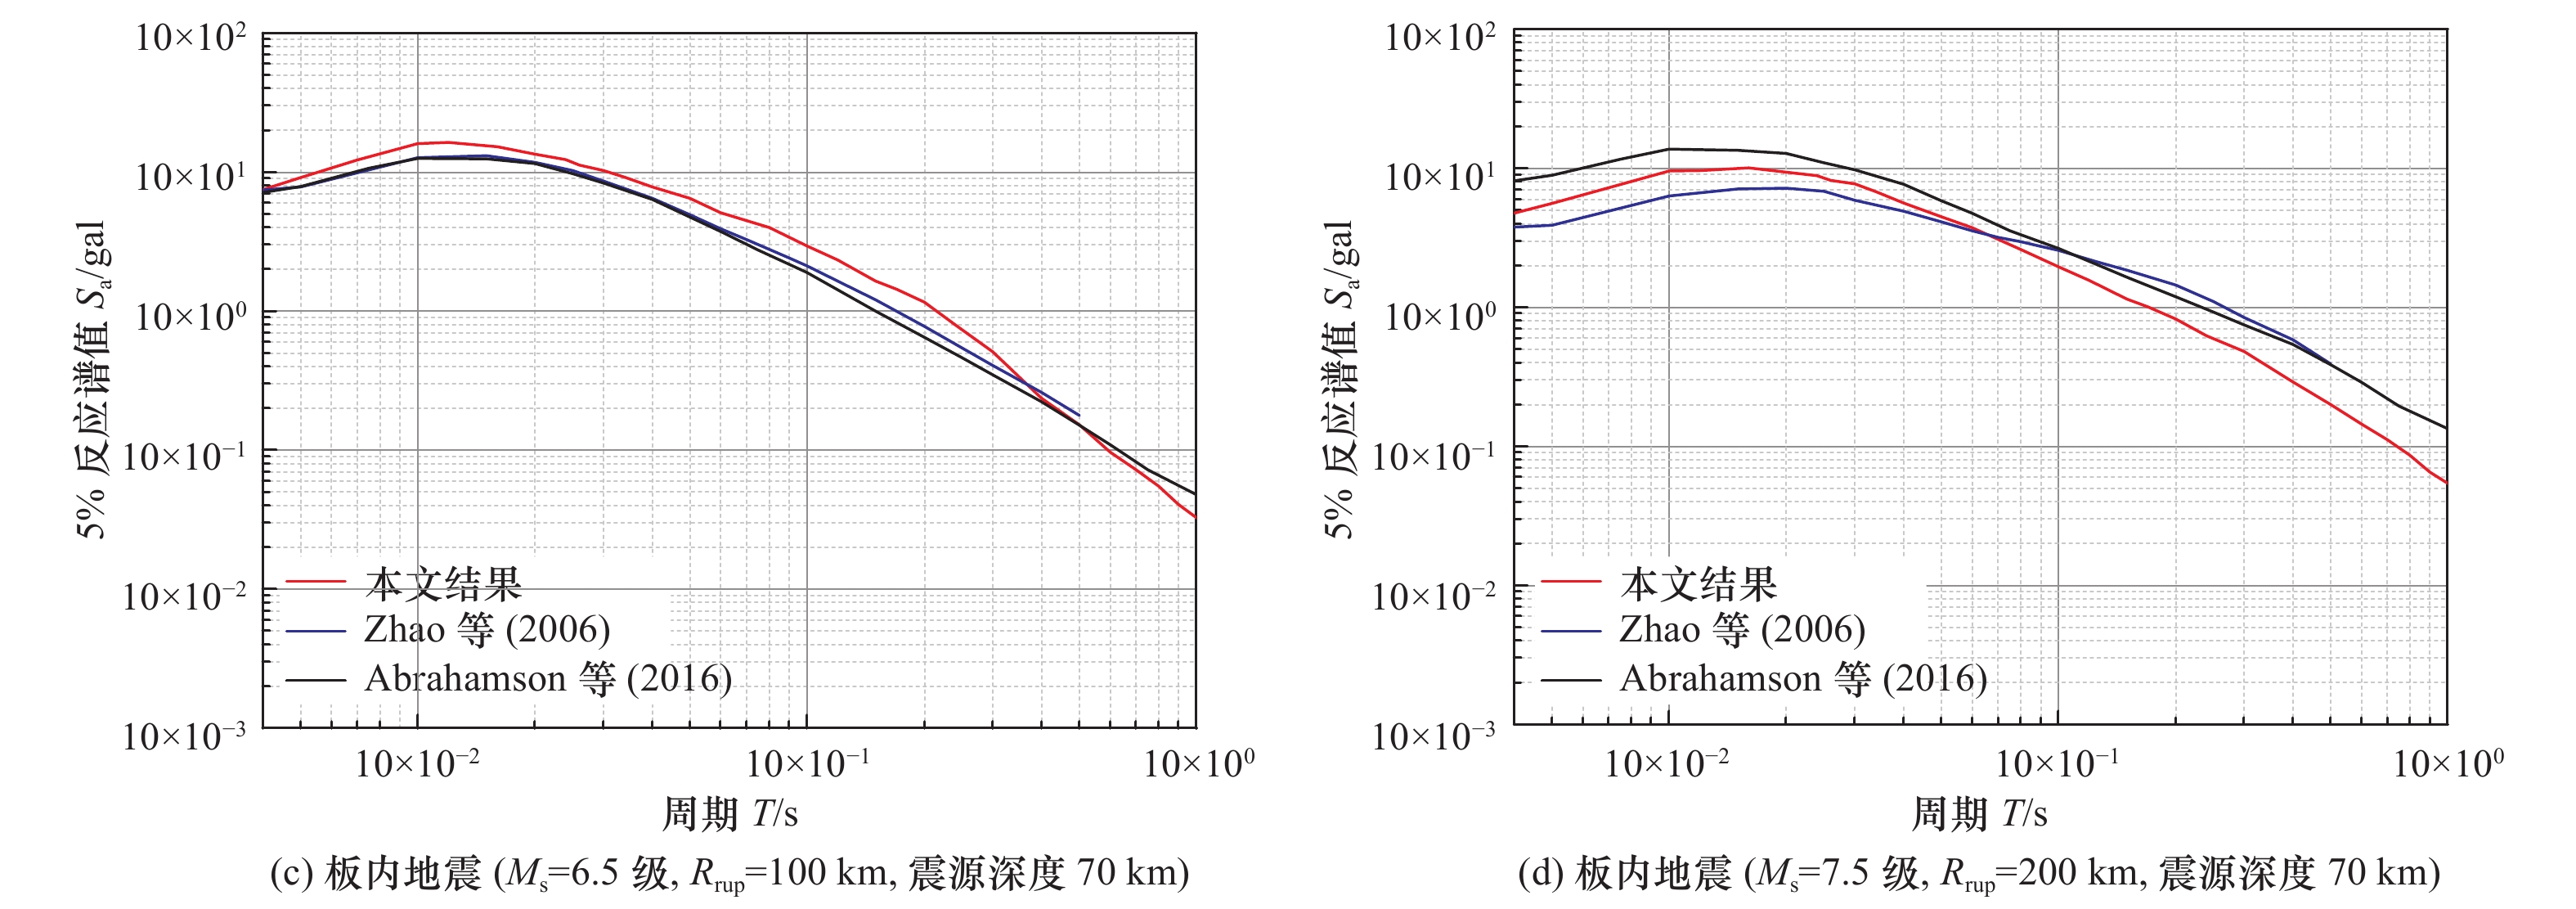
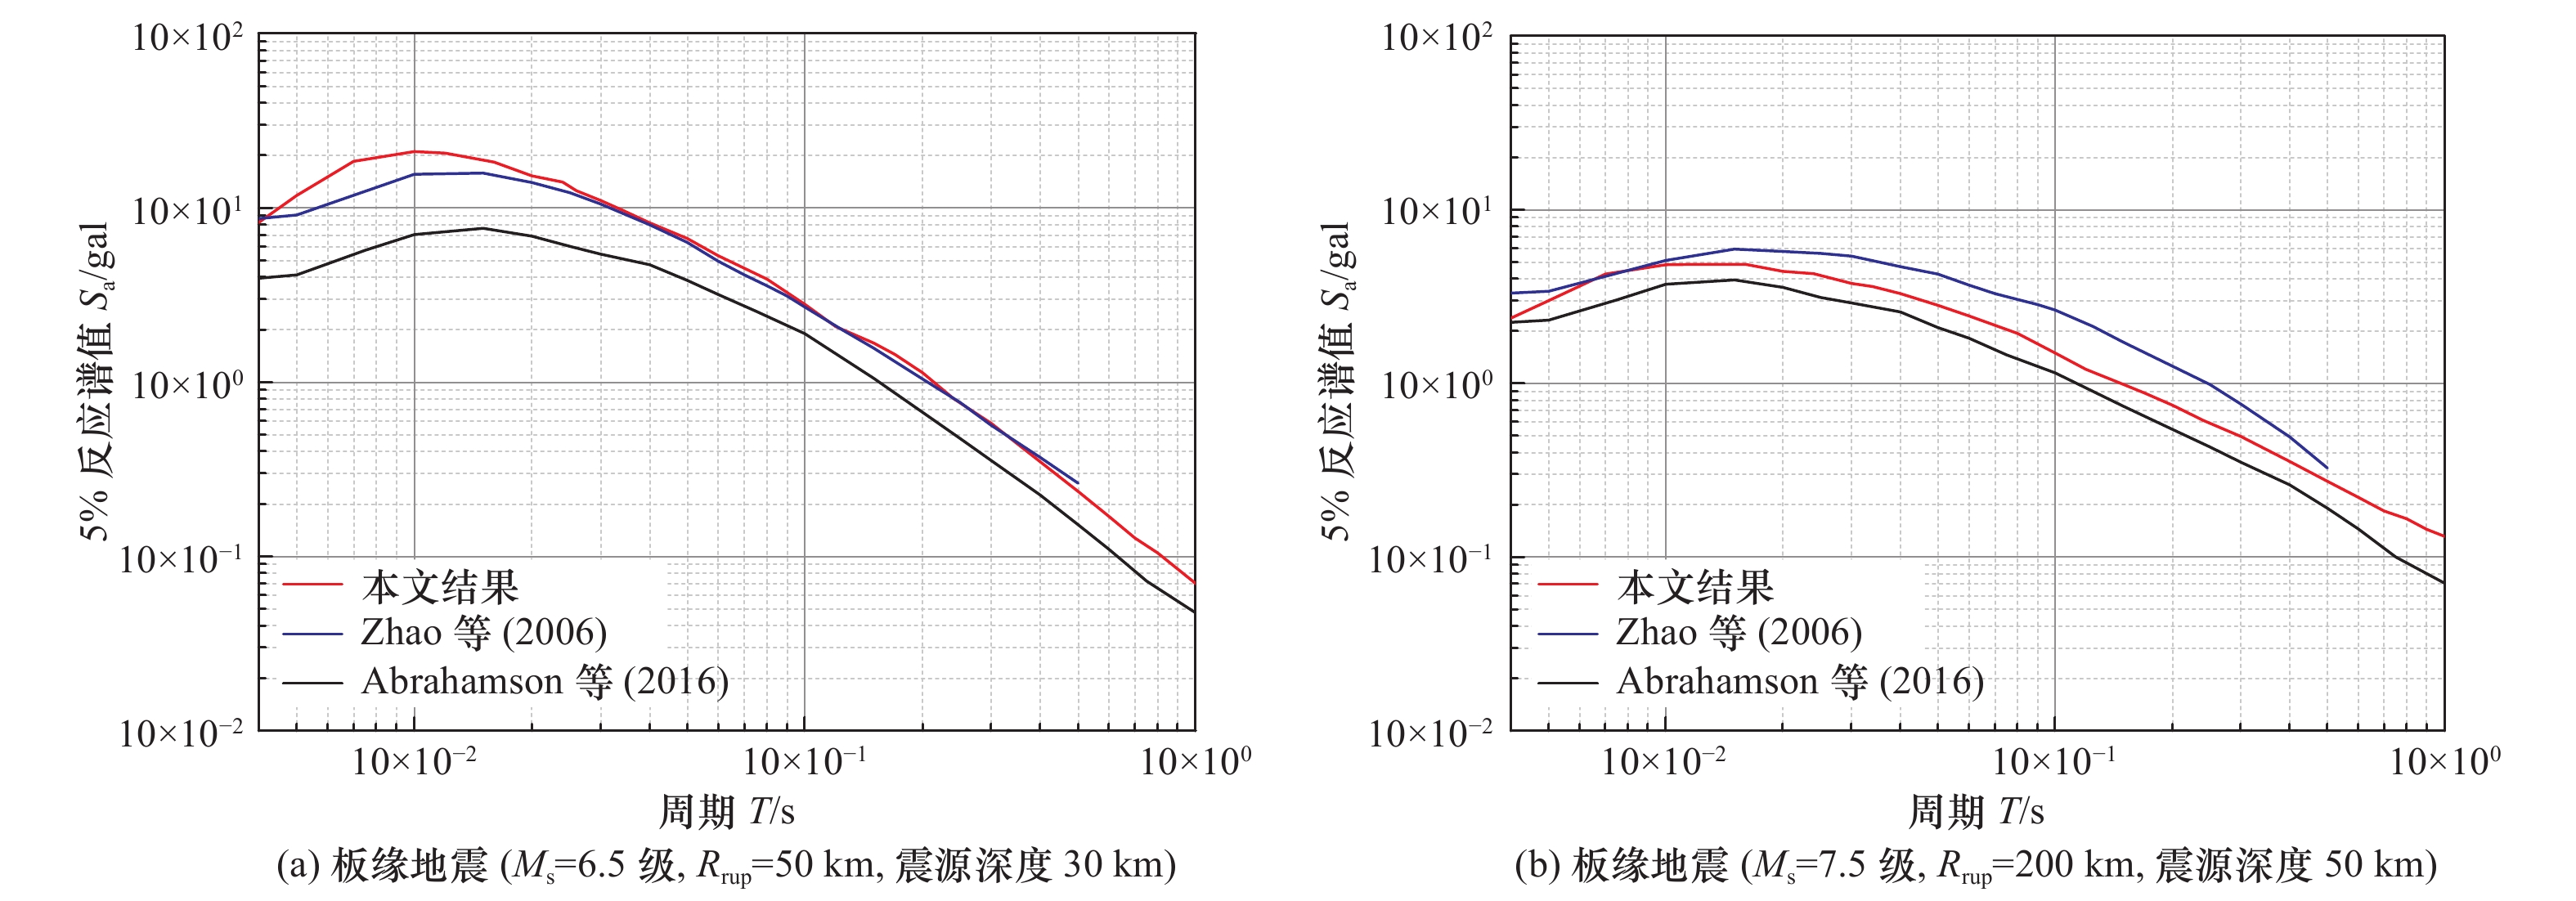
图 8 基岩水平向加速度反应谱曲线对比结果
Figure 8. Comparison of spectral acceleration curves for horizontal rock ground motion
表 1 强震资料地震目录(板缘地震)
Table 1. Catalog of strong earthquakes records (Interface earthquakes)
发震时刻 震中纬度N/° 震中经度E/° Ms/级 震源深度/km 2000-10-03T04:13:30.490 40.282 143.124 5.7 33 2001-08-13T20:11:23.400 41.046 142.308 6.3 38 2001-10-02T08:19:49.460 37.739 141.775 5.2 43 2002-11-03T03:37:42.070 38.886 141.977 6.1 39 2003-09-25T19:50:06.360 41.815 143.910 8.1 27 2003-09-25T21:08:00.030 41.774 143.593 7.4 33 2003-09-29T02:36:53.140 42.450 144.380 6.3 25 2003-10-08T09:06:55.340 42.648 144.570 6.6 32 2003-12-29T01:30:54.700 42.423 144.613 5.9 33 2004-04-11T18:06:12.480 42.918 144.836 5.7 42 2004-09-01T02:49:28.610 36.959 141.607 5.1 35 2005-01-18T14:09:06.220 42.946 144.866 5.7 42 2005-03-11T18:47:36.690 43.085 144.674 5.0 54 2005-07-09T23:37:11.140 33.422 140.825 5.4 55 2005-08-16T02:46:28.400 38.276 142.039 6.8 36 2005-10-19T11:44:42.790 36.405 140.839 6.5 32 2005-12-02T13:13:09.520 38.089 142.122 6.3 29 2007-11-26T13:51:39.800 37.392 141.586 5.9 42 2008-05-07T16:45:18.700 36.164 141.526 6.8 27 2008-07-19T02:39:28.700 37.552 142.214 7.0 22 2008-09-11T00:20:50.920 41.892 143.754 7.0 25 2009-06-05T03:30:33.060 41.824 143.445 6.4 29 2010-03-14T08:08:03.960 37.745 141.590 6.5 32 2010-07-04T21:55:51.980 39.697 142.369 6.3 27 2011-03-09T02:45:20.330 38.435 142.842 7.3 32 2011-03-11T05:46:24.120 38.297 142.373 9.0 29 2011-03-11T06:15:40.280 36.281 141.111 6.8 43 2011-03-25T11:36:24.490 38.772 141.880 6.2 39 2011-04-07T14:32:43.290 38.276 141.588 7.1 42 2011-04-21T13:37:03.340 35.579 140.305 6.2 43 2011-07-10T00:57:10.800 38.034 143.264 7.0 23 2011-07-23T04:34:24.180 38.898 141.815 6.4 41 2011-07-24T18:51:25.070 37.730 141.390 6.3 40 2011-07-30T18:53:50.720 36.942 140.955 6.5 38 2011-08-19T05:36:33.040 37.671 141.652 6.3 47 2011-09-16T19:26:40.260 40.273 142.779 6.7 30 2011-09-16T19:26:40.260 40.273 142.779 6.7 30 2011-11-24T10:25:34.030 41.898 142.639 6.2 38 2012-06-17T20:32:20.590 38.919 141.831 6.4 36 2012-12-07T08:18:23.130 37.890 143.949 7.3 31 2015-02-16T23:06:28.270 39.8558 142.8808 6.7 23 2015-05-12T21:12:58.890 38.9056 142.0317 6.8 35 2016-01-14T03:25:33.640 41.9723 142.7810 6.7 46 2018-01-24T10:51:19.090 41.1034 142.4323 6.3 31 2018-09-05T18:07:59.150 42.6861 141.9294 6.6 35  下载: 导出CSV
表 2 宽频带资料地震目录(板缘地震)
Table 2. Catalog of broad-band records (Interface earthquakes)
发震时刻 震中纬度N/° 震中经度E/° Ms/级 震源深度/km 2000-06-10T18:23:29.320 23.843 121.225 6.2 33 2000-07-04T22:19:44.160 20.240 122.163 5.2 33 2000-07-16T03:21:45.530 20.253 122.043 6.3 33 2000-09-10T08:54:45.960 24.008 121.526 5.6 35 2000-10-03T04:13:30.490 40.282 143.124 5.7 33 2001-06-14T02:35:25.810 24.513 122.033 5.6 32 2001-08-13T20:11:23.400 41.046 142.308 6.3 38 2001-08-17T22:25:49.010 25.748 126.190 5.6 33 2002-03-26T03:45:48.700 23.346 124.090 6.6 33 2002-03-31T06:52:50.490 24.279 122.179 7.4 33 2002-05-13T19:57:22.900 19.132 121.238 5.3 33 2002-07-11T07:36:26.060 24.075 122.288 5.6 44 2002-11-03T03:37:42.070 38.886 141.977 6.1 39 2003-06-09T01:52:51.010 24.413 122.020 5.5 48 2003-06-10T08:40:30.830 23.520 121.628 5.7 45 2003-09-25T19:50:06.360 41.815 143.910 8.1 27 2003-09-25T21:08:00.030 41.774 143.593 7.4 33 2003-09-29T02:36:53.140 42.450 144.380 6.3 25 2003-10-08T09:06:55.340 42.648 144.570 6.6 32 2005-01-18T14:09:06.220 42.946 144.866 5.7 42 2005-08-16T02:46:28.400 38.276 142.039 6.8 36 2005-09-06T01:16:02.350 24.084 122.191 6.1 32 2005-10-19T11:44:42.790 36.405 140.839 6.5 32 2006-07-28T07:40:11.840 24.183 122.526 5.9 33 2007-01-25T10:59:17.650 22.564 121.926 6.0 36 2007-04-20T19:37:58.230 27.471 128.379 5.3 42 2007-09-06T17:51:26.190 24.340 122.219 6.2 53 2008-06-01T01:57:23.690 20.124 121.350 6.3 31 2008-07-08T07:42:10.730 27.532 128.334 6.0 43 2008-09-11T00:20:50.920 41.892 143.754 6.7 25 2009-06-05T03:30:33.060 41.824 143.445 6.4 29 2009-10-30T07:03:39.120 29.218 129.782 6.8 34 2009-12-19T13:02:15.570 23.796 121.605 6.4 43 2010-03-14T08:08:03.960 37.745 141.590 6.5 32 2010-07-04T21:55:51.980 39.697 142.369 6.3 27 2010-10-04T13:28:38.860 24.270 125.154 6.3 32 2011-03-09T02:45:20.330 38.435 142.842 7.3 32 2011-03-11T05:46:24.120 38.297 142.373 9.0 29 2011-03-11T06:15:40.280 36.281 141.111 6.8 43 2011-03-11T15:13:14.680 35.994 141.808 6.3 21 2011-03-25T11:36:24.490 38.772 141.880 6.2 39 2011-04-07T14:32:43.290 38.276 141.588 7.1 42 2011-04-21T13:37:03.340 35.579 140.305 6.2 43 2011-07-10T00:57:10.800 38.034 143.264 7.0 23 2011-07-23T04:34:24.180 38.898 141.815 6.4 41 2011-07-24T18:51:25.070 37.730 141.390 6.3 40 2011-07-30T18:53:50.720 36.942 140.955 6.5 38 2011-08-19T05:36:33.040 37.671 141.652 6.2 47 2011-09-16T19:26:40.260 40.273 142.779 6.7 30 2011-09-16T19:26:40.260 40.273 142.779 6.7 30 2011-11-24T10:25:34.030 41.898 142.639 6.2 38 2012-06-09T21:00:18.070 24.572 122.248 5.9 70 2012-06-17T20:32:20.590 38.919 141.831 6.4 36 2012-12-07T08:18:23.130 37.890 143.949 7.3 31 2013-06-07T16:38:02.900 24.098 122.671 5.8 33 2013-10-25T17:10:19.710 37.1557 144.6611 7.1 35 2014-10-22T00:15:17.440 27.4158 128.5533 5.8 43 2015-02-13T20:06:32.330 22.6374 121.4270 6.2 30 2015-02-16T23:06:28.270 39.8558 142.8808 6.7 23 2015-05-12T21:12:58.890 38.9056 142.0317 6.8 35 2016-01-14T03:25:33.640 41.9723 142.7810 7.0 46 2016-12-26T01:23:37.880 19.1524 121.1743 5.2 34 2018-01-24T10:51:19.090 41.1034 142.4323 6.3 31 2018-09-05T18:07:59.150 42.6861 141.9294 6.6 35 2018-10-23T04:34:58.630 24.1153 122.6027 5.8 30 2018-10-23T16:04:04.240 23.9912 122.6791 5.7 31 2018-11-05T14:46:58.690 29.2376 130.5301 5.0 36
下载: 导出CSV
表 3 强震资料地震目录(板内地震)
Table 3. Catalog of strong earthquakes records (Intraslab earthquakes)
发震时刻 震中纬度N/° 震中经度E/° Ms/级 震源深度/km 2000-06-03T08:54:49.200 35.552 140.464 5.6 62 2001-12-02T13:01:53.670 39.402 141.089 6.5 124 2002-04-03T23:42:12.810 41.543 141.851 5.3 71 2002-10-14T14:12:43.750 41.174 142.249 5.9 61 2003-05-26T09:24:33.400 38.849 141.568 6.9 68 2003-09-20T03:54:50.780 34.998 140.172 5.3 52 2007-04-18T15:07:31.600 42.658 141.861 5.0 120 2007-07-01T04:12:07.750 43.663 144.734 5.8 130 2008-07-23T15:26:19.950 39.802 141.464 6.8 108 2008-09-22T07:31:59.170 41.578 140.450 5.2 149 2009-02-28T00:35:56.700 42.610 142.104 5.0 105 2009-08-12T22:48:51.420 32.821 140.395 6.6 53 2010-03-13T12:46:26.380 37.594 141.299 5.2 77 2013-02-02T14:17:35.130 42.770 143.092 6.9 107 2013-11-03T05:25:15.340 35.9713 140.1213 5.1 77 2014-06-14T17:31:41.560 39.4384 140.9876 5.0 92 2015-07-09T18:32:51.220 40.3631 141.4646 5.0 81 2019-04-27T17:24:45.654 42.4547 142.8191 5.4 111
下载: 导出CSV
表 4 测震资料地震目录(板内地震)
Table 4. Catalog of broad-band records (Intraslab earthquakes)
发震时刻 震中纬度N/° 震中经度E/° Ms/级 震源深度/km 2000-01-28T16:39:24.280 26.076 124.496 5.8 194 2000-06-03T08:54:49.200 35.552 140.464 5.6 62 2001-12-02T13:01:53.670 39.402 141.089 6.5 124 2003-05-26T09:24:33.400 38.849 141.568 6.9 68 2004-10-15T04:08:50.240 24.530 122.694 6.7 94 2005-10-15T15:51:08.130 25.309 123.351 6.4 192 2008-07-23T15:26:19.950 39.802 141.464 6.8 108 2008-09-09T07:43:13.320 24.666 122.570 5.0 102 2009-03-26T19:19:59.560 27.415 126.702 5.9 160 2009-08-12T22:48:51.420 32.821 140.395 6.6 53 2010-01-15T11:08:38.370 26.746 126.285 5.7 139 2011-11-08T02:59:08.510 27.324 125.621 6.9 225 2013-02-02T14:17:35.130 42.770 143.092 6.9 107 2013-09-06T11:33:53.520 20.1721 122.3193 6.0 175 2014-03-02T20:11:23.430 27.4312 127.3674 6.5 119 2014-12-10T21:03:39.260 25.5403 122.4503 6.1 256 2014-12-31T07:54:36.890 24.6707 122.5575 5.2 104 2016-03-14T07:03:17.710 29.8888 128.9567 5.5 211 2016-05-31T05:23:47.310 25.5615 122.5458 6.4 246 2017-04-30T01:57:22.160 21.2987 121.8285 5.2 106 2017-08-16T12:51:25.870 28.6737 127.9007 5.7 198 2019-02-17T20:36:56.890 20.6674 122.1168 5.0 169
下载: 导出CSV
表 5 板缘地震基岩水平向加速度反应谱预测模型相关参数
Table 5. Coefficients of horizontal rock spectral acceleration prediction model for interface earthquakes
周期/s A1 B1 A2 B2 C D E σ 0.01 1.812 0.555 2.339 0.474 1.935 0.956 0.462 0.377 0.04 1.746 0.573 2.445 0.465 1.929 0.956 0.462 0.378 0.05 1.960 0.581 2.856 0.443 1.990 0.956 0.462 0.376 0.07 2.342 0.559 3.277 0.416 2.018 0.956 0.462 0.381 0.10 2.432 0.562 3.303 0.428 2.044 0.956 0.462 0.374 0.12 2.455 0.558 3.232 0.438 2.045 0.956 0.462 0.365 0.16 2.569 0.526 2.871 0.480 2.025 0.956 0.462 0.358 0.20 2.549 0.508 2.596 0.501 1.993 0.956 0.462 0.353 0.24 2.412 0.510 2.480 0.500 1.946 0.956 0.462 0.339 0.26 2.361 0.497 2.307 0.505 1.897 0.956 0.462 0.334 0.30 2.316 0.495 2.134 0.523 1.897 0.956 0.462 0.329 0.34 1.980 0.515 1.966 0.518 1.817 0.956 0.462 0.326 0.40 1.684 0.539 1.735 0.532 1.781 0.956 0.462 0.325 0.50 1.344 0.571 1.535 0.542 1.757 0.956 0.462 0.325 0.60 1.105 0.588 1.206 0.572 1.738 0.956 0.462 0.342 0.80 0.592 0.643 0.878 0.600 1.731 0.956 0.462 0.348 1.00 −0.036 0.719 0.537 0.630 1.730 0.956 0.462 0.335 1.20 −0.325 0.744 0.182 0.666 1.734 0.956 0.462 0.334 1.50 −0.850 0.809 0.027 0.674 1.730 0.956 0.462 0.325 1.70 −1.000 0.819 −0.107 0.682 1.720 0.956 0.462 0.324 2.00 −1.410 0.860 −0.419 0.708 1.700 0.956 0.462 0.320 2.40 −1.610 0.860 −0.904 0.752 1.672 0.956 0.462 0.319 3.00 −1.891 0.873 −1.328 0.786 1.639 0.956 0.462 0.317 4.00 −2.091 0.858 −1.994 0.845 1.605 0.956 0.462 0.316 5.00 −2.484 0.885 −2.484 0.885 1.573 0.956 0.462 0.295 6.00 −2.903 0.917 −2.903 0.917 1.537 0.956 0.462 0.304 7.00 −3.273 0.945 −3.273 0.945 1.502 0.956 0.462 0.312 8.00 −3.546 0.963 −3.546 0.963 1.463 0.956 0.462 0.311 9.00 −3.800 0.977 −3.800 0.977 1.425 0.956 0.462 0.319 10.00 −4.099 1.000 −4.099 1.000 1.389 0.956 0.462 0.328
下载: 导出CSV
表 6 板内地震基岩水平向加速度反应谱预测模型的参数
Table 6. Coefficients of horizontal rock spectral acceleration prediction model for intraslab earthquakes
周期/s A1 B1 A2 B2 C D E F σ 0.01 3.541 0.516 3.639 0.501 2.442 0.956 0.462 0.008 0.377 0.04 3.652 0.506 3.678 0.502 2.440 0.956 0.462 0.008 0.377 0.05 3.679 0.525 3.881 0.494 2.471 0.956 0.462 0.008 0.378 0.07 3.825 0.528 4.094 0.486 2.488 0.956 0.462 0.008 0.376 0.10 3.927 0.537 4.220 0.491 2.507 0.956 0.462 0.008 0.381 0.12 4.005 0.529 4.249 0.491 2.517 0.956 0.462 0.008 0.374 0.16 3.834 0.549 3.898 0.540 2.516 0.956 0.462 0.008 0.365 0.20 3.678 0.562 3.707 0.558 2.506 0.956 0.462 0.008 0.358 0.24 3.514 0.574 3.546 0.569 2.483 0.956 0.462 0.008 0.353 0.26 3.447 0.567 3.460 0.566 2.451 0.956 0.462 0.008 0.339 0.30 3.299 0.573 3.341 0.567 2.415 0.956 0.462 0.008 0.334 0.34 3.334 0.565 3.341 0.563 2.426 0.956 0.462 0.007 0.329 0.40 3.236 0.571 3.347 0.553 2.431 0.956 0.462 0.006 0.326 0.50 3.262 0.563 3.388 0.544 2.462 0.956 0.462 0.004 0.325 0.60 3.122 0.574 3.126 0.573 2.476 0.956 0.462 0.004 0.325 0.80 2.778 0.637 3.348 0.549 2.560 0.956 0.462 0.004 0.342 1.00 2.431 0.667 3.170 0.553 2.550 0.956 0.462 0.004 0.348 1.20 2.298 0.671 3.063 0.553 2.547 0.956 0.462 0.004 0.335 1.50 2.105 0.671 2.792 0.564 2.524 0.956 0.462 0.004 0.334 1.70 1.682 0.718 2.705 0.561 2.501 0.956 0.462 0.004 0.325 2.00 1.384 0.743 2.561 0.562 2.480 0.956 0.462 0.004 0.324 2.40 1.174 0.741 2.130 0.594 2.451 0.956 0.462 0.004 0.320 3.00 0.459 0.746 1.353 0.609 2.217 0.956 0.462 0.004 0.319 4.00 0.219 0.675 0.219 0.675 2.039 0.956 0.462 0.004 0.317 5.00 −0.159 0.693 −0.159 0.693 2.005 0.956 0.462 0.004 0.316 6.00 −0.727 0.740 −0.727 0.740 1.973 0.956 0.462 0.004 0.295 7.00 −0.941 0.742 −0.941 0.742 1.937 0.956 0.462 0.004 0.304 8.00 −1.129 0.729 −1.129 0.729 1.863 0.956 0.462 0.004 0.312 9.00 −1.319 0.738 −1.319 0.738 1.863 0.956 0.462 0.004 0.311 10.00 −1.512 0.741 −1.512 0.741 1.825 0.956 0.462 0.004 0.319
下载: 导出CSV
-
[1] 高孟潭, 2015. GB 18306—2015《中国地震动参数区划图》宣贯教材. 北京: 中国质检出版社, 中国标准出版社. [2] 郝彦春, 2015. 俯冲带地震动特性及衰减规律初步研究. 哈尔滨: 中国地震局工程力学研究所.Hao Y. C., 2015. The preliminary study on characteristics of subduction-zone ground motion and its attenuation relationship. Harbin: Institute of Engineering Mechanics, China Earthquake Administration. (in Chinese) [3] 胡进军, 刁红旗, 谢礼立, 2013. 海底强地震动观测及其特征的研究进展. 地震工程与工程振动, 33(6): 1—8.Hu J. J., Diao H. Q., Xie L. L., 2013. Review of observation and characteristics of seafloor strong motion. Journal of Earthquake Engineering and Engineering Vibration, 33(6): 1—8. (in Chinese) [4] 胡进军, 郝彦春, 谢礼立, 2014. 潜在地震对我国南海开发和建设影响的初步考虑. 地震工程学报, 36(3): 616—621.Hu J. J., Hao Y. C., Xie L. L., 2014. Effects of potential earthquakes on construction and development in South China sea region. China Earthquake Engineering Journal, 36(3): 616—621. (in Chinese) [5] 刘瑞丰, 王丽艳, 袁乃荣等, 2015. GB 17740—2017 《地震震级的规定》宣贯教材. 北京: 地震出版社. [6] 肖亮, 俞言祥, 2010. 一种新的拟合地震动衰减关系的分步回归法. 地震学报, 32(6): 725—732.Xiao L., Yu Y. X., 2010. A new step-regression approach for fitting ground motion data with attenuation relation. Acta Seismologica Sinica, 32(6): 725—732. (in Chinese) [7] Abrahamson N., Gregor N., Addo K., 2016. BC hydro ground motion prediction equations for subduction earthquakes. Earthquake Spectra, 32(1): 23—44. doi: 10.1193/051712EQS188MR [8] Arango M. C., Strasser F. O., Bommer J. J., et al., 2012. An evaluation of the applicability of current ground-motion models to the South and Central American subduction zones. Bulletin of the Seismological Society of America, 102(1): 143—168. doi: 10.1785/0120110078 [9] Atkinson G. M., Boore D. M., 2003. Empirical ground-motion relations for subduction-zone earthquakes and their application to Cascadia and other regions. Bulletin of the Seismological Society of America, 93(4): 1703—1729. doi: 10.1785/0120020156 [10] Zhao J. X., Zhang J., Asano A., et al., 2006. Attenuation relations of strong ground motion in Japan using site classification based on predominant period. Bulletin of the Seismological Society of America, 96(3): 898—913. doi: 10.1785/0120050122 [11] Zhao J. X., Liang X., Jiang F., et al., 2016. Ground-motion prediction equations for subduction interface earthquakes in Japan using site class and simple geometric attenuation functions. Bulletin of the Seismological Society of America, 106(4): 1518—1534. doi: 10.1785/0120150034 -

 点击查看大图
计量
- 文章访问数: 252
- HTML全文浏览量: 51
- PDF下载量: 19
- 被引次数: 0
