
Review of Physical Vulnerability Assessment of Building Based on Indicator Method
-
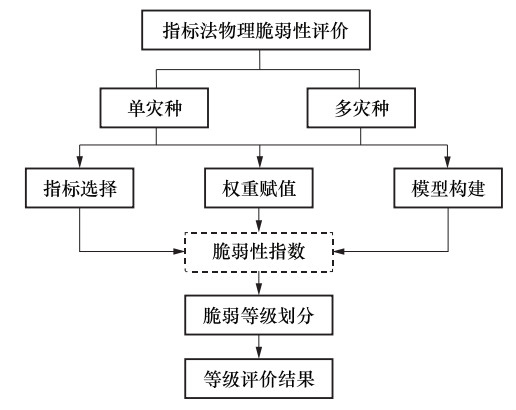
摘要: 承灾体脆弱性评估是科学进行灾害风险评估和预测的基础,房屋建筑作为面大量广的承灾体,众多学者对建筑物理脆弱性指标模型进行了研究。基于单灾种和多灾种2个维度,针对指标模型构建的各环节,全面梳理了几种典型单灾种物理脆弱性指标体系和评估模型构建情况,发现指标选取理论依据不明确,模型构建主观性较强,不能准确表征建筑特点与抗灾能力间的内在联系。系统总结了多灾种指标体系和耦合物理脆弱性指标模型研究现状,发现多灾种之间及其对承灾体影响的复杂耦合效应在现有指标模型中未得到充分体现。研究结果表明,明晰指标依据、优化模型构建是提升单灾种物理脆弱性评估准确性的关键;改进脆弱性耦合模型、拓展综合脆弱性评估方法是健全多灾种脆弱性评估研究的核心。Abstract: Vulnerability assessment of disaster bearing bodies is the basis of disaster risk assessment and prediction. Building is a kind of disaster bearing body vast in number and wide in scale, the research of physical vulnerability index model of buildings has attracted the interest of many researchers. The construction process of indicator-based method was introduced from the two dimensions of single-hazard and multi-hazard. The physical vulnerability index system and the index model construction of several typical single-hazard are comprehensively sorted out, and it is recognized that the scientific basis of model construction is not clear and the model construction is highly subjective which cannot accurately represent the internal relationship between the building characteristics and the ability to resist disasters. The research status of the physical vulnerability coupling index model for the triggering effect of multi-hazards was summarized, and it is found that coupling effects and their impacts on disaster bearing body are not fully reflected in the existing model. The research shows that optimizing index model and elaborating basis of indicators are the key to improve the effectiveness of single-hazard physical vulnerability assessment. Perfecting indicator system, improving coupled vulnerability model and developing the comprehensive vulnerability assessment method are the core of the research on multi-hazard vulnerability assessment.
-
Key words:
- Physical vulnerability /
- Index model /
- Single-hazard /
- Multi-hazard /
- Coupling effect /
- Comprehensive vulnerability
-
表 1 脆弱性等级划分标准
Table 1. Classification rule of vulnerability level
等级划分 脆弱性指数划分 涉及灾种 划分特点 来源 低、中、高 [0—0.33]、[0.34—0.66]、[0.67—1.00] 洪水 等间隔划分脆弱性指数,无脆弱等级描述 Yankson等(2017) 轻微破坏、中等破坏、大量破坏、完全毁坏 [0.1—0.3]、[0.4—0.6]、[0.7—0.8]、[0.9—1.0] 泥石流 按照破坏等级分配脆弱性指数,破坏等级与HAZUS地震方法中定义的破坏状态相似 Kang等(2016) 基本完好、轻微破坏、中等破坏、严重破坏、完全破坏 [0.1—0.2]、[0.2—0.4]、[0.4—0.6]、[0.6—0.8]、[0.8—1.0] 滑坡 等间隔划分脆弱性指数,根据专家调查确定破坏等级 guillard-gonalves等(2016) 极低、低、中、高、极高 [0—0.2]、[0.2—0.4]、[0.4—0.6]、[0.6—0.8]、[0.8—1.0] 多灾种 等间隔划分脆弱性指数,脆弱等级描述结合已有研究及专家意见 卢颖等(2017)  下载: 导出CSV
表 2 泥石流物理脆弱性评估方法
Table 2. Assessment method of physical vulnerability of debris flow
作者 研究区域 指标体系 模型方法 评估特点 Jean-Claude等(2014) 秘鲁南部阿雷基帕46个城市街区的约1000座建筑物 建筑物类型、建筑物材料、楼层数、维护状态、屋顶类型、位置和角度、基岩类型、冲积阶地的存在、坡度 主成分分析法(PCA) 指标选择较详细,分析方法降低了主观性,消除评估指标间的相关性影响。模型还适用于其他城市泥石流脆弱性研究,可应用性较强 Papathoma-Köhle等(2003) 意大利南蒂罗尔马尔泰地区51座建筑物 建筑物材料、维护状态、楼层数、周围街道树木朝向 专家判断法 指标选择上较宽泛,分析方法人为色彩较浓,但将指标法与脆弱性曲线结合,对于改进物理脆弱性评估方法具有重要作用 Ding等(2012) 云南省昆明市东川区小江流域 结构类型、建设年代、楼层数、住房面积 SOM神经网络法 由于研究目的为风险评估,物理脆弱性评估因子选择较简单,缺乏对灾害作用下环境特征指标的综合考虑 庞金彪(2017) 岷江上游山区各县乡 建筑物功能、建筑物结构、建筑物材料、建筑物面积、建筑物到最近泥石流沟的距离 SOM神经网络法 选择了建筑物功能指标,但建筑物功能、建筑物材料、建筑物结构间存在相关性,其对脆弱性的影响还需进一步探讨。SOM模型在数据分类中主观干扰小,聚类结果合理
下载: 导出CSV
表 3 滑坡物理脆弱性评估模型
Table 3. Physical vulnerability assessment model of landslide
作者 模型类型 指标体系 脆弱性模型 Papathoma- Köhle等(2007) 定性模型 建筑物材料(a)、楼层数(b)、周围环境(c)、滑坡面是否开窗(d)、是否存在潜在滑坡危险(e) $V = 5a + 4b + 3c + 2d + e$
式中,$V$为物理脆弱性,$a-e$为各指标得分Uzielli等(2008) 定量模型 结构类型${\xi _{{\rm{STY}}}}$、维护状态${\xi _{{\rm{SMN}}}}$ $ V=I·S$ $S = 1 - (1 - {\xi _{{\rm{STY}}}})(1 - {\xi _{{\rm{SMN}}}})$
式中,V为物理脆弱性,I为滑坡强度,S为建筑物易感性,${\xi _{{\rm{STY}}}}$为结构类型指标得分,${\xi _{{\rm{SMN}}}}$为维护状态指标得分Li等(2010) 定量模型 建筑物材料${\xi _{{\rm{SFD}}}}$、建筑物高度${\xi _{{\rm{STY}}}}$、建造年代${\xi _{{\rm{Smn}}}}$、基础深度${\xi _{{\rm{Sht}}}}$ $ V=f(I·R)$ $ R=\sqrt[4]{{\xi }_{\rm{SFD}}·{\xi }_{\rm{STY}}·{\xi }_{\rm{Smn}}·{\xi }_{\rm{Sht}}}$
式中,V为物理脆弱性,I为滑坡强度,R为建筑物抵抗力;${\xi _{{\rm{SFD}}}}$、${\xi _{{\rm{STY}}}}$、${\xi _{{\rm{Smn}}}}$、${\xi _{{\rm{Sht}}}}$为各指标得分Silva等(2014) 定量模型 结构类型CT、建筑物材料CM、楼屋面板材料FRS、楼层数NF、维护状态CS $ PV=LM·(1-BR)$
$BR = 0.3CT + 0.3CM + 0.2FRS + 0.1NF + 0.1CS$
式中,PV为物理脆弱性,LM为滑坡强度,BR为建筑物抵抗能力
下载: 导出CSV
表 4 洪水物理脆弱性评估模型
Table 4. Physical vulnerability assessment model of flood
作者 研究目标 指标体系 权重方法 评估特点 Fernandez等(2016) 社会、经济、环境、物理脆弱性 建筑物密度、楼层数、建造年代、结构类型 主成分分析法(PCA) 分析方法提高了指标选择和数量灵活性,但指标选取上略显粗糙 Müller等(2011) 社会、物理脆弱性 建筑物材料、建筑物位置、植被覆盖比例、排水设施 专家判断 进行了指标权重敏感性分析,结果表明指标对权重值的变化不敏感,指标选取具有合理性 Uwakwe(2015) 物理脆弱性 墙体材料、建筑物高度、楼层数、建造年代、保存状况 专家判断 指标权重赋值时对不同领域专家分值进行了综合,其中建筑物高度被认为是影响洪水脆弱性最重要的因素 Yankson等(2017) 物理、社会、环境脆弱性 房屋类型、房屋材料(地板、屋顶、外墙材料)、排水设施、建筑物位置(高程、坡度、到海岸线的距离) 专家判断 指标选取上用高程、坡度、海岸线距离作为量化评估因子,改善了定性评估的不确定性 Krellenberg等(2017) 社会、环境、物理脆弱性 建造质量、结构类型、是否有防护墙、屋顶类型、植被覆盖程度 专家判断 屋顶类型指标选取不合理,因其与洪水脆弱性的相关性较低。研究认为结构类型、植被覆盖程度是影响脆弱性的主要驱动因素 Romanescu等(2016) 物理、人口脆弱性 建筑物距河道的距离、水利工程存在与否、建筑物材料、建筑物质量、建筑物用途 专家判断 建筑物距河道的距离指标被赋予了更高的权重,作为影响脆弱性的主要原因
下载: 导出CSV
-
陈国华, 邹梦婷, 黄孔星等, 2019.化工园区多灾种耦合脆弱性方法探究与前沿综述.化工进展, 38(5):2527—2535. http://www.wanfangdata.com.cn/details/detail.do?_type=perio&id=hgjz201905055 葛全胜, 邹铭, 郑景云, 2008.中国自然灾害风险综合评估初步研究.北京:科学出版社. 辜智慧, 王娟, 葛怡等, 2015.基于PTVA修正模型的建筑单体台风脆弱性评估方法.中国安全科学学报, 25(11):99—105. http://www.wanfangdata.com.cn/details/detail.do?_type=perio&id=zgaqkxxb201511017 哈斯, 张继权, 佟斯琴等, 2016.灾害链研究进展与展望.灾害学, 31(2):131—138. http://www.wanfangdata.com.cn/details/detail.do?_type=perio&id=zhx201602027 季安康, 2017.震区砌体结构房屋抗震能力评价体系研究.哈尔滨: 东北林业大学. 李莉, 王晓婷, 王辉, 2010.脆弱性内涵、评价与研究趋势综述.中国渔业经济, 28(3):161—169. http://www.wanfangdata.com.cn/details/detail.do?_type=perio&id=zgyyjj201003027 李琳, 王俊杰.2018.四川省城市地震灾害脆弱性综合评价研究.震灾防御技术, 13(4):968—977. http://zzfy.eq-j.cn/zzfyjs/ch/reader/view_abstract.aspx?file_no=20180424&flag=1 刘爱华, 2013.城市灾害链动力学演变模型与灾害链风险评估方法的研究.长沙: 中南大学. 刘爱华, 吴超, 2015.基于复杂网络的灾害链风险评估方法的研究.系统工程理论与实践, 35(2):466—472. http://www.wanfangdata.com.cn/details/detail.do?_type=perio&id=xtgcllysj201502022 刘希林, 莫多闻, 2002.泥石流易损度评价.地理研究, 21(5):569—577. http://www.wanfangdata.com.cn/details/detail.do?_type=perio&id=dlyj200205005 刘珍, 文彦君, 薛界兰等, 2018.宝鸡农村地区地震灾害房屋脆弱性空间变化.华北地震科学, 36(4):25—32. http://www.wanfangdata.com.cn/details/detail.do?_type=perio&id=hbdzkx201804004 卢颖, 侯云玥, 郭良杰等, 2015.沿海城市多灾种耦合危险性评估的初步研究——以福建泉州为例.灾害学, 30(1):211—216. http://www.wanfangdata.com.cn/details/detail.do?_type=perio&id=zhx201501037 卢颖, 王洁鑫, 姜学鹏等, 2017.基于PTVA模型的房屋多灾种耦合物理脆弱性评估.中国安全科学学报, 27(8):1—6. http://www.wanfangdata.com.cn/details/detail.do?_type=perio&id=zgaqkxxb201708001 罗军华, 林孝松, 牟凤云等, 2018.山区公路暴雨-洪水灾害链贝叶斯网络建模推理.中国安全科学学报, 28(12):1—6. http://www.wanfangdata.com.cn/details/detail.do?_type=perio&id=zgaqkxxb201812001 明晓东, 徐伟, 刘宝印等, 2013.多灾种风险评估研究进展.灾害学, 28(1):126—132, 145. http://www.wanfangdata.com.cn/details/detail.do?_type=perio&id=zhx201301027 潘毅, 李玲娇, 姚蕴艺等, 2016.砖石结构古建筑震后破坏状态评估方法.西南交通大学学报, 51(4):704—713. http://www.wanfangdata.com.cn/details/detail.do?_type=perio&id=xnjtdxxb201604015 庞金彪, 2017.岷江上游泥石流胁迫下山区建筑物易损性评价.绵阳: 西南科技大学. 石先武, 国志兴, 张尧等, 2016.风暴潮灾害脆弱性研究综述.地理科学进展, 35(7):889—897. http://www.wanfangdata.com.cn/details/detail.do?_type=perio&id=dlkxjz201607010 史培军, 2002.三论灾害研究的理论与实践.自然灾害学报, 21(3):1—9. http://www.wanfangdata.com.cn/details/detail.do?_type=perio&id=zrzhxb200203001 史培军, 1996.再论灾害研究的理论与实践.自然灾害学报, 1(4):6—17. http://www.wanfangdata.com.cn/details/detail.do?_type=perio&id=QK199600705870 史培军, 吕丽莉, 汪明等, 2014.灾害系统:灾害群、灾害链、灾害遭遇.自然灾害学报, 23(6):1—12. http://www.wanfangdata.com.cn/details/detail.do?_type=perio&id=zrzhxb201406001 薛晔, 刘耀龙, 张涛涛, 2013.耦合灾害风险的形成机理研究.自然灾害学报, 22(2):44—50. http://www.wanfangdata.com.cn/details/detail.do?_type=perio&id=zrzhxb201302007 张学玲, 余文波, 蔡海生等, 2018.区域生态环境脆弱性评价方法研究综述.生态学报, 38(16):5970—5981. http://www.wanfangdata.com.cn/details/detail.do?_type=perio&id=stxb201816035 周扬, 李宁, 吴文祥, 2014.自然灾害社会脆弱性研究进展.灾害学, 29(2):128—135. http://www.wanfangdata.com.cn/details/detail.do?_type=perio&id=zhx201403030 周瑶, 王静爱, 2012.自然灾害脆弱性曲线研究进展.地球科学进展, 27(4):435—442. http://www.wanfangdata.com.cn/details/detail.do?_type=perio&id=dqkxjz201204009 Alwang J., Siegel P. B. Jorgensen S. L., 2001. Vulnerability: A view from different disciplines. Social Protection and Labor Policy and Technical Notes. Balica S., Wright N. G., 2010. Reducing the complexity of the flood vulnerability index. Environmental Hazards-human and Policy Dimensions, 9(4): 321—339. doi: 10.3763/ehaz.2010.0043 Birkmann J., 2006. Indicators and criteria. Measuring vulnerability to natural hazards: Towards disaster resilient societies. Chen H. X., Zhang S., Peng M., et al., 2015. A physically-based multi-hazard risk assessment platform for regional rainfall-induced slope failures and debris flows. Engineering Geology, 203: 15—29. http://www.wanfangdata.com.cn/details/detail.do?_type=perio&id=c153bad1f6eb864a4730e9d0e3d48e02 Dall'Osso F., Dominey-Howes D., Tarbotton C., et al., 2016. Revision and improvement of the PTVA-3 model for assessing tsunami building vulnerability using "international expert judgment": Introducing the PTVA-4 model. Natural Hazards, 83(2): 1229—1256. doi: 10.1007/s11069-016-2387-9 Dall'Osso F., Gonella M., Giovanni G. et al., 2009. A revised(PTVA)model for assessing the Vulnerability of buildings to Tsunami damage. Natural Hazards and Earth System Sciences, 9(5): 1557—1565. doi: 10.5194/nhess-9-1557-2009 Dall'Osso F., Maramai A., Graziani L., et al., 2010. Applying and validating the PTVA-3 model at the Aeolian Islands, Italy: Assessment of the vulnerability of buildings to tsunami. Natural Hazards and Earth System Sciences, 10(7): 1547—1562. doi: 10.5194/nhess-10-1547-2010 Ding M. T., Wei F. Q., Hu K. H., 2012. Property insurance against debris-flow disasters based on risk assessment and the principal-agent theory. Natural Hazards, 60(3): 801—817. doi: 10.1007/s11069-011-9897-2 Dombrowsky W. R., 1995. Again and again: Is a disaster what we call a 'Disaster'? International Journal of Mass Emergencies and Disasters, 13(3): 241—254. http://www.mendeley.com/catalog/again-again-disaster-we-call-disaster/ Dominey-Howes D., Papathoma-Kohle M., 2007. Validating a tsunami vulnerability assessment model (the PTVA model) using field data from the 2004 Indian Ocean Tsunami. Natural Hazards, 40(1): 113—136. doi: 10.1007/s11069-006-0007-9 Fernandez P., Mourato S., Moreira M., et al., 2016. A new approach for computing a flood vulnerability index using cluster analysis. Physics and Chemistry of the Earth, Parts A/B/C, 94: 47—55. doi: 10.1016/j.pce.2016.04.003 Ferreira T. M., Vicente R., Mendes da Silva J. A. R., et al., 2013. Seismic vulnerability assessment of historical urban centres: case study of the old city centre in Seixal, Portugal. Bulletin of Earthquake Engineering, 11(5): 1753—1773. doi: 10.1007/s10518-013-9447-2 Formisano A., Chieffo N., Marius M., et al., 2017. Seismic vulnerability and damage of a historical center in the district of Caserta (Italy). 3rd International Conference on Protection of Historical Constructions. Gent Franch K. A., Giuliano Morbelli G. M., Astroza Inostroza M. A., et al., 2008. A seismic vulnerability index for confined masonry shear wall buildings and a relationship with the damage. Engineering Structures, 30(10): 2605—2612. doi: 10.1016/j.engstruct.2008.02.005 Gill J. C., Malamud B. D., 2016. Hazard interactions and interaction networks (cascades) within multi-hazard methodologies. Earth System Dynamics, 7(3): 659—679. doi: 10.5194/esd-7-659-2016 Godfrey A., Ciurean R. L., Westen C. J., et al., 2015. Assessing vulnerability of buildings to hydro-meteorological hazards using an expert based approach-An application in Nehoiu Valley, Romania. International Journal of Disaster Risk Reduction, 13: 229—241. doi: 10.1016/j.ijdrr.2015.06.001 Guillard-Gonalves C., Zêzere J. L., Pereira S. S., et al., 2016. Assessment of physical vulnerability of buildings and analysis of landslide risk at the municipal scale-application to the Loures municipality, Portugal. Natural Hazards and Earth System Sciences Discussions, 16(2): 311—331. doi: 10.5194/nhess-16-311-2016 Inter American Development Bank (IDB), 2011. Indicators for disaster risk and risk management: Program for Latin-America and the Caribbean: Bahamas. Idb Publications. International Strategy for Disaster Reduction, 2004. Living with risk: A global review of disaster reduction initiatives Geneva: United Nations. Izquierdo T., Fritis E., Abad M., 2018. Analysis and validation of the PTVA tsunami building vulnerability model using the 2015 Chile post-tsunami damage data in Coquimbo and La Serena cities. Natural Hazards and Earth System Sciences, 18(6): 1703—1716. doi: 10.5194/nhess-18-1703-2018 Jean-Claude T., Ettinger S., Guitton M., et al., 2014. Assessing physical vulnerability in large cities exposed to flash floods and debris flows: The case of Arequipa (Peru). Natural Hazards, 73(3): 1771—1815. doi: 10.1007/s11069-014-1172-x Kang H., Kim Y., 2016. The physical vulnerability of different types of building structure to debris flow events. Natural Hazards, 80(3): 1475—1493. doi: 10.1007/s11069-015-2032-z Kappes M., Keiler M., Glade T., 2010. From single-to multi-hazard risk analyses: A concept addressing emerging challenges. Mountain Risks: Bridging Science to Society. Kappes M., Papathoma-Köhle M., Keiler M., 2012. Assessing physical vulnerability for multi-hazards using an indicator-based methodology. Applied Geography, 32(2): 577—590. doi: 10.1016/j.apgeog.2011.07.002 Krellenberg K., Welz J., 2017. Assessing urban vulnerability in the context of flood and heat hazard: Pathways and challenges for indicator-based analysis. Social Indicators Research, 132(2): 709—731. doi: 10.1007/s11205-016-1324-3 Li Z. H., Nadim F., Huang H. W., et al., 2010. Quantitative vulnerability estimation for scenario-based landslide hazards.Landslides, 7(2): 125—134. doi: 10.1007/s10346-009-0190-3 Marzocchi W., Garcia-Aristizabal A., Gasparini P., et al., 2012. Basic principles of multi-risk assessment: A case study in Italy. Natural Hazards, 62(2): 551—573. doi: 10.1007/s11069-012-0092-x Marzocchi W., Mastellone M., Di Ruocco A., et al., 2009. Principles of multi-risk assessment: interactions amongst natural and man-induced risks. European Commission. Maskrey A., 1989. Disaster mitigation: a community based approach. Oxford, England: Oxford England Oxfam. Müller A., Reiter J., Weiland U., 2011. Assessment of urban vulnerability towards floods using an indicator-based approach-a case study for Santiago de Chile. Natural Hazards and Earth System Sciences Discussions. 11(8): 2107—2123. doi: 10.5194/nhess-11-2107-2011 Nardo M., Saisana M., Saltelli A., et al., 2008. Handbook on constructing composite indicators: Methodology and user guide. Oecd Statistics Working Papers, 73(2): 1111. http://www.researchgate.net/publication/263538041_Handbook_on_Constructing_Composite_Indicators_Methodology_and_User_Guide Gasparini P., Garcia-Aristizabal A., 2014. Seismic risk assessment, cascading effects. Encyclopedia of Earthquake Engineering. Springer-Verlag Berlin Heidelberg. Papathoma-Köhle M., 2016. Vulnerability curves vs. vulnerability indicators: Application of an indicator-based methodology for debris-flow hazards. Natural Hazards and Earth System Sciences, 16(8): 1771—1790. doi: 10.5194/nhess-16-1771-2016 Papathoma-Köhle M., Dominey-Howes D., Zong Y., et al., 2003. Assessing tsunami vulnerability, an example from Herakleio, Crete. Natural Hazards and Earth System Sciences, 3(5): 377—389. doi: 10.5194/nhess-3-377-2003 Papathoma-Köhle M., Gems B., Sturm M., Fuchs S., et al., 2017. Matrices, curves and indicators: A review of approaches to assess physical vulnerability to debris flows. Earth-Science Reviews, 171: 272—288. doi: 10.1016/j.earscirev.2017.06.007 Papathoma-Köhle M., Neuhä; user B., Ratzinger K., et al., 2007. Elements at risk as a framework for assessing the vulnerability of communities to landslides. Natural Hazards and Earth System Sciences, 7(6): 765—779. doi: 10.5194/nhess-7-765-2007 Perles Roselló M. J., Cantarero Prados F., 2010. Problems and challenges in analyzing multiple territorial risks. Methodological proposals for multi-hazard mapping. Boletın de la Asociación de Geógrafos Espanoles, 52: 399—404. http://www.researchgate.net/publication/288556258_Problems_and_challenges_in_analyzing_multiple_territorial_risks_Methodological_proposals_for_multi-hazard_mapping Romanescu G., Chelariu O. E., Ionut M., et al., 2016. Flood vulnerability assessment in the mountain–plateau transition zone. Case study for Marginea village (Romania).Journal of Flood Risk Management, 11(S1): S502—S513. doi: 10.1111/jfr3.12249 Santos A., Tavares A. O., Emidio A., 2014. Comparative tsunami vulnerability assessment of an urban area: An analysis of Setúbal city, Portugal.Applied Geography, 55: 19—29. doi: 10.1016/j.apgeog.2014.08.009 Silva M., Pereira S. S., 2014. Assessment of physical vulnerability and potential losses of buildings due to shallow slides. Natural Hazards, 72(2): 1029—1050. doi: 10.1007/s11069-014-1052-4 Uwakwe A. C., 2015. Assesment of physical vulnerability to flood in Saint Lucia: Case studies: Castries old central business district and dennery village. Enschede, Netherlands: University of Twente Faculty of Geo-Information and Earth Observation (ITC). Uzielli M., Nadim F., Lacasse S., et al., 2008. A conceptual framework for quantitative estimation of physical vulnerability to landslides. Engineering Geology, 102(3): 251—256. http://www.wanfangdata.com.cn/details/detail.do?_type=perio&id=e14b158e454420e47ef7c5623bd85575 Voulgaris G., Murayama Y., 2014. Tsunami vulnerability assessment in the Southern Boso Peninsula, Japan. International Journal of Disaster Risk Reduction, 10: 190—200. doi: 10.1016/j.ijdrr.2014.08.001 Westgate K., 1978. UNDRO-disaster prevention and mitigation-compendium of current knowledge-united-nations. Disasters, 2(2-3): 176—178. http://www.safetylit.org/citations/index.php?fuseaction=citations.viewdetails&citationIds[]=citjournalarticle_35885_4 Xu C., Xu X. W., Dai F. C., et al., 2012. Comparison of different models for susceptibility mapping of earthquake triggered landslides related with the 2008 Wenchuan earthquake in China. Computers & Geosciences, 46: 317—329. http://www.wanfangdata.com.cn/details/detail.do?_type=perio&id=f697d8239be9baa741270e0821c2e018 Xu L. F., Meng X. W., Xu X. G., 2014. Natural hazard chain research in China: A review. Natural Hazards, 70(2):1631—1659. doi: 10.1007/s11069-013-0881-x Xu M. Z., Wang Z. Y., Qi L. J., et al., 2012. Disaster chains initiated by the Wenchuan earthquake. Environmental Earth Sciences, 65(4): 975—985. doi: 10.1007/s12665-011-0905-3 Yankson P. W. K., Owusu A. B., Owusu G., et al., 2017. Assessment of coastal communities' vulnerability to floods using indicator-based approach: A case study of Greater Accra Metropolitan Area, Ghana.Natural Hazards, 89(2): 661—689. doi: 10.1007/s11069-017-2985-1 Zuccaro G., De Gregorio D., Leone M. F., 2018. Theoretical model for cascading effects analyses. International Journal of Disaster Risk Reduction, 30: 199—215. doi: 10.1016/j.ijdrr.2018.04.019 -

 点击查看大图
计量
- 文章访问数: 1017
- HTML全文浏览量: 119
- PDF下载量: 72
- 被引次数: 0
