Relationship between Shear Wave Velocity and Soil Depth of Typical Soil Layers in Hangzhou Area
-
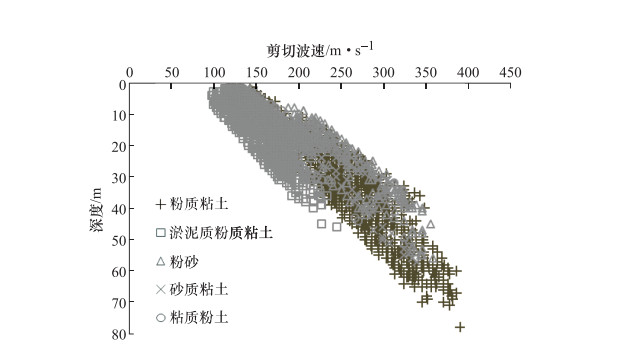
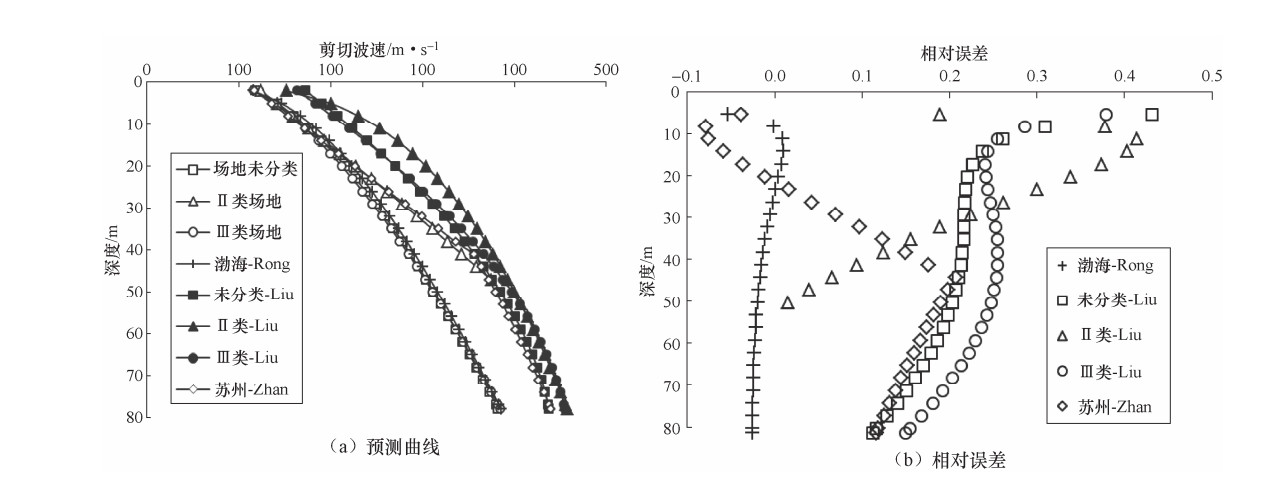
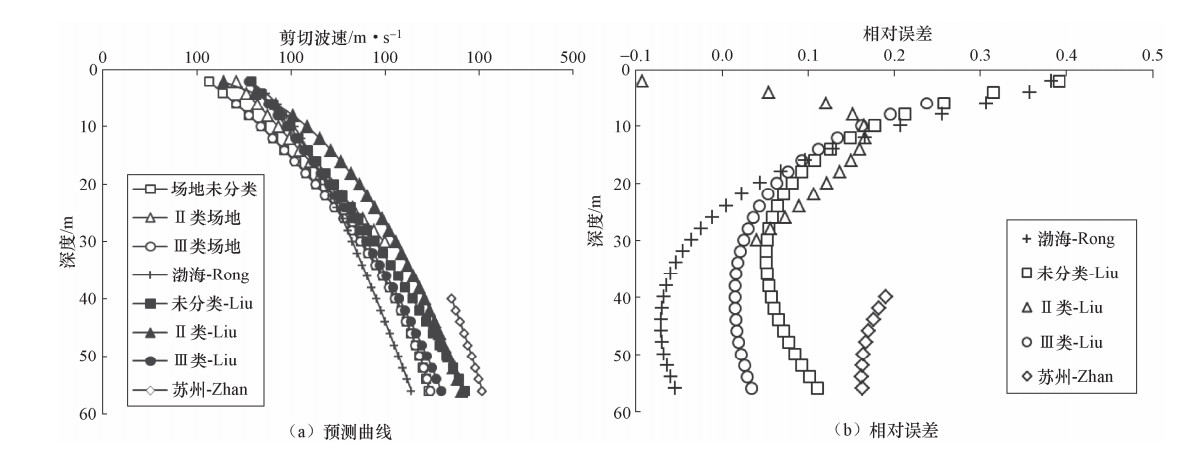
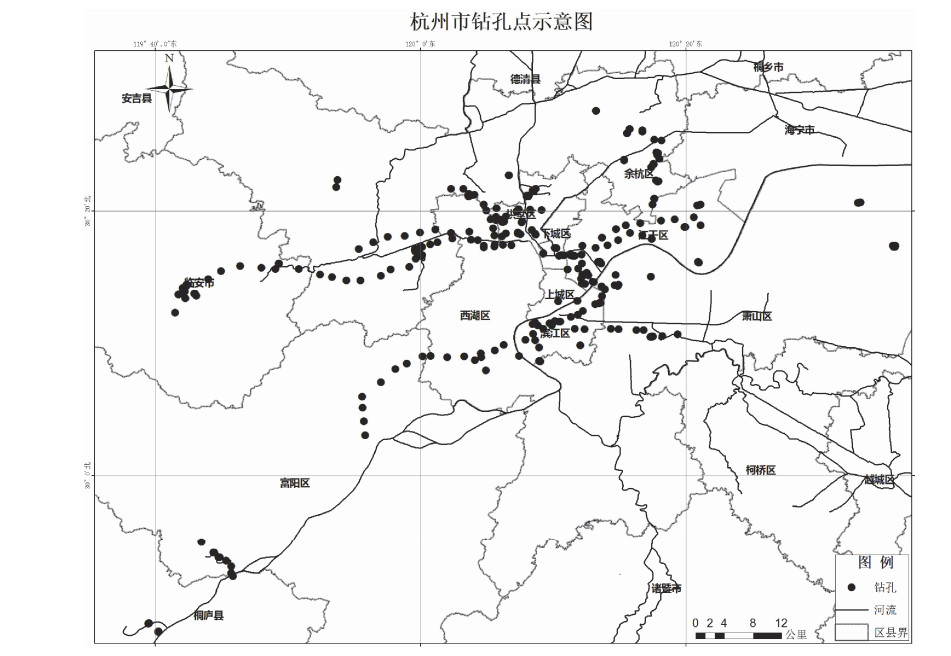
摘要: 基于杭州市丰富的场地钻孔剪切波速资料,采用3种常见的剪切波速与埋深回归分析模型,分析杭州地区5类常规土在场地分类和场地未分类情况下的最优拟合公式和预测范围,并对推荐模型进行可靠性验证,对常规粉质粘土和粉砂进行地区差异性分析。研究结果表明:本文推荐的剪切波速与埋深关系公式具有良好的可靠性;地区、岩土类型和预测深度均对剪切波速与埋深关系模型的可靠性产生显著影响,故应用时应优先选用本地区统计模型,如若未有,则需根据已有资料,对选用模型进行岩土类型和适应预测深度范围验证,以保证所选模型的可靠性;受地区、岩土类型和预测深度的影响,考虑场地分类并不一定提高统计模型的预测精度,在实际工程应用中具有不确定性。Abstract: Based on abundant of shear wave velocity from lots of boreholes in Hangzhou, three common regression models were used to analyze the relationship between shear wave velocity and soil buried depth. In the case of site classification and unclassification, this paper analyzed the optimal fitting formulas and prediction range of five types of soils in Hangzhou. In this paper, the reliability of all recommended models were verified, and the regional differences of conventional silty clay and silt were analyzed. The research results show that the regression equations of shear wave velocity and buried depth recommended in this paper has good reliability. Regions, geotechnical types and predicted depths have significant effects on the reliability of the relationship between shear wave velocity and soil buried depth. Therefore, to ensure the reliability of the selected models, local statistical models should be put in the first place, otherwise, it is necessary to verify the geotechnical types and the prediction depth of the selected models. Influenced by regions, geotechnical types and prediction depths, considering site classification does not necessarily improve the prediction accuracy of statistical models, which has uncertainty in practical engineering applications.
-
Key words:
- Shear wave velocity /
- Buried depth /
- Site classification /
- Regression analysis
-
表 1 研究区不同土类剪切波速的分布范围
Table 1. Distribution ranges of shear wave velocity of different soils in study area
岩性 粉质粘土 淤泥质粉质粘土 粉砂 砂质粉土 粘质粉土 场地类别 总计 Ⅱ Ⅲ 总计 Ⅱ Ⅲ 总计 Ⅱ Ⅲ 总计 Ⅱ Ⅲ 总计 Ⅱ Ⅲ 测试点数 1915 324 1591 902 31 871 383 17 366 904 88 816 330 69 261 最小值/m·s-1 115 115 117 98 102 98 134 134 139 112 122 112 112 116 112 最大值/m·s-1 390 348 390 245 215 245 357 303 357 339 310 339 321 321 270 平均值/m·s-1 249.4 203.4 258.8 153.9 139.5 154.4 227.5 255.0 226.2 163.1 202.4 158.9 154.2 165.0 151.3 标准差/m·s-1 59.0 62.9 53.6 29.1 30.9 28.9 54.5 42.7 54.7 37.0 56.5 31.5 32.8 45.8 27.8 测试深度/m 2—78 2—44 2—78 2—46 4—24 2—46 1—56 1—30 5—56 1—57 1—34 1—57 2—44 2—36 2—44 表 2 不同场地分类情况下5类土拟合优度
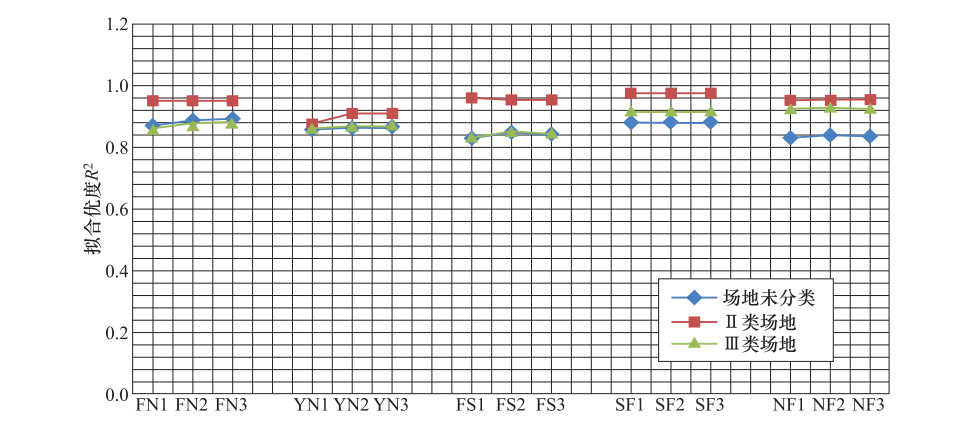
Table 2. Goodness of fitting of five types of soil under different site classification
岩土类型 工况 R2 场地未分类 Ⅱ类场地 Ⅲ类场地 粉质粘土 FN1 0.86870 0.95298 0.86330 FN2 0.88890 0.95301 0.87860 FN3 0.89140 0.95284 0.88130 淤泥质粉质粘土 YN1 0.86130 0.87627 0.86470 YN2 0.86560 0.90946 0.86850 YN3 0.86460 0.90960 0.86770 粉砂 FS1 0.83000 0.95942 0.83480 FS2 0.84820 0.95659 0.84980 FS3 0.84140 0.95670 0.84540 砂质粉土 SF1 0.88030 0.97654 0.91490 SF2 0.88110 0.97672 0.91530 SF3 0.88020 0.97725 0.91550 粘质粉土 NF1 0.83070 0.95183 0.92820 NF2 0.83860 0.95568 0.92910 NF3 0.83520 0.95554 0.92810 表 3 各场地类型下不同岩土类型的推荐模型
Table 3. Recommended models for different geotechnical types under different site types
岩土类型 场地类别 推荐模型 回归方程 残差标准差 R2 适应范围/m 粉质粘土 Ⅱ类 模型2 ${v_s} = 112.4398 + 5.9058H - 0.0077{H^2}$ 13.58 0.9530 2—44 Ⅲ类 模型3 ${v_s} = 86.5602 + 18.7249{H^{0.6352}}$ 18.45 0.8813 2—78 场地未分类 模型3 ${v_s} = 85.5503 + 21.3380{H^{0.6041}}$ 19.44 0.8914 2—78 淤泥质粉质粘土 Ⅱ类 模型2 ${v_s} = 104.8362 + 0.2524{H^{1.9230}}$ 8.83 0.9096 4—24 Ⅲ类 模型2 ${v_s} = 90.5189 + 4.1075H - 0.0227{H^2}$ 10.46 0.8685 2—46 场地未分类 模型2 ${v_s} = 89.9598 + 4.1857H - 0.0245{H^2}$ 10.65 0.8656 2—46 粉砂 Ⅱ类 模型1 ${v_s} = 130.5509 + 5.6417H$ 8.08 0.9594 1—30 Ⅲ类 模型2 ${v_s} = 100.2213 + 7.3496H - 0.0521{H^2}$ 18.79 0.8498 5—56 场地未分类 模型2 ${v_s} = 98.7936 + 7.5598H - 0.0558{H^2}$ 21.19 0.8482 1—56 砂质粉土 Ⅱ类 模型3 ${v_s} = 112.9768 + 4.1008{H^{1.1103}}$ 8.37 0.9773 1—34 Ⅲ类 模型3 ${v_s} = 120.9837 + 3.0980{H^{1.0546}}$ 18.45 0.9155 1—57 场地未分类 模型2 ${v_s} = 113.5888 + 4.5896H - 0.0079{H^2}$ 12.73 0.8811 1—57 粘质粉土 Ⅱ类 模型2 ${v_s} = 115.3530 + 4.2818H + 0.0461{H^2}$ 9.42 0.9551 2—36 Ⅲ类 模型2 ${v_s} = 121.1832 + 2.7579H + 0.0110{H^2}$ 7.39 0.9291 2—44 场地未分类 模型2 ${v_s} = 123.4666 + 2.4199H - 0.0354{H^2}$ 13.14 0.8386 2—44 表 4 Ⅱ类场地实测剪切波速与预测值的对比分析
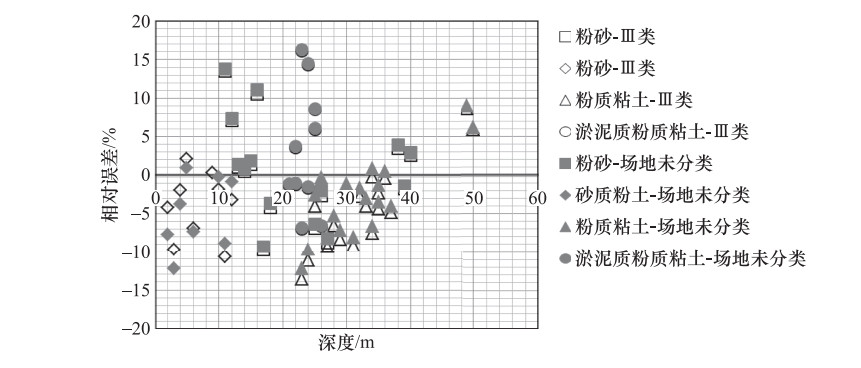
Table 4. Comparative analysis of measured shear wave velocity and predicted value of site Ⅱ
岩土类型 钻孔编号 深度
/m实测剪切波速
/m·s-1Ⅱ类场地预测值
/m·s-1相对误差
/%场地未分类预测值
/m·s-1相对误差
/%粉质粘土 JZ1 3 130 130 0.07 127 -2.32 JZ1 5 143 142 -0.84 142 -0.72 JZ-Ⅳ 8 152 159 4.76 160 5.58 JZ-Ⅳ 24 222 250 12.68 231 4.09 JZ-Ⅳ 27 263 267 1.44 242 -8.06 粉砂 JZ1 29 278 278 -0.06 249 -10.54 JZ1 24 233 266 14.14 248 6.48 JZ1 26 286 277 -3.06 258 -9.92 淤泥质粉质粘土 JZ-Ⅳ 16 154 157 1.97 151 -2.17 JZ-Ⅳ 17 145 163 12.75 154 6.23 JZ-Ⅳ 19 159 177 11.62 161 1.03 -
-


 下载:
下载:
