Statistical Analysis of Dynamic Parameters in Yanliang Area of Aviation Industry Group
-
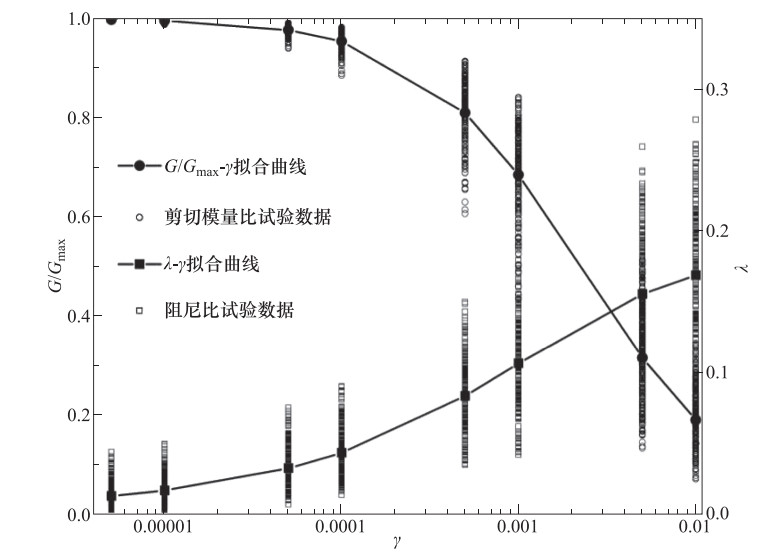
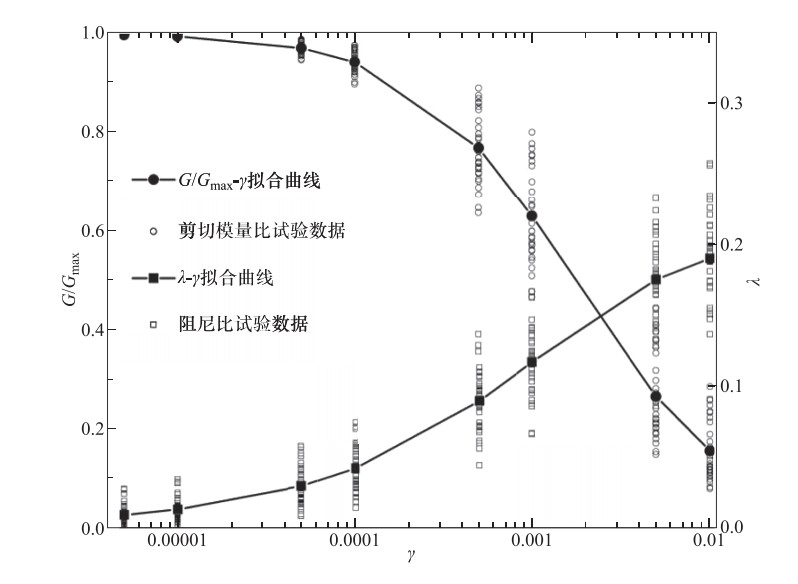
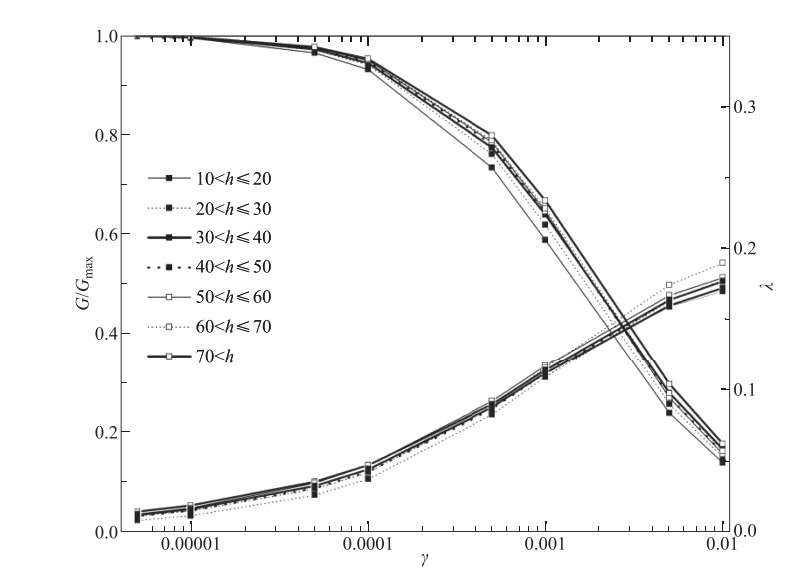
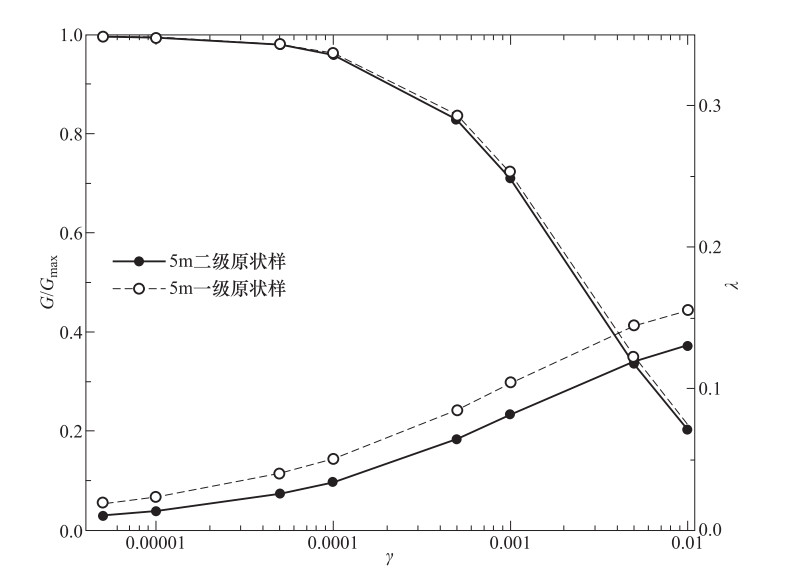
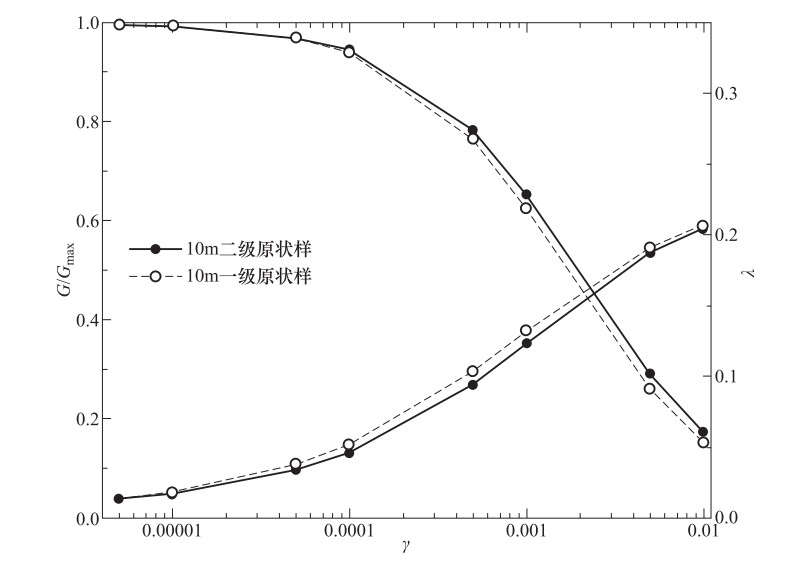
摘要: 基于航空工业组团阎良片区地震小区划项目中大量动三轴试验结果,通过双曲线拟合方法,得到主要土类(黄土状土、粉质粘土、粉土、细砂)在8个典型剪应变(0.000005、0.00001、0.00005、0.0001、0.0005、0.001、0.005、0.01)下的动剪切模量比和阻尼比统计值,并将得到的统计值与廖振鹏给出的建议值、陈党民等给出的典型值和袁晓铭等给出的推荐值进行比较,进一步论证土动力学参数的地域性特征。文中还探讨了土样埋深和取样手段(试样等级)对动剪切模量比和阻尼比的影响。文中给出的统计值可为该片区地震小区划中的土层地震反应模型提供参数,同时也为研究该片区场地土动力特性及重大工程地震安全性评价工作提供参考和借鉴。Abstract: Based on a large number of dynamic triaxial test results of the seismic microzoning project in Yanliang area of aviation industry group, statistical values of dynamic shear modulus ratio and damping ratio of the main soil types such as loessial soil, silty clay, silt and fine sand, under eight typical shear strains, such as 0.000005, 0.00001, 0. 00005, 0.0001, 0.0005, 0.001, 0.005 and 0.01, were obtained through hyperbolic fitting. This paper compared the statistical values with the suggested values proposed by Liao Zhenpeng, the typical values proposed by Chen Dangmin, etc. and the recommended values proposed by Yuan Xiaoming, etc., so as to further demonstrate the regional characteristics of soil dynamic parameters. The effects of soil sample depth and sampling method (sample level) on dynamic shear modulus ratio and damping ratio were discussed. The statistical values can provide parameters for the seismic response model of the soil layer in the seismic microzoning, and have reference significance for the study of the soil dynamic characteristics of the area and the seismic safety evaluation of major projects.
-
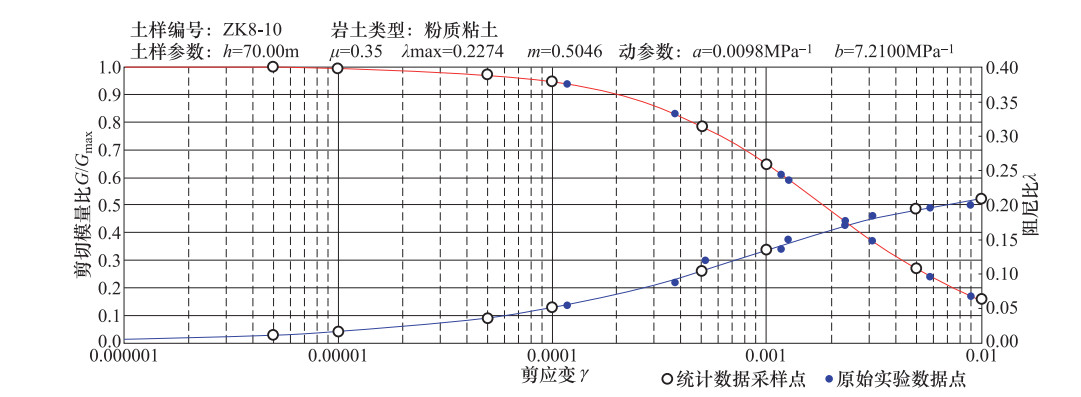
表 1 土样8个典型剪应变下G/Gmax-γ和λ-γ试验值
Table 1. Test values of G/Gmax-γ and λ-γ of soil samples under eight typical shear strains
土样编号 土性 参数 剪应变/×10-4 0.05 0.1 0.5 1 5 10 50 100 ZK8-10 粉质粘土 G/Gmax 0.9973 0.9946 0.9735 0.9483 0.7859 0.6473 0.2685 0.1550 λ 0.0115 0.0163 0.0364 0.0510 0.1045 0.1344 0.1942 0.2088 表 2 用于统计分析的各类土样本情况
Table 2. Various soil samples used for statistical analysis
土性 黄土状土 粉质粘土 粉土 细砂 样本数 190 167 32 17 取样深度 2—15 15—80.2 5—50 10.5—77 试验围压 100—300 300—600 100—600 210—600 密度/g·cm-3 1.60—2.07 1.88—2.19 1.58—2.21 1.63—2.18 剪切波速/m·s-1 193—299 278—509 172—359 292—475 表 3 主要土类动三轴试验数据统计
Table 3. Dynamic triaxial test data statistics of main soils
土性 取样深度 参数 剪应变/×10-4 0.05 0.1 0.5 1 5 10 50 100 黄土状土 2—15 G/Gmax 0.9976 0.9951 0.9762 0.9538 0.8092 0.6843 0.3154 0.1902 λ 0.0130 0.0170 0.0325 0.0434 0.0835 0.1065 0.1556 0.1687 粉质粘土 15—80.2 G/Gmax 0.9968 0.9937 0.9694 0.9409 0.7669 0.6280 0.2647 0.1550 λ 0.0108 0.0146 0.0305 0.0422 0.0863 0.1115 0.1626 0.1755 粉土 5—50 G/Gmax 0.9969 0.9938 0.9700 0.9420 0.7693 0.6303 0.2665 0.1565 λ 0.0096 0.0134 0.0298 0.0421 0.0899 0.1178 0.1758 0.1909 细砂 10.5—77 G/Gmax 0.9984 0.9968 0.9842 0.9689 0.8619 0.7578 0.3870 0.2406 λ 0.0040 0.0059 0.0147 0.0219 0.0534 0.0750 0.1327 0.1514 表 4 10m<h(片区埋深)≤20m粉质粘土G/Gmax-γ和λ-γ统计值
Table 4. Statistical values of G/Gmax-γ and λ-γ of silty clay buried at depths of 10m to 20m
取样个数 参数 剪应变/×10-4 0.05 0.1 0.5 1 5 10 50 100 29 G/Gmax 0.9961 0.9923 0.9627 0.9286 0.7322 0.5865 0.2374 0.1380 λ 0.0113 0.0153 0.0320 0.0443 0.0889 0.1129 0.1585 0.1693 表 5 粉质粘土在不同埋深区间的G/Gmax-γ和λ-γ统计值
Table 5. Statistical values of G/Gmax-γ and λ-γ of silty clay at different buried depths
埋深h/m 样本数量 试验围压
P/kPa参数 剪应变/×10-4 0.05 0.1 0.5 1 5 10 50 100 10<h≤20 29 200<P≤400 G/Gmax 0.9961 0.9923 0.9627 0.9286 0.7322 0.5865 0.2374 0.1380 λ 0.0113 0.0153 0.0320 0.0443 0.0889 0.1129 0.1585 0.1693 20<h≤30 42 400<P≤600 G/Gmax 0.9966 0.9933 0.9677 0.9377 0.7577 0.6172 0.2589 0.1519 λ 0.0075 0.0107 0.0254 0.0370 0.0838 0.1115 0.1691 0.1840 30<h≤40 31 P=600 G/Gmax 0.9969 0.9937 0.9694 0.9408 0.7646 0.6233 0.2585 0.1506 λ 0.0098 0.0133 0.0280 0.0391 0.0819 0.1065 0.1563 0.1687 40<h≤50 31 P=600 G/Gmax 0.9969 0.9939 0.9703 0.9427 0.7745 0.6394 0.2768 0.1636 λ 0.0116 0.0156 0.0317 0.0434 0.0866 0.1107 0.1592 0.1715 50<h≤60 8 P=600 G/Gmax 0.9971 0.9942 0.9715 0.9447 0.7768 0.6382 0.2675 0.1557 λ 0.0110 0.0147 0.0304 0.0420 0.0856 0.1108 0.1628 0.1761 60<h≤70 12 P=600 G/Gmax 0.9972 0.9944 0.9726 0.9467 0.7819 0.6435 0.2691 0.1562 λ 0.0115 0.0157 0.0333 0.0459 0.0929 0.1195 0.1731 0.1865 70<h 14 P=600 G/Gmax 0.9973 0.9946 0.9738 0.9490 0.7906 0.6564 0.2840 0.1673 λ 0.0140 0.0180 0.0339 0.0454 0.0888 0.1144 0.1685 0.1826 表 6 二级原状样与一级原状样动三轴试验结果
Table 6. Test results between secondary undisturbed samples and primary undisturbed samples
土样类别 参数 剪应变/×10-4 样本数 0.05 0.1 0.5 1 5 10 50 100 5m二级原状样 G/Gmax 0.9979 0.9958 0.9795 0.9598 0.8287 0.7097 0.3365 0.2046 23 λ 0.0107 0.0138 0.0258 0.0342 0.0645 0.0820 0.1198 0.1300 5m一级原状样 G/Gmax 0.9980 0.9961 0.9808 0.9623 0.8378 0.7230 0.3499 0.2138 23 λ 0.0193 0.0239 0.0401 0.0505 0.0852 0.1042 0.1445 0.1555 10m二级原状样 G/Gmax 0.9970 0.9941 0.9713 0.9448 0.7839 0.6532 0.2902 0.1729 23 λ 0.0126 0.0168 0.0336 0.0461 0.0942 0.1232 0.1873 0.2046 10m一级原状样 G/Gmax 0.9968 0.9937 0.9694 0.9409 0.7657 0.6252 0.2612 0.1526 23 λ 0.0133 0.0181 0.0376 0.0516 0.1031 0.1320 0.1909 0.2060 5m二级原状样/
5m一级原状样G/Gmax 0.9999 0.9997 0.9987 0.9975 0.9890 0.9815 0.9619 0.9572 23/23 λ 0.5535 0.5766 0.6434 0.6765 0.7566 0.7869 0.8291 0.8363 10m二级原状样/
10m一级原状样G/Gmax 1.0002 1.0004 1.0019 1.0041 1.0238 1.0448 1.1111 1.1329 23/23 λ 0.9516 0.9264 0.8951 0.8930 0.9138 0.9334 0.9808 0.9935 -
-


 下载:
下载:

