The Study of Sample Size on b-value Statistics in the Gutenberg-Richter's Law
-
摘要: b值是研究地震活动的重要指标,其广泛应用于地震危险性分析和地震预测研究之中,与实际资料的完整性、样本量的大小、计算方法等因素有着重要的关系。常见的b值计算方法有最小二乘法和最大似然法,样本量的大小对这2种方法影响很大。本文利用蒙特卡罗模拟地震目录和汾渭地震带实际目录作为样本,从中抽取不同大小的样本量进行计算,研究不同样本量下这2种方法计算得到的b值与设定值或真实值之间的差别。结果表明,最小二乘法需要的最低样本量为1000,最大似然法为200;当样本量达不到要求时,计算出的b值是不可靠的;由于对样本量的要求不同,前者适用于计算区域的整体b值,而后者在研究某区域b值在时间轴上的变化方面更有优势。本研究为确定2种b值计算方法对样本量的最低要求提供了参考依据。Abstract: The b-value is an important indicator for evaluating the level of seismicity, and is widely used in seismic hazard analysis and earthquake prediction research. The b-value is basically effected by some factors, such as the actual data integrity, the quantity of earthquake samples, calculation methods and so on. The most widely used two methods for calculating b values include the least square method (LSM) and the maximum likelihood method (MLM), and the results from both methods can remarkably vary with different the quantity of earthquake samples. In this paper, based on the real catalog of the Fen-Wei seismic zone and the Monte-Carlo simulated earthquake catalog, we use different number of samples to calculate the b values and try to find the differences between the calculated results and the set values/true values. It turns out that the threshold value of samples is 1000 and 200 for LSM and MLM, respectively. When the sample size does not meet the requirements, the calculated b-value is not reliable. It suggets that LSM is suitable for calculating the b-value of the whole region, while MLM is more advantageous in studying the b-value of a region on the time axis. This study provides a reference for the threshold values of the samples for two methods, which is of great significance to the seismic hazard analysis and earthquake prediction.
-
Key words:
- b-value /
- The least square method /
- The maximum likelihood method /
- Sample size
-
表 1 最大似然法模拟结果
Table 1. Simulation results by the maximum likelihood method
N b1 Pr- Pr Pr+ σ 10 1.221 0.46 0.14 0.40 0.42 20 1.211 0.46 0.25 0.29 0.38 50 1.145 0.44 0.30 0.16 0.16 100 1.061 0.53 0.37 0 0.13 200 1.039 0.52 0.48 0 0.11 400 1.036 0.47 0.53 0 0.09 500 1.025 0.45 0.55 0 0.08 1000 1.003 0.30 0.70 0 0.08 表 2 最小二乘法模拟结果
Table 2. Simulation results by the least squares method
N b1 Pr- Pr Pr+ σ 10 0.870 0.79 0.08 0.13 0.52 20 0.895 0.76 0.07 0.17 0.48 50 0.918 0.68 0.27 0.05 0.42 100 0.941 0.64 0.28 0.08 0.37 200 0.942 0.46 0.48 0.06 0.32 400 0.955 0.48 0.52 0 0.28 500 0.982 0.45 0.50 0.05 0.16 1000 0.996 0.20 0.80 0 0.12 表 3 汾渭地震带地震分档统计和年平均发生率
Table 3. The annual average incidence of different magnitude-class in Fen-Wei seismic zone
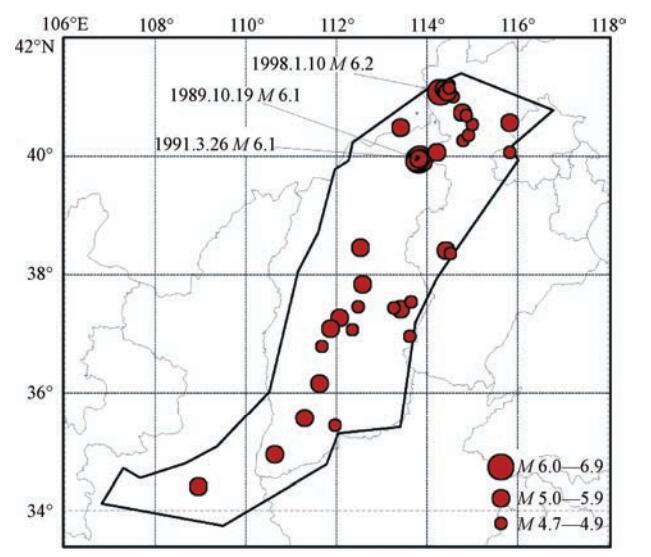
震级档M 地震个数 年平均发生率 2.0—2.4 5038 119.95 2.5—2.9 2006 47.76 3.0—3.4 734 17.48 3.5—3.9 230 5.61 4.0—4.4 110 2.62 4.5—4.9 91 2.17 5.0—5.4 15 0.36 5.5—5.9 10 0.23 6.0—8.5 3 0.07 注:年平均发生率指震级≥M的年均地震数,代表地震活动水平。 表 4 汾渭地震带b值拟合情况(1500—2010年)
Table 4. The b value fitting of earthquakes from 1500—2010 in the Fen-Wei seismic zone
样本量 均匀抽样计算b值 最小二乘法 最大似然法 10 0.60 0.897 50 0.62 0.923 100 0.63 0.816 200 0.63 0.728 300 0.65 0.767 500 0.69 0.752 700 0.70 0.756 1000 0.72 0.746 2000 0.74 0.751 5000 0.75 0.753 -
韩渭宾, 2003.b值在地震预测中的三类应用及其物理基础与须注意的问题.四川地震, (1):1-5. doi: 10.3969/j.issn.1001-8115.2003.01.001 韩晓明, 张文韬, 王树波等, 2016.河套地震带的b值时空变化特征分析.中国地震, 32(3):522-532. doi: 10.3969/j.issn.1001-4683.2016.03.009 胡聿贤, 1999.地震安全性评价技术教程.北京:地震出版社. 黄玮琼, 时振梁, 曹学锋, 1989.b值统计中的影响因素及危险性分析中b值的选取.地震学报, 11(4):351-361. http://www.wanfangdata.com.cn/details/detail.do?_type=perio&id=QK000005188048 黄玮琼, 李文香, 曹学锋, 1994a.中国大陆地震资料完整性研究之一——以华北地区为例.地震学报, 16(3):273-280. http://www.wanfangdata.com.cn/details/detail.do?_type=perio&id=QK199400057115 黄玮琼, 李文香, 曹学锋, 1994b.中国大陆地震资料完整性研究之二——分区地震资料基本完整的起始年分布图象.地震学报, 16(4):423-432. http://www.wanfangdata.com.cn/details/detail.do?_type=perio&id=QK199400057138 黄玮琼, 李文香, 1998.地震区划中b值统计时空范围的确定.地震学报, 20(5):2-6. http://www.wanfangdata.com.cn/details/detail.do?_type=perio&id=QK199800071609 焦远碧, 吴开统, 杨满栋, 1990.我国地震台网监测能力及台网观测条件质量评定.中国地震, 6(4):3-9. http://www.wanfangdata.com.cn/details/detail.do?_type=perio&id=QK000003894076 刘方斌, 曲均浩, 田兆阳等, 2017.鲁西南聊考断裂带地震危险性评价与活动性分布.大地测量与地球动力学, 37(8):802-807. http://d.old.wanfangdata.com.cn/Periodical/dkxbydz201708007 刘静伟, 吕悦军, 2016.川滇地区b值空间分布特征及其与震源类型关系的初步探讨.震灾防御技术, 11(3):561-572. http://zzfy.eq-j.cn/zzfyjs/ch/reader/view_abstract.aspx?flag=1&file_no=20160312&journal_id=zzfyjs 潘华, 李金臣, 2006.地震统计区地震活动性参数b值及ν4不确定性研究.震灾防御技术, 1(3):218-224. doi: 10.3969/j.issn.1673-5722.2006.03.006 任雪梅, 2011.地震区划中b值统计的若干问题研究.北京: 中国地震局地球物理研究所. 任雪梅, 高孟潭, 冯静, 2011.地震目录的完整性对b值计算的影响.震灾防御技术, 6(3):257-268. doi: 10.3969/j.issn.1673-5722.2011.03.005 沈建文, 余湛, 邱瑛, 2007.地震安评中地震活动性的统计区域与b值.国际地震动态, (3):1-6. doi: 10.3969/j.issn.0253-4975.2007.03.001 王熠熙, 张辉, 刘双庆等, 2015.河北平原地震带b值时空变化特征.地震工程学报, 37(01):188-195. doi: 10.3969/j.issn.1000-0844.2015.01.0188 吴兆营, 薄景山, 刘志平等, 2005.东北地震区b值和地震年平均发生率的统计分析.东北地震研究, 21(3):27-32, 72. doi: 10.3969/j.issn.1674-8565.2005.03.002 谢卓娟, 吕悦军, 张力方, 等, 2012a.基于现代地震资料确定汾渭地震带分区及其地震活动性参数.地球物理学进展, 27(3):894-902. http://d.old.wanfangdata.com.cn/Periodical/dqwlxjz201203009 谢卓娟, 吕悦军, 彭艳菊等, 2012b.东北地震区小震资料完整性分析及其对地震活动性参数的影响研究.中国地震, 28(3):256-265. http://d.old.wanfangdata.com.cn/Periodical/zgdz201203003 谢卓娟, 吕悦军, 兰景岩等, 2013.b值和V4的统计分析及其不确定性对地震危险性分析结果的影响研究.地震研究, 36(1):86-92. doi: 10.3969/j.issn.1000-0666.2013.01.013 谢卓娟, 李山有, 吕悦军, 2015.滇西南地区主要活动断裂的b值空间分布特征.地球科学(中国地质大学学报), 40(10):1755-1766. http://d.old.wanfangdata.com.cn/Periodical/dqkx201510016 徐伟进, 高孟潭, 2014.中国大陆及周缘地震目录完整性统计分析.地球物理学报, 57(9):2802-2812. http://qikan.cqvip.com/article/detail.aspx?id=662579475 鄢家全, 韩炜, 高孟潭, 1996.地震活动性参数的不确定性及其对区划结果的影响.中国地震, 12(S1):71-77. http://www.wanfangdata.com.cn/details/detail.do?_type=perio&id=QK199600869176 张广伟, 2016.云南地区地震的重新定位及b值研究.中国地震, 32(1):54-62. doi: 10.3969/j.issn.1001-4683.2016.01.005 张建中, 1974a.蒙特卡洛方法(Ⅰ).数学的实践与认识, (01):28-40. http://www.wanfangdata.com.cn/details/detail.do?_type=perio&id=QK000002863962 张建中, 1974b.蒙特卡洛方法(Ⅱ).数学的实践与认识, (02):43-56. http://www.wanfangdata.com.cn/details/detail.do?_type=perio&id=QK000002863976 周公威, 张伯明, 吴忠良等, 2007.中国数字地震台网(CDSN)的近期发展.地球物理学进展, 22(4):1130-1134. doi: 10.3969/j.issn.1004-2903.2007.04.018 Maximum likelihood estimate of b in the formula logN=a-bM and its confidence limits. Bulletin of the Earthquake Research Institute, 43(2): 237-239. Gulia L., Wiemer S., 2010. The influence of tectonic regimes on the earthquake size distribution:A case study for Italy. Geophysical Research Letters, 37(10):L10305. http://adsabs.harvard.edu/abs/2010GeoRL..3710305G Nava F. A., Márquez-Ramírez V. H., Zúñiga F. R., et al., 2017. Gutenberg-Richter b-value maximum likelihood estimation and sample size. Journal of Seismology, 21(1):127-135. doi: 10.1007/s10950-016-9589-1 Rundle J. B., 1989. Derivation of the complete Gutenberg-Richter magnitude-frequency relation using the principle of scale invariance. Journal of Geophysical Research:Solid Earth, 94(B9):12337-12342. doi: 10.1029/JB094iB09p12337 Rotondi R., Garavaglia E., 2002. Statistical Analysis of the Completeness of a Seismic Catalogue. Natural Hazards, 25(3):245-258. doi: 10.1023/A:1014855822358 Schorlemmer D., Wiemer S., Wyss M., 2005. Variations in earthquake-size distribution across different stress regimes. Nature, 437(7058):538-542. http://cn.bing.com/academic/profile?id=ecb926e431866325a8ddc74b59472232&encoded=0&v=paper_preview&mkt=zh-cn Utsu T., 1965. A method for determining the value of b in a formula logN=a-bM showing the magnitude-frequency relation for earthquakes. Geophysical Bulletin of Hokkaido University, (13):99-103. Wiemer S., Wyss M., 2000. Minimum magnitude of completeness in earthquake catalogs:examples from Alaska, the Western United States, and Japan. Bulletin of the Seismological Society of America, 90(4):859-869. doi: 10.1785/0119990114 -


 下载:
下载:


